Analys
Shale oil denial once again?


Equities across the board rebounded 0.7% ydy following the recent North Korea driven sell-off. The USD Index however gained 0.4% on the day which helped to drive all commodity indices lower with the overall Blbrg commodity index down 0.7% with energy losing the most. Brent crude sold down 2.6% closing at $50.73/b while the longer dated Brent Dec 2020 contract only lost 1% closing at $52.62/b.

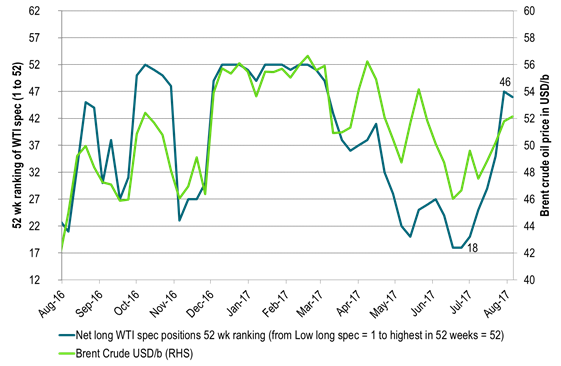
Since a Brent crude oil price low of $44.35/b in June 21st net long speculative WTI positions have moved in only one direction – up. Since then the number of net long speculative WTI contracts have increased by 156,000 contracts (+42%) or 156 mb. As of Tuesday last week the number of net long speculative WTI contracts stood at 532,000 contracts which was the 7th highest speculative position over the past 52 weeks. Except for the release of the US EIA’s monthly Drilling Productivity report there was little in the news that warranted the 2.6% sell-off in Brent crude oil prices other than speculators taking money off the table following 7 consecutive weeks of rising long bets.
Crude oil comment – Shale oil denial once again?
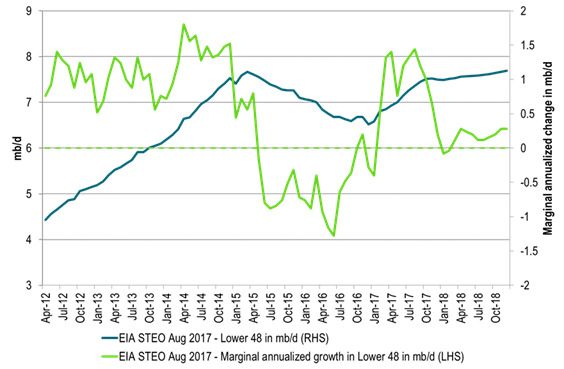
What puzzles us a lot is graph 2 below. It shows the US EIA’s projection of US crude oil production coming out of Lower 48 states (i.e. ex Gulf of Mexico and Alaska). Thus it basically constitutes US shale oil production even though it includes a million or two of US crude production which is not shale oil as well.
What the the US EIA STEO August report projects is that from January to September the marginal, annualized Lower 48 crude oil production growth has averaged 1.25 mb/d. That we buy into. Then however, from October 2017 onwards their projected growth rate then suddenly collapse to a marginal annualized growth rate of only +0.2 mb/d all to the end of 2018 (on average).
When the US shale oil production was booming from 2011 to 2015 the story was always that yes, production is growing strongly now, but next year it will taper off. The tapering off never happened before the oil price collapsed and all breaks were on. During 2012, 2013 and 2014 the US shale oil production grew relentlessly at an annual pace of 1 mb/d.
Thus even if the market is fully aware of US shale oil these days. Fully aware that rigs are rising and productivity is rising. The story still looks a bit the same in terms of what the US EIA currently is projecting in its August STEO report. Yes, shale oil is growing at a strong marginal, annual pace now, but from October onwards it is all going to slow sharply. Thus shale oil awareness is definitely there but is it again too pesimistic in terms of volumes delivered down the road just as was the case consistently from 2012 to 2014/15. Still some kind of shale oil denial in a way in terms of production down the road.
Yesterday the US EIA released its drilling productivity report (DPR) and its DUC’s report (Drilled wells and uncompleted wells). First out the reports stated a projection that US shale oil production will increase by 117 kb/d mth/mth to September. That equals a marginal, annualized pace of 1.4 mb/d per year. The puzzle is that the EIA projects that this strong growth rate is going to suddenly fall back in October onwards.
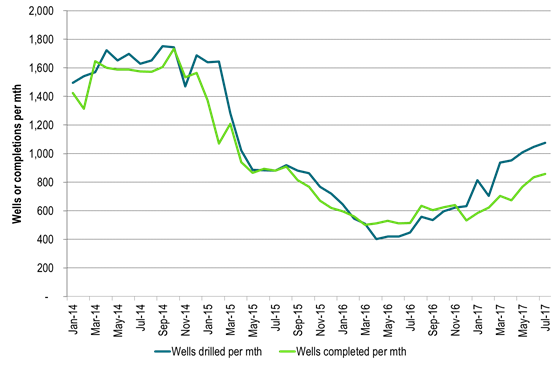
What was further revealed was that the number of completed wells per month continued to rise by 25 wells mth/mth to 859 wells in July. Completions were however still trailing way behind the number of wells drilled by more than 200 wells. Wells drilled reached 1075 wells in July which also was an increase mth/mth by 28 wells. Thus completions are rising but are still solidly trailing behind drilling of wells.
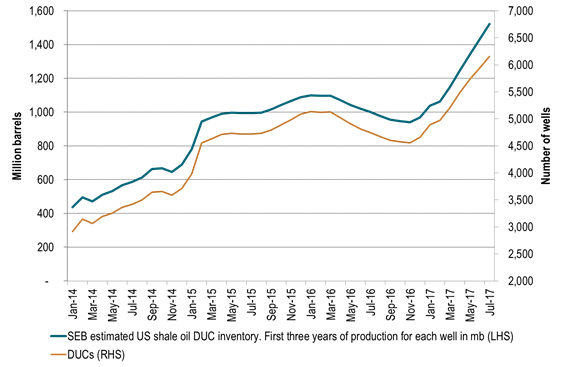
For US shale oil production to slow down we first need to see a halt in the number of drilling rigs being added into operation. Only 2 implied shale oil rigs were added last week, but the number is still rising marginally rather than falling. But yes, that part is slowing down. The next step then is to see that completions manage to catch up with drilling. I.e. completions needs to move from a July level of 859 wells completed to at least 1075 wells drilled. Then the last step is that completions start to draw down the now very high DUC inventory which has seen an increase of 1595 wells since November 2016 now standing at 6154 wells.
So during the unavoidable (some time in the future) draw down period of DUCs we need to see that completions move above drilled wells per month in order to draw down the DUC inventory. I.e. the number of wells completed should move above 1075 wells per month unless of course the number of drilling rigs declines. A lower oil price or reduced access to capital is typically the driving forces which would lead to a reduction in drilling rigs. Captial spending and profitability is definitely at the top end of the agenda these days in the shale oil space.
In terms of the DUC inventory build up. In perspective the 1595 wells added since November last year equates to some 5-600 million barrels of additional producible oil within a three year time frame. That is if we assume 350,000 barrels of oil from each well during the first three years of production on average for all wells.
In this perspective it is difficult to understand the US EIA’s projection that US L48 crude oil production growth is going to slow sharply from October onwards. Drilling rigs are still rising (although slowly) and completions still has a lot of catching up to do just to get up to speed with drilling and then some to draw down the DUC inventory.
Not surprisingly we are bullish for US crude oil production for 2018 where we expect US crude oil production to increase y/y by 1.5 mb/d rather than the US EIA’s y/y projecting that US crude oil will only increase 0.6 mb/d y/y to 2018.
OPEC will have a lont on its hands in 2018 and will likely need to manage supply all through to the end of 2018 rather than to end of Q1-17.
(Data for drilling and completions etc in this report were for the regions Anadarko, Bakken, Eagle Ford, Niobrara and Permian and are from the US EIA.)
Ch1 – Net long specs in WTI reached the 7th highest in a year last Tuesday
A strong, long rise in net long spec since the price low in late June
Sideways price action during most of August with no success to the upside when Brent hit $53.64/b.
Then dollar headwinds and North Korea risk aversion. Both pushing specs to take money off the table
Oil prices in graph are averaged over weeks ending Tuesday. Same as specs reporting

Ch2 – US EIA STEO August report projects a sharp slowdown in marginal growth in US L48 crude oil production from October onwards
How is that possible when drilling rig count is still rising and completions are still working hard catching up rising as well.

Ch3 – Completions of shale wells rising as they try to catch up to drilled wells per month which is also rising (US EIA August DUC report)
Today’s level looks unimpressive versus 2014 levels. But they need to be adjusted with productivity improvements

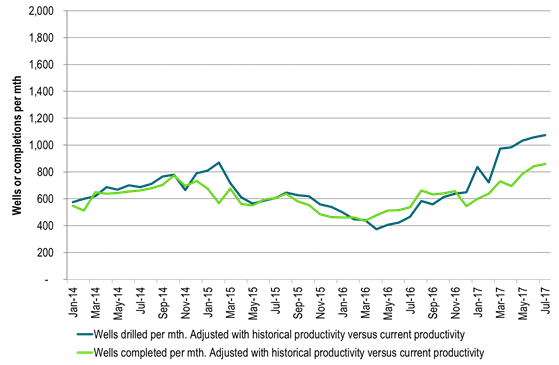
Ch3 – Productivity adjusted – Completions of shale wells rising as they try to catch up to drilled wells per month which is also rising (US EIA August DUC report)
If we productivity adjust the historical data of number of wells drilled and completed with productivity then:
a) Number of drilled wells today per month is 40% higher then the previous peak in September 2014
b) Number of completed wells is 11% higher than the previous peak in October 2014
If completions catches up to current drilling then completions will run 40% higher than the previous peak in October 2014 in productivity adjusted terms.
Ch 4 – Strong rise in DUC (uncompleted wells) inventory since November last year
Equating it to oil it has increased close to 600 mb since Nov last year in terms of oil from first three years of production each well

Kind regards
Bjarne Schieldrop
Chief analyst, Commodities
SEB Markets
Merchant Banking