

Analys
SEB – Råvarukommentarer, 7 januari 2013
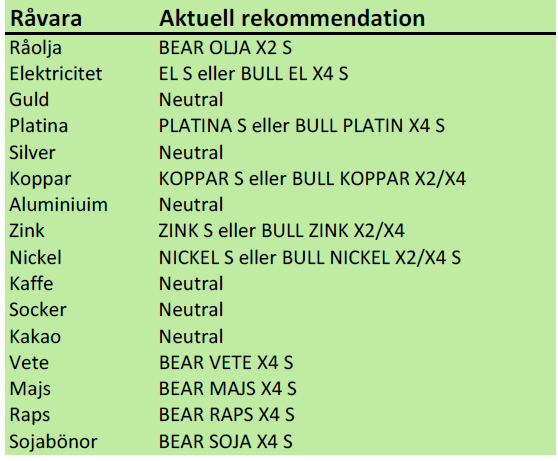
Sammanfattning av rekommendationer
Nyheter
Elpriset har nu på morgonen brutit sitt tekniska motstånd och har redan stigit 3%.
Vinnare och förlorare under 2012
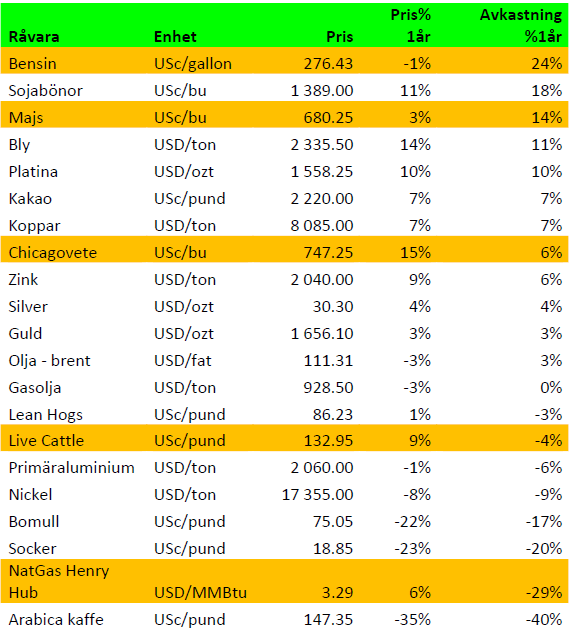
Bäst totalavkastning förra året hade bensin och sojabönor med +24% och 18%. Detta trots att priset på bensin föll med 1% mellan den sista december 2011 och den sista december 2012. Källan till den goda avkastningen är den rabatt man tillgodogjort sig varje gång man sålt ett “gammalt” terminskontrakt och köpt ett nytt. Terminerna med längre löptid har varit billigare än de med kortare löptid. När tiden går, försvinner rabatten och man kan sälja det köpta terminskontraktet till ett högre pris och alltså göra en vinst. Flera gånger under året.
I tabellen nedan har vi markerat de råvaror som haft en exceptionellt stor skillnad mellan årets prisförändring och den avkastning som en investerare i terminsmarknaden via börshandlade certifikat har fått. I vissa fall har terminsmarknaden handlats med rabatt, vilket lett till vinster. I en del andra fall har terminerna handlats med premium, vilket lett till förluster. Naturgas är en marknad som vanligtvis handlas med enorm premie i terminsmarknaden. Den prisuppgång på 6% som ägde rum förra året förslog föga att kompensera förlusten på terminspremien. Så har det nästan alltid varit. Av den anledningen kan den som köper ett BEAR NATGAS X4 S få extra vind i seglen genom att premien vänds till vinst när man ligger kort.
Råolja – Brent
Det genomsnittliga priset på Brent råolja blev det högsta någonsin förra året, 111.5 dollar per fat. Därmed slogs rekordet från 2011 på 110.9 dollar. Brenten stängde över 100 dollar varje dag under året, utom 24 handelsdagar i juni och juli. OPECkartellen, som har en mycket låg produktionskostnad för sin råolja beräknas ha inkasserat 1 biljon dollar förra året. En del av detta hamnar i Förenade Arabemiratens, Saudiarabiens och Kuwaits ”Soverign Wealth Funds”, varifrån de återinvesteras i värdepapper runt om i världen. Den Internationella Valutafonden (IMF) beräknar att både Saudiarabien och Abu Dhabi behöver ha ett oljepris minst på 80 dollar per fat för att balansera deras budgetar. För tio år sedan var samma nivå 25 dollar per fat.
Karteller är som bekant olagliga och leder till fängelsestraff, utom när det gäller karteller på statlig nivå i råvarumarknaden.
OPEC anses idag endast kunna påverka priset genom att strypa produktionen och motverka större prisfall. De har inte ledig kapacitet nog att begränsa eller dra nytta av högre priser genom att producera mer. Det gör att oljemarknaden erbjuder något asymmetrisk risk – begränsad nedsidesrisk på priset, men relativt obegränsad uppsida.
Årets första vecka inleddes med stigande oljepris, vilket var i linje med alla andra riskplaceringar när världens marknader drog en lättnads suck efter överenskommelsen i den amerikanska kongressen om budgetstupet. Som högst noterades Brent nära 113 usd/fat. Positiv PMI statistik, inte minst från Kina samt amerikansk sysselsättningsstatistik bidrog dessutom till det positiva sentimentet.
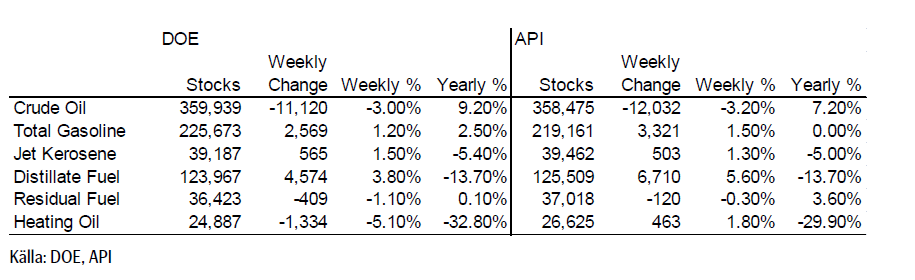
Förra veckans oljelagerstatistik från DOE levererade långt från marknadens förväntan. Råoljelagren minskade mycket kraftigt, hela -11.1 mfat! (förväntat -1.0). Samtidigt ökade produktlagren också, bensin +2.7 och distillates +4.6 mfat. Sammantaget var nettoförändringen således inte jättedramatisk och marknaden tog det också ganska sansat, kanske för att uppgången redan börjat komma av sig.
Momentum i uppgången avtog alltså rätt snabbt. I mångt och mycket liknade veckan handelsdagarna som följde efter det amerikanska presidentvalet, då marknaden först skickade kurserna i skyn för att sedan dissekera vad som hänt – inte särskilt mycket. Många svåra förhandlingar kvarstår, även om den akuta situationen med de automatiska skattehöjningarna och annat tillväxtovänligt eliminerades. En skillnad är ändå att makrostatistiken, i både Kina och USA, nu verkar vänt mer positiv. Protokollet från FED: december FOMC möte visade på viss oenighet, då flera ledamöter uttryckt tveksamhet för effektiviteten i centralbankens gigantiska köp av tillgångar och att riskerna kanske är större än vad utfallet av åtgärderna motiverar.
Kontraktet föll så tillbaka och stängde veckan relativt oförändrat på 111.40 usd/fat.
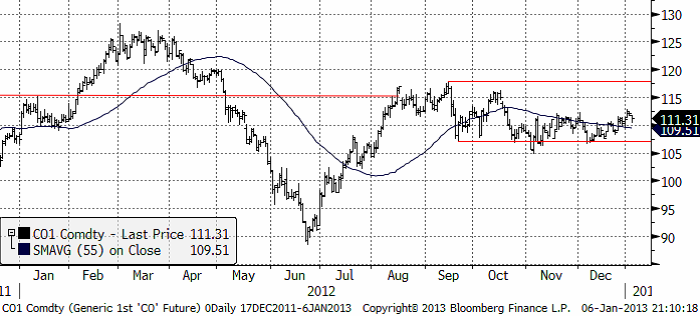
Trots bättre (förhoppningsvis) omvärldsutsikter, så anser vi att den förväntat mindre ansträngda utbuds-/efterfrågebalansen, vilken kommer börja slå igenom under första halvan av 2012, bör väga på Brentkontraktet framöver. Den senaste tidens uppgång (sedan mitten av december) går därför att utnyttja för att gå kort. Kring nuvarande nivå (110-113 usd/fat), ser vi potential för en nedgång och rekommenderar en kort position i något av våra BEAR eller SHORT certifikat på Brent.
Elektricitet
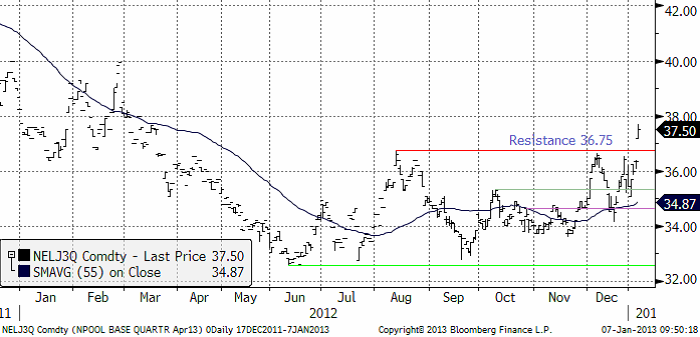
Elpriset har nu på morgonen brutit det viktiga motståndet på 36.75 euro per MWh, som du ser i diagrammet nedan!
Det innebär att vi nu har en haussemarknad och att baisse-marknaden är över. Däremot tycker vi att det idag har gått för fort och för mycket. Vi tror att det kan komma en rekyl ner mot motståndsnivån igen, som nu är den huvudsakliga stödnivån.
Då bör man raskt etablera en köpt position i elpriset, t ex med BULL EL X2 S eller BULL EL X4 S om man vill ha högre utväxling – och risk. Minns att vi haft köprekommendation i över en månad redan. Som normal, sund, riskhantering, kan de som legat köpta och har goda vinster, kortsiktigt utnyttja tillfället och ta hem en del av vinsterna för att senare förhoppningsvis kunna komma in på en eventuell rekyl igen.
Anledningen till prisuppgången idag är vädret, med mindre nederbörd och kallare temperatur (högtryck). Däremot faller marginalkostnaden för att producera el med kol. Vädret är en kortsiktig faktor, måste man komma ihåg.
Efter en kall och relativt torr första del av december, så vände vädertypen till mildare, blötare väder. Trots det såg vi ingen kollaps i spotpriset under helgerna (med undantaget Danmark som faktiskt p g a låg förbrukning och mycket vindkraftproduktion stundtals hade negativa priser, under juldagen -38.4 EUR/MWh!!). Systempriset var som lägst (nyårsafton) 31.73 EUR/MWh. Den hydrologiska balansen är fortsatt kring normal nivå. Hela överskottet om ca 12 TWh försvann under köldknäppen som var.
Marginalkostnad för fossileldad produktion har mestadels varit fallande, både kol och CO2 priserna har sjunkit men viss dämpning erhölls de senaste dagarna, då dollarn förstärkts mot euron (kol handlas i USD). Differensen mellan elterminerna pch marginalkostnaden är oroväckande stor ut men kan till viss del förklaras av att den hydrologiska balansen nu är återställd. Vi ser hur marginalkostnaden för kolkraft fallit i diagrammet nedan, och elpriset stigit.
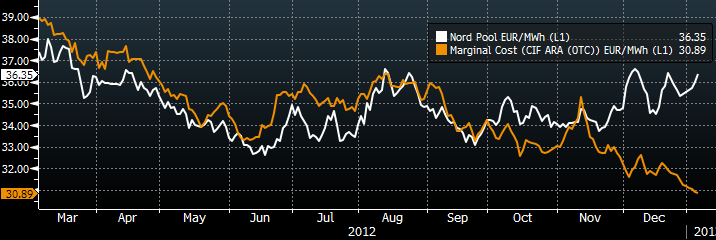
Terminshandeln har varit helg-tunn men förväntas komma igång mer denna vecka. Vädret har varit den dominerande prisdrivaren och terminspriserna föll under mildväderinfluens under julveckan men återhämtades helt förra veckan, då vädret åter svängt till mer högtrycksbetonat. På fredagen stängde Q2-13 terminen (den våra certifikat följer) på 36.35 EUR/MWh.
Vi tror vädret kommer fortsätta styra handeln och ser därför god chans till ytterligare uppgång under veckan. Vi håller därför, tillsvidare, fast vid vår long rekommendation.
Naturgas
Idag klockan 18 publicerar EIA (US Department of Energy) sin månatliga rapport på bruttoproduktionen av naturgas i USA. Förra veckans rapport på estimerade lager sjönk med 135 miljarder kubikfot. Det var en större minskning än vad analytikerkåren hade räknat med. De hade enligt en sammanställning på Bloomberg räknat med en lagerminskning med 130 miljarder kubikfot. De totala lagren i USA uppgår till 3.5 biljoner kubikfot, vilket är 0.7% mer än samma tid förra året.
Naturgaspriset föll till sin lägsta nivå sedan slutet av september förra veckan. Prognoser om milt vinterväder under resten av januari lockade fram säljarna.
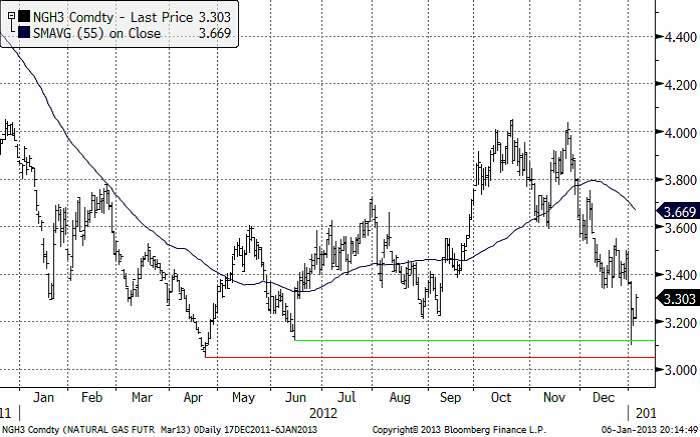
Nästa lagerrapport från EIA publiceras på torsdag klockan 16:30 svensk tid. Den går att läsa direkt från DOE:s hemsida. Nedan ser vi ett kursdiagram på mars-kontraktet på NYMEX-börsen. Det är detta kontrakt som just nu är underliggande i BULL NATGAS X4 S och BEAR NATGAS X4 S. Vi ser att det finns starka stöd precis under dagens kursnivå. Det ger i sig ingen anledning att rekommendera köp, men man bör i vart fall inte vara köpt BEAR NATGAS X4 S, så länge stödnivåerna håller.
Guld och Silver
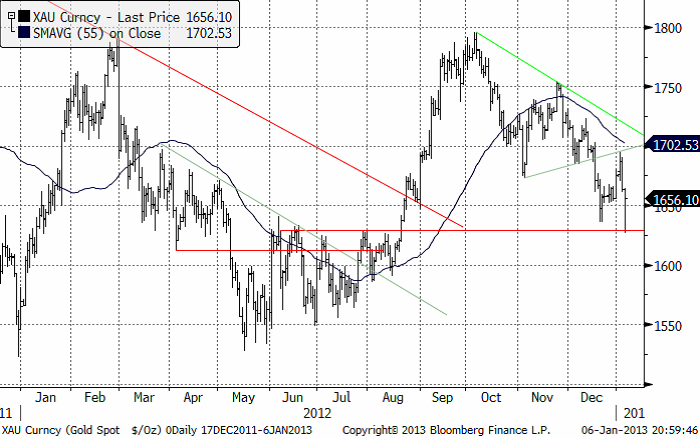
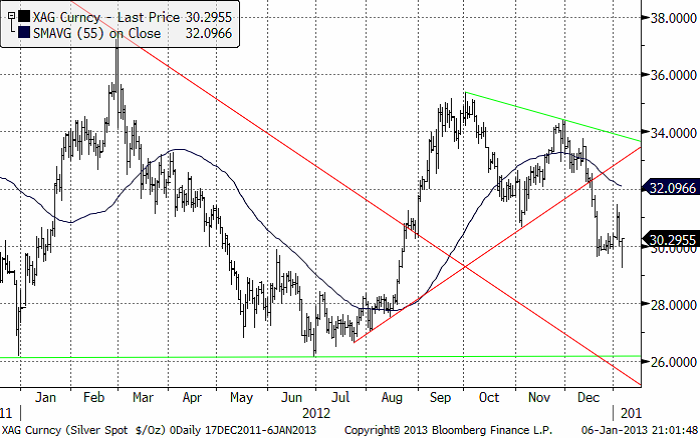
Både guld och silver har med sjunkande toppnoteringar och stigande bottennoteringar sedan början på hösten, bildat så kallade ”triangelformationer”. Dessa bröts i december och sedan följde ganska snabbt fallande priser. Guld är nu som vi ser nere på en teknisk stödnivå vid 1625. Med tanke på att ”Fiscal Cliff” i USA inte är borta från agendan, utan återkommer om två månader, kommer oron sannolikt att finnas kvar för tillståndet i USA:s ekonomi. Det finns delade meningar om vad en ”fiscal cliff” eller politisk uppgörelse om besparingar och skattehöjningar skulle ha för effekt på guldpriset. Men mitt i allt håller FED fortfarande en ränta på nollstrecket och lär så göra bortom överskådlig tid.
Nedan ser vi kursdiagrammet för silver i dollar per troy ounce. Situationen är identisk med den för guld. Tekniskt skulle dock silverpriset kunna falla ytterligare två dollar per uns innan fastare stöd finns.
Platina
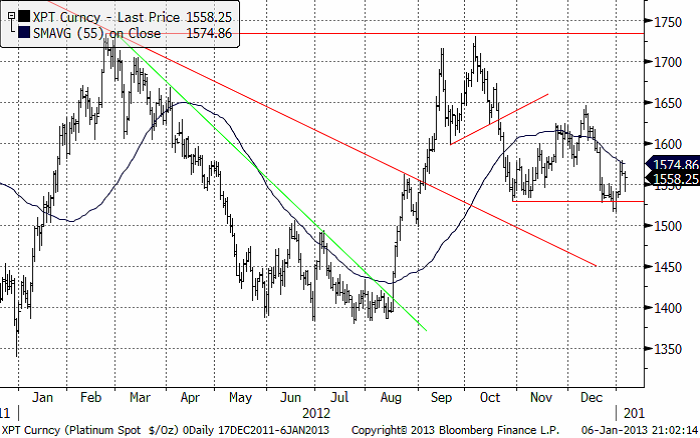
Platinapriset har klarat rekylen bättre än guld och silver. Platina har varit och är fortfarande vår favorit bland ädelmetallerna.
Ska man äga en ädelmetall tycker vi att det ska vara platina i första hand, framför guld och silver. I kursdiagrammet nedan ser vi att priset på platina hållit sina stödnivåer, till skillnad från guld och silver, som fallit rakt igenom. Vi tar detta som ett tecken på platinas relativa styrka. Det brukar vara så att den som i baissemarknader klarar sig bäst också i en följande hausse är den som har lättast att stiga.
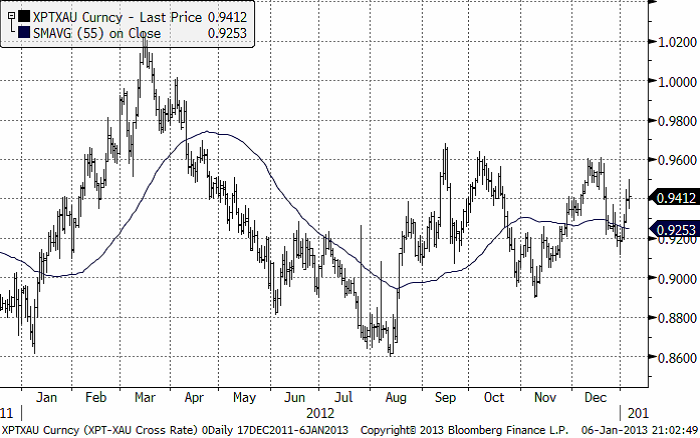
Nedan ser vi priset på platina i termer av guld, eller ”växelkursen” mellan XPT och XAU, valutakoderna för de två ädelmetallerna. Vi ser att platina stigit i förhållande till guld sedan mitten av förra året.
Basmetaller
Mellandagshandeln höll sig lugn med en sidledes rörelse i marknaden i avvaktan på ett beslut i USA:s båda kamrar. Världens alla finansmarknader väntade. Representanthuset gav världen en riktig ”cliff-hanger” skrev våra makroekonomer i morgonbrevet den 2 januari. Det dröjde som bekant ända till nyårsdagen innan marknaden fick ett besked om beslut i både senaten och representanthuset. Reaktionen på överenskommelsen blev ganska dramatisk, framför allt för basmetallerna som igenomsnitt steg med 3 % under årets första handelsdag. Det stod emellertid snart klart att överenskommelsen egentligen inte betyder annat än att de svåra förhandlingarna om minskade offentliga utgifter är framskjutna i två månader. Effekterna av de begränsade skattehöjningarna är marginella.
Den inledande euforin blev som väntat kortvarig. Redan på torsdagen föll priserna tillbaka lika kraftfullt som de stigit dagen innan, men inte hela vägen tillbaka. Metallerna är fortfarande upp någon procent på det nya året. Man får inte glömma att de också kommit en del förtroendeingivande statistik. Inköpsindex kom in starkt både i USA och i Kina. Fredagens arbetsmarknadsstatistik från USA kom in som väntat men ingav ändå ökat förtroende i marknaden.
Per den sista december kan vi sammanfatta året 2012 med en blandad tendens för basmetaller. Tenn är vinnaren med en uppgång på 22 %. Bly steg 14 % och zink med 13 %. Koppar och aluminium slutar året marginellt upp med 4 % resp. 3 %. Vi kvarstår med vår bedömning på det nya året med fortsatt starka metallpriser. Konjunkturen i USA och Kina inger förtroende samtidigt som marknaden troligtvis kommer att fortsätta diskontera fler infrastrukturstimulanser från Kina i samband med den nya regeringens tillträde efter det kinesiska nyåret i slutet av februari.
På minussidan finns naturligtvis Europa, där indikatorerna är fortsatt negativa med t.ex. inköpsindex fortfarande under 50- nivån. Beskedet under helgerna från FEDs senaste protokoll indikerade att stimulanserna från QE3 och 4 sannolikt kommer att minska under året påverkade också marknaderna negativt under torsdagen och fredagen. Det kommer också sannolikt komma besvikelser och oro kring de amerikanska budgetförhandlingarna som alltså nu skjutits på framtiden. Med vår i grunden positiva syn på basmetaller (se ovan) tror vi att varje “bakslag” med påföljande prisrekyler, skall betraktas som goda köptillfällen.
Koppar
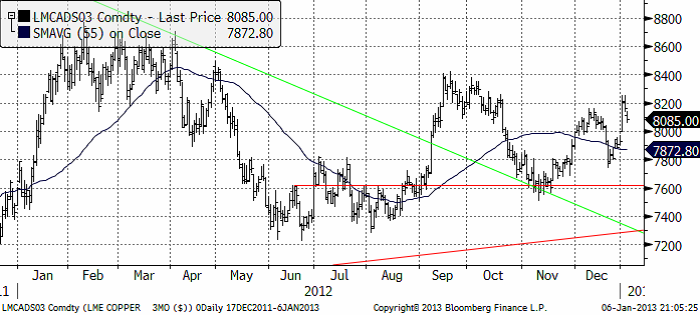
I det förra veckobrevet, som publicerades i mitten av december skrev vi att om LME-noteringen (3 månaders) kom ned mot $7800 var det ett köp. Vi hoppas att alla läsare följde rådet och nu ligger köpt t ex KOPPAR S. Det ser fortfarande ut som om rekylen förra veckan är just en rekyl mot trenden och att det alltså är ett kortsiktigt köptillfälle just nu.
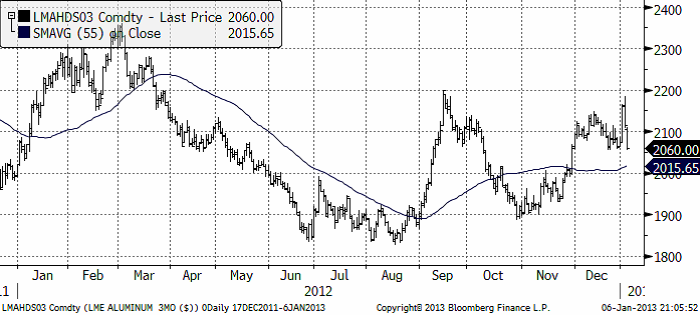
Aluminium
Aluminiummarknaden gjorde ett försök att nå över motståndsnivån vid 2200 dollar per ton vid årsskiftet, men detta misslyckades.
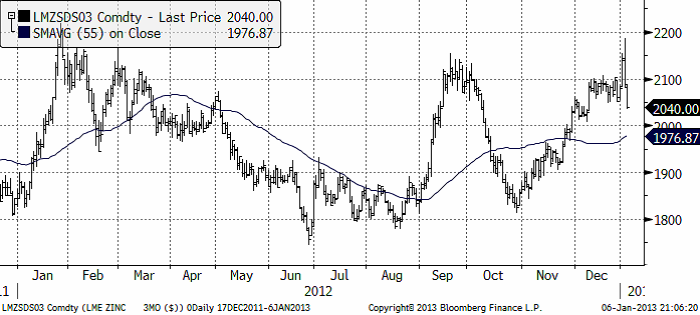
Zink
Zinkpriset har utvecklat sig starkt sedan slutet av oktober och gjorde ett försök förra veckan att testa 2012 års högsta notering. Det misslyckades som vi ser i diagrammet nedan.
Nickel
Nickelmarknaden har varit i fallande trend en stor del av förra året. Sedan slutet av sommaren har en konsolidering ägt rum. Motståndslinjen från toppnoteringen i februari testades i december. Så skedde ytterligare ett test i förra veckan, som nästan bröt igenom. Vi tycker att marknaden ser riktigt intressant ut. Det har etablerats en stark botten på 16000 dollarsnivån, som i stort sett motsvaras av det fundamentala golvet för priset. Under den nivån stängs produktion av metallen, vilket förhindrar ytterligare prisfall. Den negativa trenden ebbar ut allt mer. Det normala i sådana härlägen är att motståndet bryts och en ny uppgångsfas inleds.
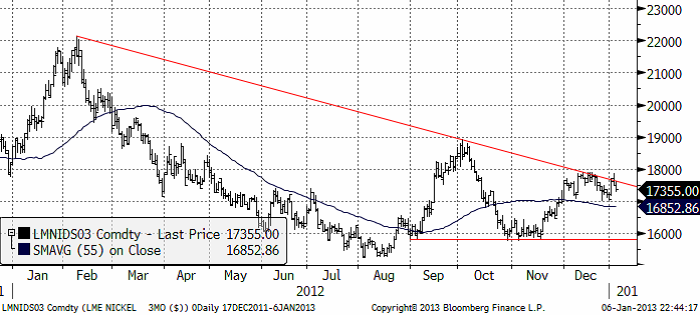
Vi rekommenderar köp av NICKEL S eller BULL NICKEL X2 / X4 S för den som vill ta mer risk. Man bör gå ur positionen om priset faller genom 15,800 dollar per ton, som är stödet i den konsolideringsfas som varit rådande sedan prisfallet slutade i slutet av oktober. Kortsiktigt bör man ta hem vinst vid moståndsnivån $17500. På lite längre sikt är potentialen större. Nästa motståndsnivå kommer in strax under $19000
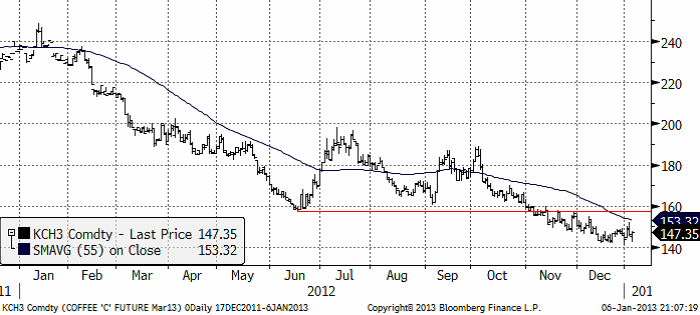
Kaffe
Kaffepriset (mars 2013) ligger i stadig fallande trend. Det är fortfarande bäst att vara såld kaffe.
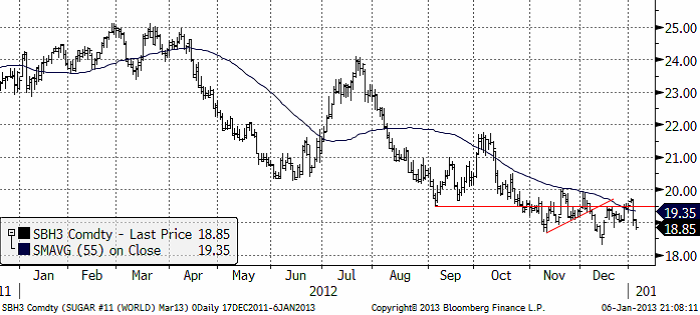
Socker
Sockerpriset (mars 2013) föll under förra året från 24 cent per pund till 19. De senaste två månaderna har priset rört sig ”sidledes”, vilket skulle kunna vara en konsolidering inför en vändning uppåt.
[box]SEB Veckobrev Veckans råvarukommentar är producerat av SEB Merchant Banking och publiceras i samarbete och med tillstånd på Råvarumarknaden.se[/box]
Disclaimer
The information in this document has been compiled by SEB Merchant Banking, a division within Skandinaviska Enskilda Banken AB (publ) (“SEB”).
Opinions contained in this report represent the bank’s present opinion only and are subject to change without notice. All information contained in this report has been compiled in good faith from sources believed to be reliable. However, no representation or warranty, expressed or implied, is made with respect to the completeness or accuracy of its contents and the information is not to be relied upon as authoritative. Anyone considering taking actions based upon the content of this document is urged to base his or her investment decisions upon such investigations as he or she deems necessary. This document is being provided as information only, and no specific actions are being solicited as a result of it; to the extent permitted by law, no liability whatsoever is accepted for any direct or consequential loss arising from use of this document or its contents.
About SEB
SEB is a public company incorporated in Stockholm, Sweden, with limited liability. It is a participant at major Nordic and other European Regulated Markets and Multilateral Trading Facilities (as well as some non-European equivalent markets) for trading in financial instruments, such as markets operated by NASDAQ OMX, NYSE Euronext, London Stock Exchange, Deutsche Börse, Swiss Exchanges, Turquoise and Chi-X. SEB is authorized and regulated by Finansinspektionen in Sweden; it is authorized and subject to limited regulation by the Financial Services Authority for the conduct of designated investment business in the UK, and is subject to the provisions of relevant regulators in all other jurisdictions where SEB conducts operations. SEB Merchant Banking. All rights reserved.

Market is starting to take US/Iran headlines with a pinch of salt. Brent crude rose $2.8/b yesterday to an official close of $112.1/b. But after that it traded as low as $108.05/b before ending late night at around $109.7/b. Through the day it traded in a range of $106.87 – 112.72/b amid a flurry of news or rumors from Iran and the US. ”US temporary sanctions during negotiations” (falls alarm). ”We will bomb Iran” (not anyhow),… etc. While the market is still fluctuating to this kind of news flow, it is starting to take such headlines with a pinch of salt.

We’ll see. Maybe, maybe not. The Brent M1 contract is trading at $110.2/b this morning which very close to the average ticks through yesterday of $110.4/b.
Trump with bearish, verbal intervention whenever Brent trades above $110/b it seems. What seems to be a pattern is that Trump states something like ”very good negotiations going on with Iran”, ”New leaders in Iran are great,..”, ”Great progress in negotiations,…”, ”Deal in sight,..” etc whenever the Brent M1 contract trades above $110/b. An effort to cool the market. These hot air verbal interventions from Trump used to have a heavy bearish impact on prices, but they now seems to have less and less effect unless they are backed by reality.
As far as we can see there has been no real progress in the negotiations between the US and Iran with both sides still standing by their previous demands.
Iran is getting stronger while the cease fire lasts making a return to war for Trump yet harder. Iran is naturally in constant preparation for a return to war given Trump’s steady threats of bombing Iran again. Iran is naturally doing what ever is possible to prepare for a return to war. And every day the cease fire lasts it is better prepared. This naturally makes it more and more difficult and dangerous for the US to return to warring activity versus Iran as the consequences for energy infrastructure in the Persian Gulf will be more and more severe the longer the cease fire lasts. Israel seems to see it this way as well. That the war is not won and that current frozen state of a cease fire gives Iran opportunity to rebuild military and politically.
Global inventories are drawing down day by day. How much? In the meantime the Strait of Hormuz stays closed. There is varying measures and estimates of how much global inventories are drawing down. Our rough estimate, back of the envelope, is that global inventories are drawing down by at least some 10 mb/d or about 300 mb/d in a balance between loss of supply versus demand destruction. Other estimates we see are a monthly draw of 250-270 mb/d. The IEA only ’measured’ a draw in global observable stocks of 117 mb in April with oil on water rising 53 mb while on shore stocks fell 170 mb. But global stocks are hard to measure with large invisible, unmeasured stocks. As such a back of the envelope approach may be better.
Oil products is what the world is consuming. Oil product prices likely to rise while product stocks fall. Strategic Petroleum Reserves (SPR) are predominantly crude oil. Discharging oil from OECD SPR stocks, a sharp reduction in Chinese crude imports and a reduction in global refinery throughput of 6-7 mb/d has helped to keep crude oil markets satisfactorily supplied. But global inventories are drawing down none the less. And oil products is really what the world is consuming. So if global refinery throughput stays subdued, then demand will eventually have to match the supply of oil products. The likely path forward this summer is a steady draw down in jet fuel, diesel and gasoline. Higher prices for these. Then, if possible, higher refinery throughput and higher usage of crude in response to very profitable refinery margins. And lastly sharper draw in crude stocks and higher prices for these. But some 6 mb/d of oil products used to be exported through the Strait of Hormuz. And it may not be so easy to ramp up refinery activity across the world to compensate. Especially as Ukraine continues to damage Russian refineries as well as Russian crude production and export facilities.
Watch oil product stocks and prices as well as Brent calendar 2027. What to watch for this summer is thus oil product inventories falling and oil product premiums to crude rising. Another measure to watch is the Brent crude 2027 contract as it rises steadily day by day as the Strait of Hormuz stays closed and global oil inventories decline. The latter is close to the highest level since the start of the war and keeps rising.
The Brent M1 contract and the Brent 2027 prices and current price of jet fuel in Europe (ARA). All in USD/b

Our back of the envelope calculation of the global shortage created by the closure of the Strait of Hormuz. Note that 3.5 mb/d of discharge from SPR is also a draw. Note also that ’Forced demand loss’ of 2.5 mb/d is probably temporary and will fall back towards zero as logistics are sorted out leaving ’Price demand loss’ to do the job of balancing the market. Thus a shortfall of at least 9 mb/d created by the closure. More if SPR discharge is included and more if Forced demand loss recedes.

Brent is climbing higher. Front-month is at USD 106.3/bl this morning, close to a weekly high and a USD 9/bl jump from Mondays open. This is the move we flagged as a risk earlier in the week: the market shifting from ”a deal is around the corner” to ”this is going to take longer than we thought”.

Analyst Commodities, SEB
During April, rest-of-year Brent remained remarkably stable around USD 90/bl. A stability which rested on one single assumption: the SoH reopens around 1 May. That assumption is now slowly falling apart.
As we highlighted yesterday: every week of delay beyond 1 May adds (theoretically) ish USD 5/bl to the rest-of-year average, as global inventories draw 100 million barrels per week. i.e., a mid-May reopening implies rest-of-year Brent closer to USD 100/bl, and anything pushing into June or July takes us meaningfully higher.
What’s changed in the last 48 hours:
#1: The US military has formally warned that clearing suspected sea mines from SoH could take up to six months. That is a completely different timescale from what the financial market is pricing. Even a political deal tomorrow does not immediately reopen the strait.
#2: Trump has shifted his tone from urgency to ”strategic patience”. In yesterday’s press conference: ”Don’t rush me… I want a great deal.” The market is reading this as a president no longer feeling pressured by timelines, with the naval blockade running in the background.
#3: So far, the military activity is escalating, not de-escalating. Axios reports Iran is laying more mines in SoH. The US 3rd carrier strike group (USS George H.W. Bush) is arriving with two countermine vessels. Trump yesterday ordered the US Navy to destroy any Iranian boats caught laying mines. While CNN reports that the Pentagon is actively drawing up plans to strike Iranian SoH capabilities and individual Iranian military leaders if the ceasefire collapses. i.e., NOT a attitude consistent with an imminent deal!
Spot crude and product prices eased off the early-April highs on a combination of system rerouting and deal optimism. Both now weakening. Goldman estimates April Gulf output is reduced by 14.5 mbl/d, or 57% of pre-war supply, a number that keeps getting worse the longer this drags on.
Demand-side adaptation is ongoing: S. Korea has cut its Middle East crude dependence from 69% to 56% by pulling more from the Americas and Africa, and Japan is kicking off a second round of SPR releases from 1 May. But SPRs are finite.
Ref. to the negotiations, we should not bet on speed. The current Iranian leadership is dominated by genuine hardliners willing to absorb economic pain and run the clock to extract concessions. That is not a setup for a rapid resolution. US/Israeli media briefings keep framing the delay as ”internal Iranian divisions”, the reality is more complicated and points toward weeks and months, not days.
Our point is that the complexity is large, and higher prices have only just started (given a scenario where the negotiations drag out in time). The market spent April leaning on the USD 90/bl rest-of-year assumption; that case is diminishing by the hour. If ”early May reopening” is replaced by ”June, July or later” over the next week or two, both crude and products have meaningful room to reprice higher from here. There is a high risk being short energy and betting on any immediate political resolution(!).
Down on Friday. Up on Monday. The Brent June crude oil contract traded down 5.1% last week to a close of $90.38/b. It reached a high of $103.87/b last Monday and a low of $86.09/b on Friday as Iran announced that the Strait of Hormuz was fully open for transit. That quickly changed over the weekend as the US upheld its blockade of Iranian oil exports while Iran naturally responded by closing the SoH again. The US blew a hole in the engine room of the Iranian ship TOUSKA and took custody of the ship on Sunday. Brent crude is up 5.6% this morning to $95.4/b.
The cease-fire is expiring tomorrow. The US has said it will send a delegation for a second round of negotiations in Islamabad in Pakistan. But Iran has for now rejected a second round of talks as it views US demands as unrealistic and excessive while the US is also blocking the Strait of Hormuz.
While Brent is up 5% this morning, the financial market is still very optimistic that progress will be made. That talks will continue and that the SoH will fully open by the start of May which is consistent with a rest-of-year average Brent crude oil price of around $90/b with the market now trading that balance at around $88/b.
Financial optimism vs. physical deterioration. We have a divergence where the financial market is trading negotiations, improvements and resolution while at the same time the physical market is deteriorating day by day. Physical oil flows remain constrained by disrupted flows, longer voyage times and elevated freight and insurance costs.
Financial markets are betting that a US/Iranian resolution will save us in time from violent shortages down the road. But every day that the SoH remains closed is bringing us closer to a potentially very painful point of shortages and much higher prices.
The US blockade is also a weapon of leverage against its European and Asian allies. When Iran closed the SoH it held the world economy as a hostage against the US. The US blockade of the SoH is of course blocking Iranian oil exports. But it is also an action of disruption directed towards Europe and Asia. The US has called for the rest of the world to engaged in the war with Iran: ”If you want oil from the Persian Gulf, then go and get it”. A risk is that the US plays brinkmanship with the global oil market directed towards its European and Asian allies and maybe even towards China to force them to engage and take part. Maybe unthinkable. But unthinkable has become the norm with Trump in the White House.


Sommarväder skapar prisrally på elbörsen
Oil product price pain is set to rise as the Strait of Hormuz stays closed into summer

Solkraften pressar elpriserna dagtid

Michel Gubel ger sin syn på oljemarknaden