

Analys
SEB – Råvarukommentarer, 21 oktober 2013

Rekommendationer
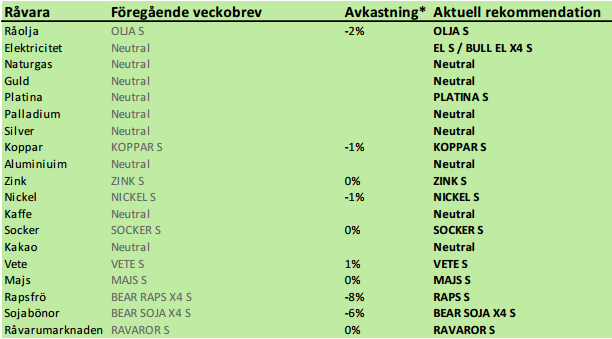 *) Avkastningen anges för 1:1 certifikaten där både BULL och 1:1 certifikat är angivna.
Inledning
Vi rekommenderar köp av el igen. Elpriset har rekylerat 2% sedan förra veckan. Samtidigt har priset på kol stigit med 5% och priset på utsläppsrätter med 11%. Samtidigt som elmarknaden fått en hälsosam rekyl på vinsthemtagningar, har priset fallit, samtidigt som produktionskostnaden stigit. Det är ett perfekt läge för att gå in och köpa certifikat på igen. EL S eller BULL EL X4 S om man vill ta mer risk.
Guld höll sig över det tekniska stödet och steg med 3% i veckan som gick. Till stor del beror detta på att dollarn försvagades mot andra valutor. Det sägs att ”when life gives you lemons, make lemonade”. Guldmarknaden åsatte åtminstone en liten sannolikhet för default av USA, men när det inte blev av, vändes blickarna mot ännu mer QE3-lemonad, om man får säga så. Därav uppgången. PGM-metallerna platina och palladium hade en ännu starkare vecka med uppgångar på 4 – 5%. Det extra stödet kom från statistik som visade ökad bilförsäljning i Europa. Detta fick även blypriset att stiga med 5%. Zinkprisets uppgång på 2% kan också ha påverkats positivt av bilförsäljningsstatistiken. På basis av detta går vi över till en försiktig kortsiktig köprekommendation av PLATINA S, men behåller ”neutral” på de andra ädelmetallerna.
Kinesisk statistik kom i fredags. BNP för det tredje kvartalet hamnade på +7.8% i tillväxt, vilket var helt enligt förväntningarna, men högre än tidigare under året. Industriproduktionen i september ökade med 10.2% och detaljhandelsförsäljningen med 13.3%. Kina står för en betydande del av råvaruefterfrågan i världen. Att tillväxten nu tycks ha tagit fart även i Kina, är mycket positivt för råvarumarknaden.
Råolja – Brent
Oljepriset backade med 1% i veckan som gick, men det ser inte ut som en trendvändning nedåt, utan som en rekyl innan ett nytt test uppåt.
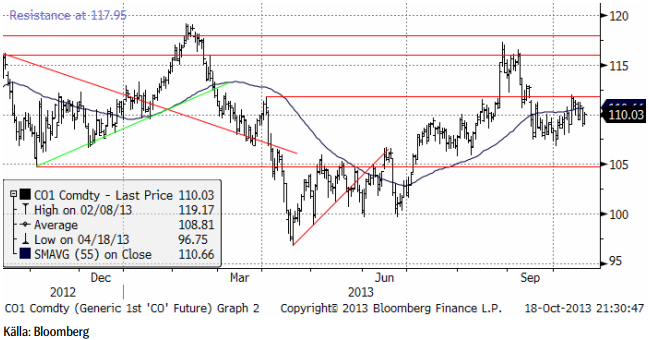
På grund av den attraktiva rabatten på terminer i oljemarknaden och för att vi inte ser någon omedelbar risk för väsentligt lägre pris på olja rekommenderar vi innehav i OLJA S.
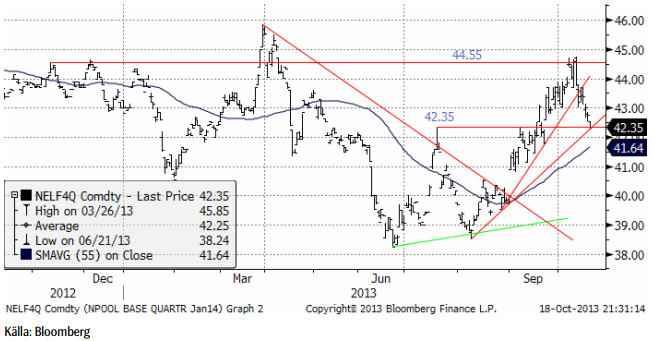
Elektricitet
Första kvartalet 2014:s terminskontrakt som sedan det inte klarade av att gå över motståndet vid 44.55 euro för drygt en vecka sedan befunnit sig i rekyl, stängde i fredags på stödet vid 42.35 euro per MWh. Veckans nedgång blev 2%. Förra veckan rekommenderade vi neutral position i väntan på att rekylen skulle bli färdig och erbjuda ett nytt köptillfälle. Vi anser att vi är där nu och rekommenderar köp av EL S eller BULL EL X4 S för den som vill ta mer risk och få större utväxling om priset stiger. Samtidigt som priset på el har backat, har nämligen priset på kol stigit med 5% och priset på utsläppsrätter stigit med 11%. Det gör att gapet mellan priset på el och kostnaden för att producera elen, återigen blivit attraktivt för att vara köpt el.
Nedan ser vi prisdiagrammet för det första kvartalet 2014:s kontrakt.
Nedan ser vi priset på energikol, den närmaste månadens leveranstermin. Priset har stigit till den högsta nivån sedan i maj.
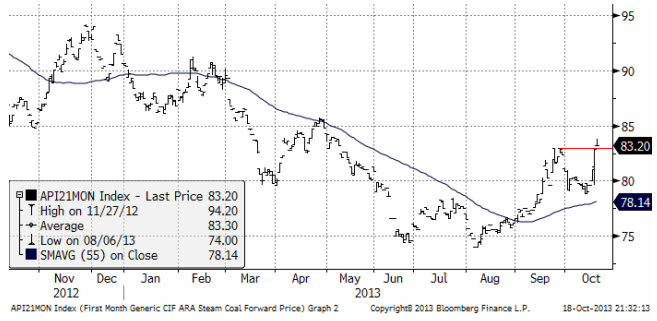
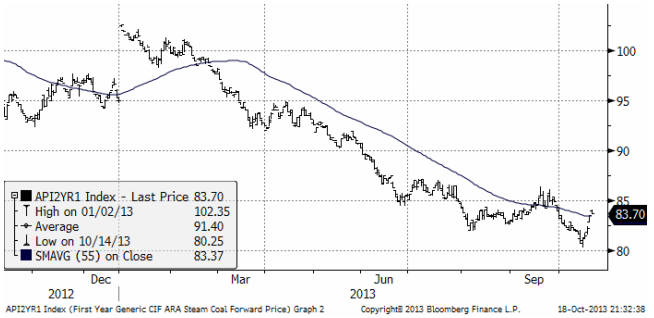
Även årskontraktet på kol har stigit från 80 dollar till 83.70, som vi ser i diagrammet nedan.
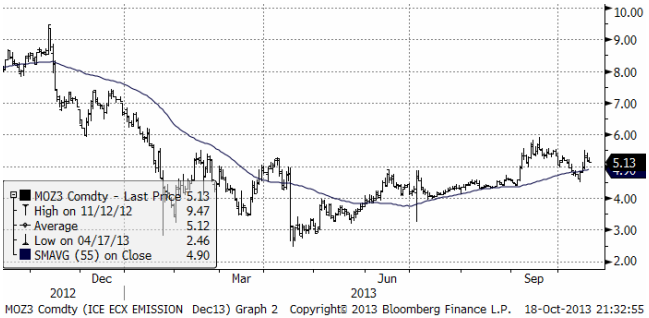
Priset på utsläppsrätter har stigit och sedan rekylerat i vad som ser ut som en flagga. Om det är en flagga, säger den tekniska analysen att prisobjektivet hamnar vid 6 euro per ton.
Vi rekommenderar alltså köp av EL S eller BULL EL X4 S.
Naturgas
Naturgaspriset gick inte igenom 4 dollar och föll därefter. Vi ser dock att det glidande medelvärdet, som mäter trenden, har vänt uppåt och är stigande. Då och då ser man rekyler där det glidande medelvärdet även fungerar som stöd. Det skulle kunna bli så den här gången, vilket i så fall indikerar att priset kan komma att stiga i veckan som kommer.
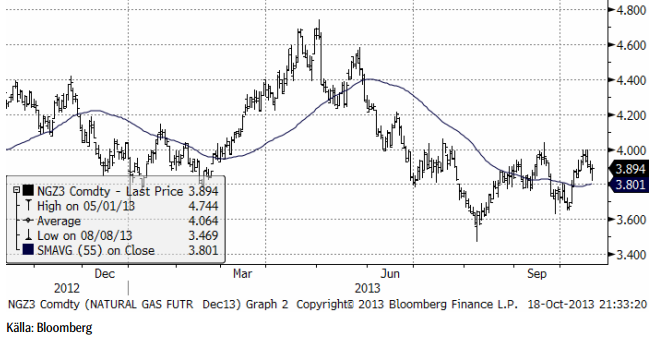
Vi har neutral rekommendation.
Guld & Silver
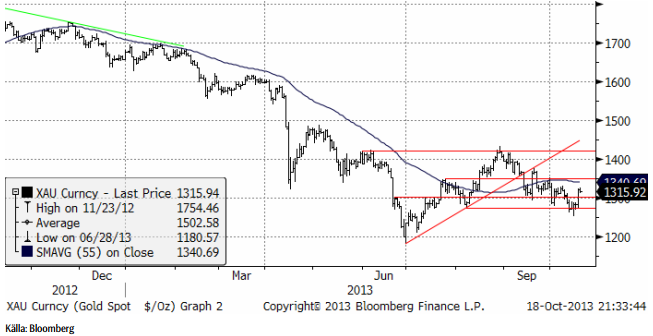
Guldpriset (i dollar) steg när dollarn föll efter uppgörelsen i Washington om en höjning av skuldtaket.
Stora investmentbanker som Credit Suisse och Goldmans Sachs har säljrekommendation på guld. Chefen för råvaruanalysen på Goldman Sachs har kallat guld för en ”slam dunk” bear-kandidat för år 2014. I en studie gjord av Bloomberg i fredags, väntar sig de 10 mest träffsäkra analytikerna på de stora bankerna och analyshusen i världen att guldpriset kommer att falla under vart och ett av de kommande fyra åren.
Om man ska drista sig till analysera analytikerna, kan man se att Goldman Sachs har en tendens att extrapolera trender. När oljepriset år 2008 var på väg uppåt sade de t ex att priset skulle nå över 200 dollar per fat. Samma sak innan guldpriset vände ner.
När det gäller guld är analytiker av två slag – sådana som i grunden inte ser någon praktisk anledning att investera i guld på den ena sidan. ”Guld ger ingen avkastning” är ett vanligt argument från dem. Den andra sidans analytiker tillhör den grupp männskor som pekar på att guldpriset speglar en sorts försäkringspremie mot framförallt statlig förstörelse av pengars värde genom konkurs eller inflation och har uppfattningen om att detta kommer att bli värre. Det är sällan personer i grund och botten ändrar uppfattning om guldets föredömen som placering. Den sida som haft mest rätt den senaste tiden är den första halvan av analytikerkåren, men om priserna går upp bli blir det istället den andra halvan. Det är därför inte förvånande att de som haft mest rätt den senaste tiden, enligt Bloombergs survey, också har en negativ inställning till framtiden.
I veckan som gick sköts en amerikansk default på statsskulden upp och ersattes av en fortsättning av QE3 (expansion av penningmängden).
Samtidigt har faktiskt det låga priset fått effekt på produktionen. Barrick Gold Corp, världen största producent meddelade att de ska stänga eller minska produktionen i 12 guldgruvor, från Peru till Papua New Guinea.
Det har varit en trend hos guldbolagen sedan år 2000 att inte prissäkra produktionen, så som andra gruvbolag gör. Aktiemarknaden har uppmuntrat detta. Gruvbolagen har sammantaget köpt upp till 400 ton (årlig global gruvproduktion ca 2500 ton) i terminer för att avskaffa hedgarna under hela 00-talet. Gruvbolagen har alltså själva stått för en betydande ”efterfrågan” på guld. Med det mycket mer negativa sentiment kring guldpriset som råder nu, är det troligt att gruvbolagen kommer att börja prissäkra igen. Detta leder till ett stigande ”utbud” från gruvbolagen. I år väntas hedgingvolymen uppgå till blygsamma 20 ton, men kan redan nästa år ha ökat till 35 ton, enligt Barclays.
Just nu går aktiemarknaden starkt och i valet mellan guld och aktier, tycker antagligen nästan alla att guld drar det kortaste strået. All efterfrågan på guld är dock inte investeringar, utan i grund och botten efterfrågan på smycken. Den efterfrågan har minskat i takt med att priset stigit de senaste tio åren, utom i Kina och andra tillväxtländer. Framförallt kan den kinesiska efterfrågan på smycken ta fart om priset sjunker. Detta kan fungera som ett fundamentalt stöd på nedsidan i priset. En starkare tillväxt kan också leda till högre efterfrågan.
Tekniskt ser vi att priset i dollar fann stöd på 1270-nivån.
Nedan ser vi kursdiagrammet för silver i dollar per troy ounce. Det ser ut som om 20 dollar ska testas igen.
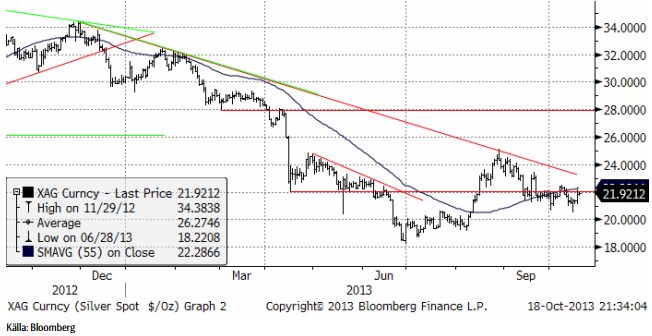
Vi fortsätter att vara neutrala guld och silver och skulle inte vilja köpa någon av dem idag.
Platina & Palladium
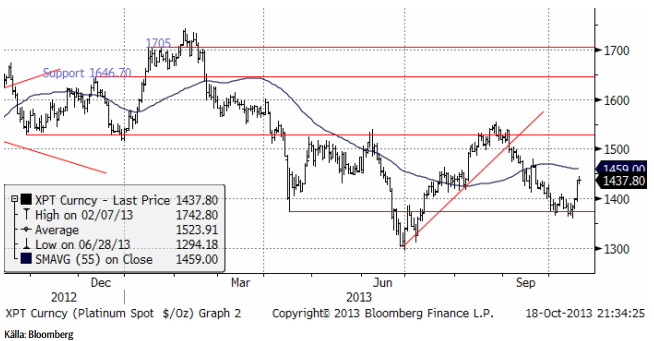
Platinapriset följde guld och silver, men fick extra skjuts av statistik som visar på högre bilförsäljning i Europa. Platina används för avgasrening i dieseldrivna bilar, och den kategorin har enligt statistiken utvecklats extra starkt.
Nedan ser vi frontmånadskontraketet på palladium. Palladium ligger fortfarande i en slags sidledes rörelse, utan trend.
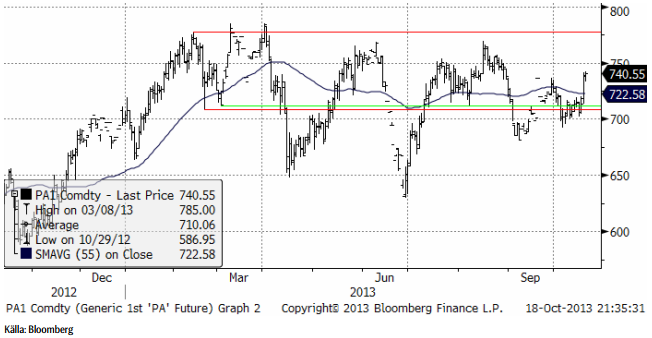
Vi fortsätter att vara neutrala palladium, men går kortsiktigt över till köp på plantina; PLATINA S.
Koppar
Statistik från Kina visade att importen av koppar steg med 16% i september (jämfört med förra året), till 458 kt. Vi anser att detta är återspeglar en fortsatt stark utveckling och återhämtning i Kinas ekonomi. I veckan publicerades BNP-tillväxten i Kina under det tredje kvartalet, som låg på 7.8%.
Tekniskt har vi ett mycket intressant läge. Det har bildats en så kallad triangelformation, med lägre toppar och högre bottnar, sedan augusti-september. Vi tror att ett utbrott uppåt eller nedåt kommer inom ett par veckor – troligtvis upåt. Man ser ofta den här sortens formationer ”halvvägs” på en rörelse uppåt eller nedåt. Prisobjektivet skulle i så fall, om den har inträffat halvvägs från botten, vara ca 8000 dollar per ton.
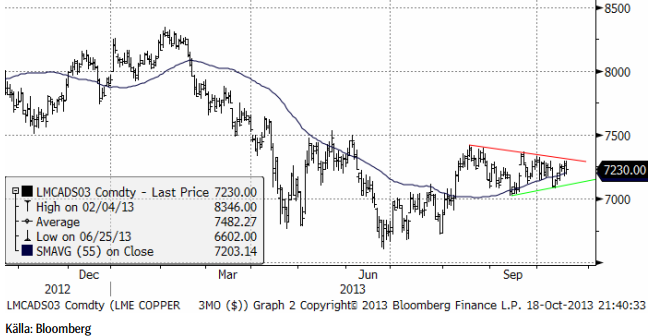
Vi rekommenderar köp av KOPPAR S.
Aluminium
Aluminiummarknaden rör sig just nu inte som de andra metallerna. Förrförra veckan steg priset på aluminium, medan de andra metallerna höll sig rätt platta. Förra veckan föll aluminiumpriset samtidigt som de andra steg. Mäklarfirman RJ O’Brien har sammanställt analytikerestimat för aluminium under LME:veckan. Det är den vecka på året då alla publicerar analyser och det är möjligt att analysera analytikerna samtidigt. För 2013 tror mediananalytikern på ett produktionsöverskott på 475 kt, faktiskt mycket mindre än vad man skulle kunna tro. Spännvidden är stor, från ett underskott på 1.2 mt till ett överskott på 1.1 mt. Undersökningen visar också en klar förbättring jämfört med LME-veckan 2012.
Fundamentalt har inget hänt i veckan som gick. Vi tror att marknaden kommer att fortsätta handla inom intervallet 1800 – 1900 dollar.
Den allmänna bilden ser dock ut som en botten som närmar sig sitt slut. Vi ser att 55-dagars glidande medelvärde börjar peka uppåt, dvs åtminstone den trendindikatorn har vänt uppåt.
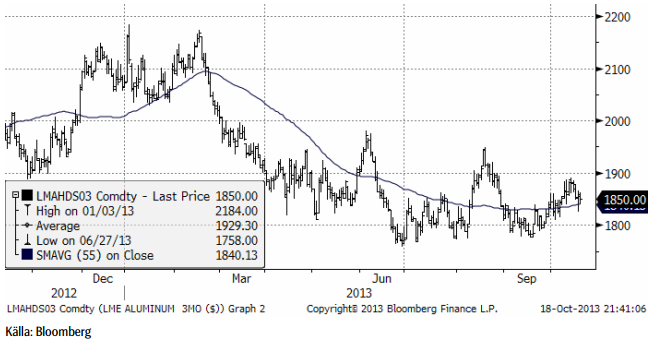
Vi har neutral rekommendation, men lutar mot en köprekommendation.
Zink
Zink fortsatte att röra sig svagt uppåt inom den bottenformation som etablerats sedan mars månad. Styrkan i den kinesiska ekonomin ger stöd för marknaden. Ett brott av 1,950 dollar skulle signalera att marknaden vill testa även 2000 dollar. Det tekniska motståndet på 1930 – 1935 dollar har emellertid inte brutits än och det är möjligt att köpare vill avvakta ännu en rekyl nedåt, mot 1900 dollar.
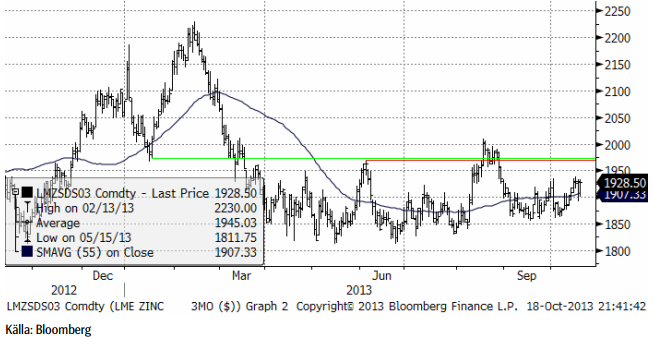
Vi fortsätter med en köprekommendation av ZINK S.
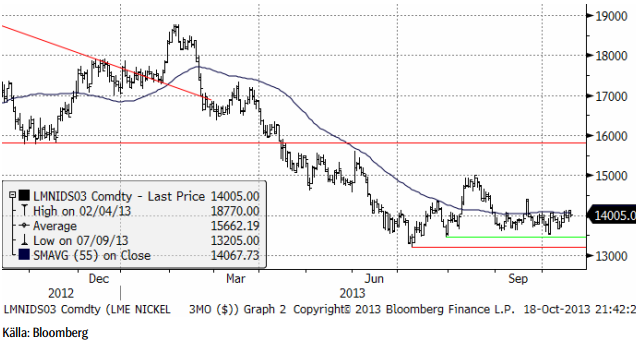
Nickel
Handeln var svag hela veckan, men bland basmetallerna stack nickel ut i fredags. Efter en paus, tog sig priset upp genom det tekniska motståndet vid 14,100. Tekniskt finns utrymme upp till septembers högsta notering på 14,400 dollar, där vi tror att säljare fortfarande väntar.
Marknaden diskuterar fortfarande sannolikheten för det eventuella kommande indonesiska exportförbudet. Vi tror att sannolikheten är lägre än andra marknadsbedömare. Om vi får rätt skjuter det upp minskningen i den kinesiska produktionen av nickeljärn till nästa år. Om det blir ett exportförbud får det sannolikt priserna att gå upp temporärt. Men vi ser också att kinesiska bolag importerar så mycket de kan nu. Enligt CRU är Kinas import av nickelmalm upp 8.9% under de åtta första månaderna i år, jämfört med 2012. En del av den ökningen är säkert en lageruppbyggnad. Mot slutet av året tror vi att priset på nickel kommer att stiga till 14,000 – 14,500 dollar per ton, dels på grund av säsongsmässigt högre efterfrågan och på grund av att tiden för ett eventuellt exportförbud rycker allt närmare.
Kaffe
Kaffepriset fortsatte ner med 2% i veckan som gick. Nyhetsflödet har talat om rekordhöga lager det kommande året, när produktionen i länder som drabbats av bladmöglet roya återtar något av sin produktionskapacitet med resistenta sorter. Brasilien väntas bärga en rekordskörd, eftersom den kommande skörden är den högre i 2-års-cykeln av höga och låga skördar. Med det sagt, är priset verkligen lågt och vändningen uppåt i sockermarknaden gör att sockerrör, som konkurrerar om areal med kaffe, kan fortsätta att vinna mark, framförallt i Brasilien.
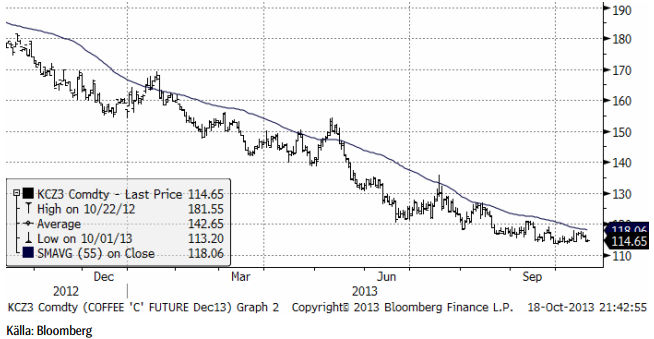
Vi behåller tills vidare neutral rekommendation, tills vi ser tecken på ett trendbrott.
För fler jordbruksråvaror se SEBs analysbrev från tidigare idag.
[box]SEB Veckobrev Veckans råvarukommentar är producerat av SEB Merchant Banking och publiceras i samarbete och med tillstånd på Råvarumarknaden.se[/box]
Disclaimer
The information in this document has been compiled by SEB Merchant Banking, a division within Skandinaviska Enskilda Banken AB (publ) (“SEB”).
Opinions contained in this report represent the bank’s present opinion only and are subject to change without notice. All information contained in this report has been compiled in good faith from sources believed to be reliable. However, no representation or warranty, expressed or implied, is made with respect to the completeness or accuracy of its contents and the information is not to be relied upon as authoritative. Anyone considering taking actions based upon the content of this document is urged to base his or her investment decisions upon such investigations as he or she deems necessary. This document is being provided as information only, and no specific actions are being solicited as a result of it; to the extent permitted by law, no liability whatsoever is accepted for any direct or consequential loss arising from use of this document or its contents.
About SEB
SEB is a public company incorporated in Stockholm, Sweden, with limited liability. It is a participant at major Nordic and other European Regulated Markets and Multilateral Trading Facilities (as well as some non-European equivalent markets) for trading in financial instruments, such as markets operated by NASDAQ OMX, NYSE Euronext, London Stock Exchange, Deutsche Börse, Swiss Exchanges, Turquoise and Chi-X. SEB is authorized and regulated by Finansinspektionen in Sweden; it is authorized and subject to limited regulation by the Financial Services Authority for the conduct of designated investment business in the UK, and is subject to the provisions of relevant regulators in all other jurisdictions where SEB conducts operations. SEB Merchant Banking. All rights reserved.

Selling down on a ”deal”. Brent crude fell 6.2% last week with accelerated weakness towards the end of the week. Close of the week at $87.33/b and low of the week (and on Friday) of $85.8/b. Brent is falling another 4% this morning to $83.7/b on confirmation by Iran that a MoU text has been reached and that it will be signed on Friday this week.

So what is this ”deal” worth? Talk on the desk here this morning is that it is much like ”putting lipstick on a pig” where Trump has to sell this at home as a victory where ”the SoH has reopened”, the nuclear issue will be ironed out over the coming 60 days (or maybe 600 days?) and US consumers are getting a lower gasoline price and maybe US republicans survives the midterm elections.
The importance for Iran is that it emerges as the defacto winner of this war in the eyes of the non-US public world. That Iran now onwards is the ”ruler of the SoH” (combo of geography and new weapons systems like drones) or more softer: ”the guarantor of safe passage through the SoH”.
Iran doesn’t need nuclear weapons any more. Nuclear deterrence doesn’t work any more. Ukraine has made many attacks deep into Russia without being nuked in return. Plenty of Iranian ballistic rockets blasts over Israel but Iran wasn’t nuked in return.
There is no trust between the US and Iran. We don’t know all the details yet of the MoU. But what we do know is that there is no trust between the US and Iran what so ever. This is probably more like a descriptive text on how they can cooperate in a way where both sides keeps tactical leverage. Neither side makes irreversible concessions. Violations can be punished quickly. Cooperation produces immediate benefits.
This is a fragile structure. It can easily break down. There may be details which cannot be overcome. To be seen on Friday. The US has to show that it is willing put enough force behind managing and restraining Israel versus Hezbollah in Lebanon. We have seen that Netanyahu hasn’t listened all that much to Trump’s directives and wishes. This could be a major obstacle.
A gradual reopening is tactically preferable for Iran. A tactical leverage for Iran right now is that global oil stocks have been drawn down towards painful and increasingly dangerous levels with increasing risks for oil price spikes in mid-July to August. This together with US midterm elections on 3 November gives tactical leverage to Iran. Iran probably doesn’t want to fully give up on that leverage. A rapid, full reopening where global stocks are able to refill over the coming 60 days will significantly erode that leverage. If Iran reinstates a closure of the SoH after 60 days (if talks break down again), then the effect won’t be that impactful in terms of prices and the US midterm elections.
So a gradual and partial reopening where global markets gets the oil they need while they are unable to rebuild stocks could be a practical middle way for both parties. Trump can sell it as ”the SoH has reopened” and get affordable gasoline for US consumers. Iran can sell it as ”the SoH has fully reopened, but there is some friction” so flow is only 60-80% of normal.
Not much real demand destruction below $100/b. What we do know is that there is not much real price pain demand destruction for oil globally at an oil price below $100/b. A lot of demand-shock destruction. Fear. But demand should now come roaring back towards normal with fear for exceptionally high prices now is rapidly receding.
Sudden China demand destruction due to EVs? Bullocks. EV share of total Chinese carpool now around 13%. Share of new sales of EVs has reached 50%. This is a very gradual process. It doesn’t make oil demand fall like a rock over night. When EV new sales share reaches 100%, then the gasoline car pool will contract by some 5-10% per year. But that is only gasoline. Sudden reduction in Chinese oil demand is more about shock and risk.
Chinese crude oil imports will come roaring back. At what price? Today’s ”neutral” oil price is $70/b. That is the five year price which has steadily traded around the $70/b mark over the past 3-4 years. With still a risky picture one would think that China and the rest of the world will be big buyers of oil in the range of $70-85/b.
Global demand will likely snap back towards normal, forecasted demand and growth at such prices.
Physical reopening is a gradual process. The physical and practical reopening of the SoH will likely be gradual rather than sudden. And that probably suites Iran tactically as well.
Brent M1 price versus the Brent 5-yr (today’s ”normal” price)

Market is starting to take US/Iran headlines with a pinch of salt. Brent crude rose $2.8/b yesterday to an official close of $112.1/b. But after that it traded as low as $108.05/b before ending late night at around $109.7/b. Through the day it traded in a range of $106.87 – 112.72/b amid a flurry of news or rumors from Iran and the US. ”US temporary sanctions during negotiations” (falls alarm). ”We will bomb Iran” (not anyhow),… etc. While the market is still fluctuating to this kind of news flow, it is starting to take such headlines with a pinch of salt.
We’ll see. Maybe, maybe not. The Brent M1 contract is trading at $110.2/b this morning which very close to the average ticks through yesterday of $110.4/b.
Trump with bearish, verbal intervention whenever Brent trades above $110/b it seems. What seems to be a pattern is that Trump states something like ”very good negotiations going on with Iran”, ”New leaders in Iran are great,..”, ”Great progress in negotiations,…”, ”Deal in sight,..” etc whenever the Brent M1 contract trades above $110/b. An effort to cool the market. These hot air verbal interventions from Trump used to have a heavy bearish impact on prices, but they now seems to have less and less effect unless they are backed by reality.
As far as we can see there has been no real progress in the negotiations between the US and Iran with both sides still standing by their previous demands.
Iran is getting stronger while the cease fire lasts making a return to war for Trump yet harder. Iran is naturally in constant preparation for a return to war given Trump’s steady threats of bombing Iran again. Iran is naturally doing what ever is possible to prepare for a return to war. And every day the cease fire lasts it is better prepared. This naturally makes it more and more difficult and dangerous for the US to return to warring activity versus Iran as the consequences for energy infrastructure in the Persian Gulf will be more and more severe the longer the cease fire lasts. Israel seems to see it this way as well. That the war is not won and that current frozen state of a cease fire gives Iran opportunity to rebuild military and politically.
Global inventories are drawing down day by day. How much? In the meantime the Strait of Hormuz stays closed. There is varying measures and estimates of how much global inventories are drawing down. Our rough estimate, back of the envelope, is that global inventories are drawing down by at least some 10 mb/d or about 300 mb/d in a balance between loss of supply versus demand destruction. Other estimates we see are a monthly draw of 250-270 mb/d. The IEA only ’measured’ a draw in global observable stocks of 117 mb in April with oil on water rising 53 mb while on shore stocks fell 170 mb. But global stocks are hard to measure with large invisible, unmeasured stocks. As such a back of the envelope approach may be better.
Oil products is what the world is consuming. Oil product prices likely to rise while product stocks fall. Strategic Petroleum Reserves (SPR) are predominantly crude oil. Discharging oil from OECD SPR stocks, a sharp reduction in Chinese crude imports and a reduction in global refinery throughput of 6-7 mb/d has helped to keep crude oil markets satisfactorily supplied. But global inventories are drawing down none the less. And oil products is really what the world is consuming. So if global refinery throughput stays subdued, then demand will eventually have to match the supply of oil products. The likely path forward this summer is a steady draw down in jet fuel, diesel and gasoline. Higher prices for these. Then, if possible, higher refinery throughput and higher usage of crude in response to very profitable refinery margins. And lastly sharper draw in crude stocks and higher prices for these. But some 6 mb/d of oil products used to be exported through the Strait of Hormuz. And it may not be so easy to ramp up refinery activity across the world to compensate. Especially as Ukraine continues to damage Russian refineries as well as Russian crude production and export facilities.
Watch oil product stocks and prices as well as Brent calendar 2027. What to watch for this summer is thus oil product inventories falling and oil product premiums to crude rising. Another measure to watch is the Brent crude 2027 contract as it rises steadily day by day as the Strait of Hormuz stays closed and global oil inventories decline. The latter is close to the highest level since the start of the war and keeps rising.
The Brent M1 contract and the Brent 2027 prices and current price of jet fuel in Europe (ARA). All in USD/b

Our back of the envelope calculation of the global shortage created by the closure of the Strait of Hormuz. Note that 3.5 mb/d of discharge from SPR is also a draw. Note also that ’Forced demand loss’ of 2.5 mb/d is probably temporary and will fall back towards zero as logistics are sorted out leaving ’Price demand loss’ to do the job of balancing the market. Thus a shortfall of at least 9 mb/d created by the closure. More if SPR discharge is included and more if Forced demand loss recedes.

Brent is climbing higher. Front-month is at USD 106.3/bl this morning, close to a weekly high and a USD 9/bl jump from Mondays open. This is the move we flagged as a risk earlier in the week: the market shifting from ”a deal is around the corner” to ”this is going to take longer than we thought”.

Analyst Commodities, SEB
During April, rest-of-year Brent remained remarkably stable around USD 90/bl. A stability which rested on one single assumption: the SoH reopens around 1 May. That assumption is now slowly falling apart.
As we highlighted yesterday: every week of delay beyond 1 May adds (theoretically) ish USD 5/bl to the rest-of-year average, as global inventories draw 100 million barrels per week. i.e., a mid-May reopening implies rest-of-year Brent closer to USD 100/bl, and anything pushing into June or July takes us meaningfully higher.
What’s changed in the last 48 hours:
#1: The US military has formally warned that clearing suspected sea mines from SoH could take up to six months. That is a completely different timescale from what the financial market is pricing. Even a political deal tomorrow does not immediately reopen the strait.
#2: Trump has shifted his tone from urgency to ”strategic patience”. In yesterday’s press conference: ”Don’t rush me… I want a great deal.” The market is reading this as a president no longer feeling pressured by timelines, with the naval blockade running in the background.
#3: So far, the military activity is escalating, not de-escalating. Axios reports Iran is laying more mines in SoH. The US 3rd carrier strike group (USS George H.W. Bush) is arriving with two countermine vessels. Trump yesterday ordered the US Navy to destroy any Iranian boats caught laying mines. While CNN reports that the Pentagon is actively drawing up plans to strike Iranian SoH capabilities and individual Iranian military leaders if the ceasefire collapses. i.e., NOT a attitude consistent with an imminent deal!
Spot crude and product prices eased off the early-April highs on a combination of system rerouting and deal optimism. Both now weakening. Goldman estimates April Gulf output is reduced by 14.5 mbl/d, or 57% of pre-war supply, a number that keeps getting worse the longer this drags on.
Demand-side adaptation is ongoing: S. Korea has cut its Middle East crude dependence from 69% to 56% by pulling more from the Americas and Africa, and Japan is kicking off a second round of SPR releases from 1 May. But SPRs are finite.
Ref. to the negotiations, we should not bet on speed. The current Iranian leadership is dominated by genuine hardliners willing to absorb economic pain and run the clock to extract concessions. That is not a setup for a rapid resolution. US/Israeli media briefings keep framing the delay as ”internal Iranian divisions”, the reality is more complicated and points toward weeks and months, not days.
Our point is that the complexity is large, and higher prices have only just started (given a scenario where the negotiations drag out in time). The market spent April leaning on the USD 90/bl rest-of-year assumption; that case is diminishing by the hour. If ”early May reopening” is replaced by ”June, July or later” over the next week or two, both crude and products have meaningful room to reprice higher from here. There is a high risk being short energy and betting on any immediate political resolution(!).


Vattenfalls och Industrikrafts kärnkraftsbolag Videberg Kraft har valt Rolls-Royce SMR
Selling down on a ”deal”

Sommarväder skapar prisrally på elbörsen
Oil product price pain is set to rise as the Strait of Hormuz stays closed into summer

Solkraften pressar elpriserna dagtid
Oil product price pain is set to rise as the Strait of Hormuz stays closed into summer
Sommarväder skapar prisrally på elbörsen
Vattenfalls och Industrikrafts kärnkraftsbolag Videberg Kraft har valt Rolls-Royce SMR
Selling down on a ”deal”
-
Analys4 veckor sedan
Oil product price pain is set to rise as the Strait of Hormuz stays closed into summer
-
Nyheter2 veckor sedan
Sommarväder skapar prisrally på elbörsen
-
 Nyheter2 dagar sedan
Vattenfalls och Industrikrafts kärnkraftsbolag Videberg Kraft har valt Rolls-Royce SMR
-
Analys2 dagar sedan
Selling down on a ”deal”