Analys
SEB – Jordbruksprodukter, vecka 4
 Den senaste veckan har priserna på jordbruksprodukter stigit kraftigt, med Chicagovete i täten på +8%. Marknaden har haft lätt att trycka på köpknappen och tagit fasta på rykten om förestående exportstopp från Ryssland och från Argentina. Trots blixtsnabb officiell dementi från Argentinas jordbruksdepartement, vände inte marknaden ner. Det förefaller som om det är sentimentet som styr, snarare än fundamenta och då kan det också ganska snabbt vända ner igen.
Osäkerheten om torkan i Argentina och dess effekt på skörden är fortfarande ett orosmoment, liksom hur länge La Niña-förhållandena kommer att hålla i sig. Det finns också viss väderbaserad oro i botten för ryktet att Ryssland skulle ställa in exporten.
Positiva nyheter, främst att det regnat i början av veckan över hela norra Argentina har marknaden tagit ganska lätt på. El Rural skriver att det är för sent att så majs, men att bönder sår sen soja i den fuktiga marken.
Börsen ICE Futures Canada, den Winnipeg-baserade jordbruksbörsen som ägs av Intercontinental Exchange, lanserade i måndags futureskontrakt och optioner på kvarnvete, durumvete och korn med leveranspunkter i Kanada. Merparten av vete och korn produceras i Kanadas västra provinser, såsom Manitoba, Saskatchewan, Alberta och British Columbia och sedan 1943 har the Canadian Wheat Board (CWB) haft ett legalt monopol på all köp och försäljning av dessa jordbruksprodukter.
Bill C-18, som infördes av den konservativ/liberala regeringen i Kanada i slutet av oktober förra året kommer att avsluta CWB:s monopolställning och tillåta vete, durumvete och korn från västra Kanada att handlas fritt för första gången på nästan 70 år. Den nya lagen kommer inte att avskaffa CWB, men den kommer att fråntas sin position som den enda köparen av vete från kanadensiska lantbrukare.
Slutligen, värt att tänka på är IMF:s prognos för råvarumarknadens utveckling under 2012 som släpptes i tisdags. Man förutspår att råvarupriserna (utom olja) kommer att falla med i genomsnitt 14%, med de största prisfallen på jordbruksprodukter.
La Niña
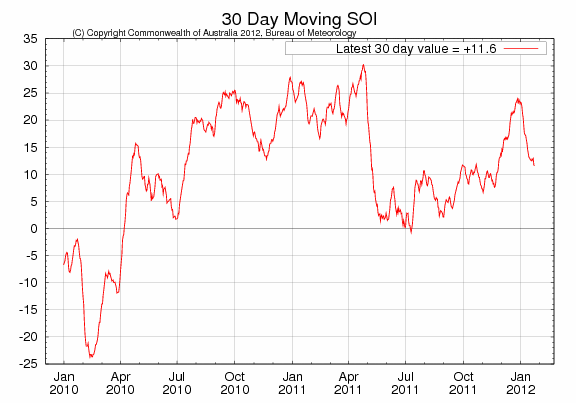
Det råder väl inget tvivel om att det är La Niña-fenomenet som står i centrum för skörden i Argentina och södra Brasilien. Fenomenet påverkar också vädret i Nordamerika. Det är därför det är extra torrt där också. Som vi har berättat tidigare har fenomenet nått sin kritiska nivå vid årsskiftet och har fortsatt att försvagas de senaste två veckorna. I diagrammet nedan ser vi utvecklingen av Southern Oscillation Index (”SOI”) på daglig basis. Ett värde >8 innebär att det råder La Niña.
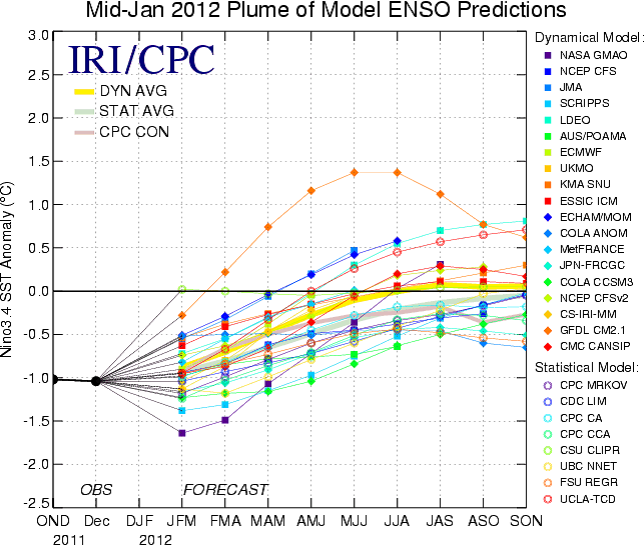
Det finns en rad modeller för att göra prognoser på framtida ENSO-förhållanden. Nedan ser vi en ”plym” av sådana prognoser framåt i tiden. Vi ser att La Niña väntas hålla i sig fram till hösten. Då ska vi kanske också notera att tillförlitligheten på ENSO-prognoser sträcker sig ungefär 6 månader framåt i tiden. Det finns alltså risker för La Niña-orsakad torka under sommaren.
Hur påverkar ett övergående La Niña vetepriset?
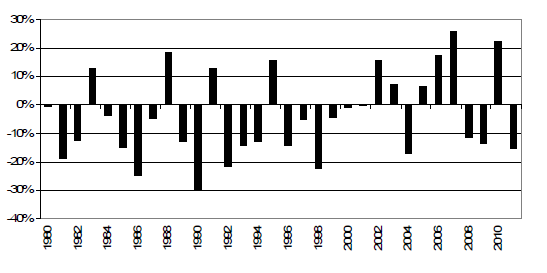
Vi har gjort en studie av hur vetepriset (Chicago) förändras mellan den sista december och den sista juli varje år. Vi ser en bild på dessa prisförändringar i procent nedan.
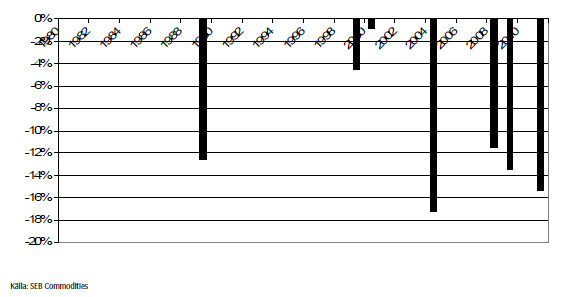
Genomsnittet är en prisnedgång på 4% (en mycket stor anledning att sälja terminer på vintern, för övrigt). Om vi sedan väljer ut de ”vårar” när det varit La Niña-förhållanden vid årsskiftet, hur har det gått då? Det visar sig att man då får enbart får fram vårar med prisnedgångar, som vi ser i diagrammet nedan.
Den genomsnittliga prisnedgången på dessa 7 år sedan 1980 till och med 2011 är 11%. Just vid årsskiftet hade vi ett Southern Oscillation Index på nästan 25 och ett värde > 8 indikerar ett aktivt La Niña-fenomen. Vi vet dessutom att detta enligt prognosen kommer att klinga av under våren. Det är med andra ord upplagt för prisfall i vete. Vetepriset står på ungefär samma nivå nu som det gjorde vid årsskiftet. Man kan säkerligen finna motsvarande prognos om prisfall för sojabönor och majs för samma år (i år).
Vete
Chicagovetet har stigit med 8% på en vecka för gammal skörd, men bara 4% för ny skörd. Ny skörd på Matif steg med bara 2%. Chicagovetet är den jordbruksråvara som har stigit mest alla den senaste veckan.
Bakom uppgången låg rykten – dels om att Argentina skulle införa exportstopp på soja och majs, dels på att Ryssland ska införa exportstopp på vete igen per den 1 mars. Argentinas jordbruksdepartement dementerade snabbt, men inget hördes från Ryssland. Nyhetsbyråer rapporterar att Kazakstan är ute och försöker köpa 8 mt till de statliga reservlagren.
Den tidigare uppgiften var att de tänkte köpa 5mt. Misstanken uppstår då att de vet att exporten inte kommer att bli så stor. Mellan september och december exporterades 4.1 mt. Samtidigt kom privata firmors estimat på majsskörden i Argentina, som ligger långt under USDAs estimat från januari-WASDE. Dock finns det mycket vete i världen och mer verkar det som för varje månad som går. En snabb blick i förra veckans rapporter verkar konstatera samma sak.
Enligt IGC (International Grains Council) har uppskattningen av den globala veteproduktionen under 2011 justerats upp med 7 miljoner ton, jämfört med november-rapporten, till rekordhöga 690 miljoner ton. Ökningen avspeglar bättre än förväntade skördar på det södra halvklotet, speciellt i Argentina och Australien, men också betydande ökningar i Kina och Kazakstan. Ungefär hälften av den justeringen beror på ökad användning i foder, då konkurrenskraftiga priser (jämfört med majs) har lett till högre efterfrågan.
Globala utgående lager i slutet av 2011/12 revideras också upp och förväntas nu uppgå till 204 miljoner ton, vilket är strax under rekordet på 206 miljoner ton 1999/00. Lagren förväntas öka kraftigt i de stora exportländerna Kazakstan och Ukraina, medan de i EU och USA förväntas vara oförändrade. En stor del av ökningen tillskrivs också Kina och blir därför i stort sett oåtkomliga för den globala marknaden.
Den globala arealen för veteproduktion 2012 förväntas öka 1.7% till 225 miljoner hektar, den största sedan 1998. Huvuddelen av denna ökning förväntas bli i USA och OSS, till följd av attraktiva inhemska och internationella priser, där prognosen baseras på normala väderförhållanden. Bortsett från torka i delar av USA och Ukraina rapporteras det om att utsikterna för höstvetet på norra halvklotet anses vara god.
Den franska analysfirman Strategie Grains uppskattar globala utgående lager till rekordhöga 211 miljoner i slutet av 2012/13, samma siffra som Ag Canada har i sin rapport. Enligt USDA är rekordsiffran för globala utgående lager 210.7 miljoner ton och sattes 1999/00 medan IGC har en något lägre uppskattning av den siffran med 206 miljoner ton. Strategie grains prognos baseras på ökade skördar i Kina, Ryssland, USA och Europa.
Veteskörden i Europa för 2012 förväntas uppgå till 133,3 miljoner ton och även om den har justerats ned med 200 000 ton från förra månadens estimat till följd av minskad sådd i Tyskland, regionens näst största producent efter Frankrike, så är det fortfarande en ökning med 3% jämfört med 2011/12. Räknar man dessutom in durumvetet blir det en förväntad skörd på 142.2 miljoner ton. Ryssland förväntar sig att 2012 års skörd kommer att bli lika bra som förra årets, om inte bättre. För Ukraina ser det sämre ut pga den svåra torkan i höstas som varade i 3 1/2 månad från september till december.
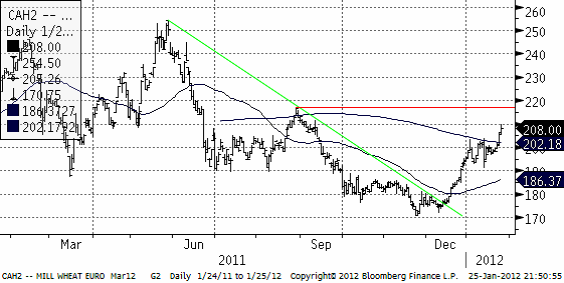
Nedan ser vi kursdiagrammet för marskontraktet på Matif, som verkligen brutit uppåt. Nästa motstånd ligger på 217 euro, men under gårdagen fanns det gott om säljare på 210 euro, som blev toppen på dagens handel.
Det är något märkligt att Matif går ännu mer in i backwardation genom att det är gammal skörd som handlas upp. Det talas om att det kooperativ som köper tillbaka gamla sålda terminer, samtidigt som bönder i Europa fortsätter och kanske i än större utsträckning håller på fysiska lager.
Ur ett teknisk analysperspektiv noterar vi att förra veckans uppgång (över 191.50-motståndet), men under motståndet på 217.50, har skapat förutsättningarna för vad som kallas för en ”bull trap”, där man lockas att köpa, men sedan vänder marknaden tvärt nedåt. Tekniska momentumindikatorer rör sig i motsatt riktning just nu, och det talar för att en vändning nedåt kan komma i priset.
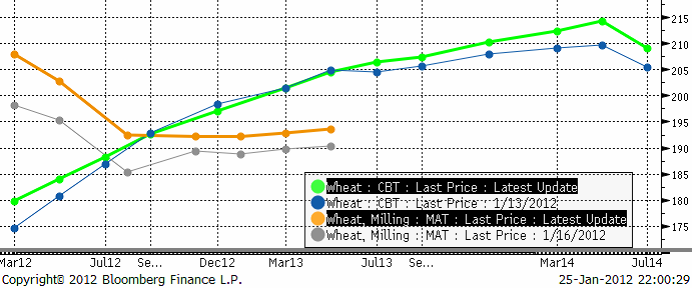
Nedan ser vi terminskurvan för Chicagovete och Matif nu och för en vecka sedan. De ”feta” kurvorna är de aktuella. De ”smala” är förra veckans.
Matif har som vi berört gått ännu mer in i backwardation pga gammal skörd handlats upp.
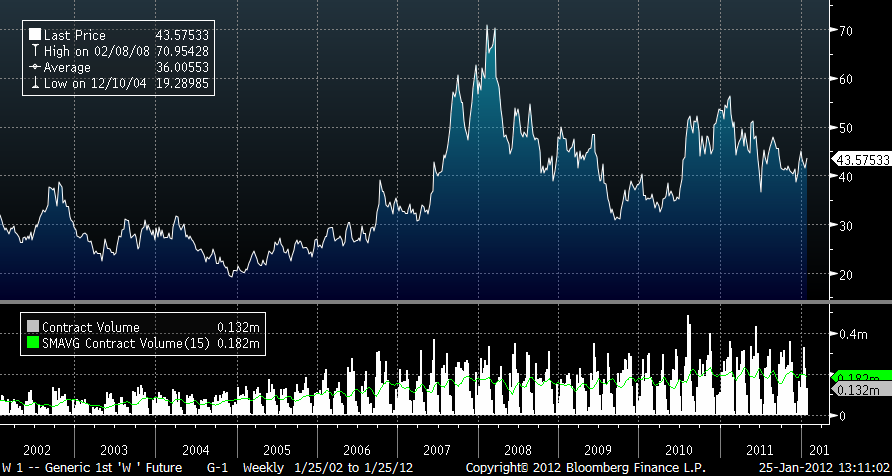
Nedan ser vi vetepriset på CBOT omräknat till svenska kronor per bushel (27 kilo) de senaste tio åren. I den nedre delen ser vi omsättningen i antal kontrakt.
Det ryktades under tisdagen om ryskt exportstopp från 1 mars, vilket skulle kunna ligga bakom prisuppgången på gammal skörd.
I sin WASDE-rapport i januari estimerade USDA rysk veteexport till 19.5 mt för marknadsföringsåret juli 2011 till juni 2012. Det var en liten höjning från decemberprognosen som låg på 19 mt. Det förefaller helt klart att man sålt slut på allt vete i de södra delarna av landet och att man nu kämpar med logistiken för att få ut det som finns längre in i landet. Putin har satt exportgränsen till 25 mt, så än finns en stor marginal till det taket.
Frågan är varför ett exportstopp ändå skulle införas?
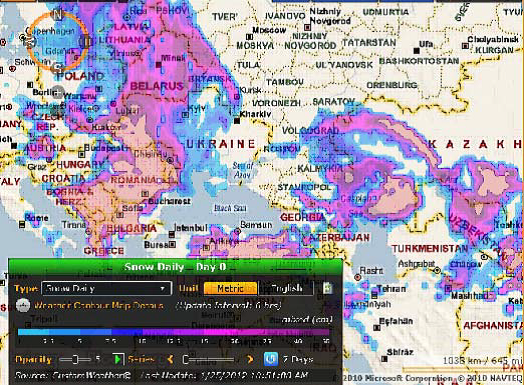
Det har snöat kraftigt i delar av Ryssland, men det finns motstridiga uppgifter om huruvida snön fallit på jordbruksmark eller inte. Det förefaller som om det gjort det, till viss, men ganska liten del. Nedan ser vi en radarbild på snöfall över södra Ryssland och att snön missat viktiga regioner som Voronetz och Tambov.
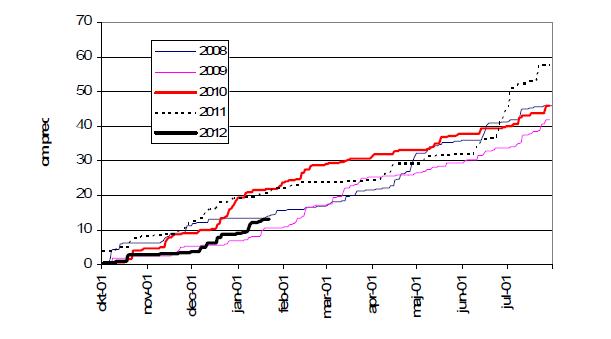
Nedan ser vi ackumulerad nederbörd i staden Kursk, som ligger nära jordbruksområdena. Vi ser att det mycket riktigt varit torrt under hösten och att det kan finnas en viss oro. Den röda grafen var den som ledde fram till torkan och missväxten under sommaren 2010 och det året började med mycket nederbörd, så än går inte att säga hur året kommer att bli.
Samtidigt som det finns oro för Ryssland, ser det mycket positivt ut i Australien. Australian Bureau of Statistics rapporterade igår onsdag att lagren i Australien är de största sedan år 2006. Förra året uppgick lagren (per årsskiftet) till 18.2 mt. I år var lagren 24.6 mt, efter att australiensiska bönder bärgat den andra rekordskörden på raken. Skörden väntas uppgå till 28.3 mt 2011-2012 och slår därmed förra årets rekord på 27.9 mt enligt Australian Bureau of Agricultural and Resource Economics and Sciences. Australien är världens näst största exportland efter USA. Enligt ABARES kan exporten nå 21.6 mt.
En delförklaring till de strora lagren är att carryover per den 30 september var 8.3 mt. I år väntas den bli ännu något större.
Om man nu ska sammanfatta läget, så anser vi att sentimentet just nu helt klart verkar vara ganska ”triggerhappy” på köpknappen. Man tar fasta på rykten. Det verkar finnas en stor oro för vädret, sannolikt med 2007 och 2010 i färskt minne. Samtidigt, eftersom det inte handlar om fakta, kan vändningen bli lika tvär nedåt igen. Den kraftiga backwardation som finns på Matif – som signalerar brist på fysisk vara – samtidigt som det knappast finns en fysisk brist i Europa (extremt få GASCtenders vunna och mycket spannmål kvar hos bönderna), är gammal skörd solklart säljvärd. Tror man på högre priser – köp terminerna med längre löptid billigare i så fall.
Vi fortsätter att tro på en nedgång i vetepriset under året och tycker att man i första hand ska sälja av gammal skörd på den uppgång vi nu sett.
Maltkorn
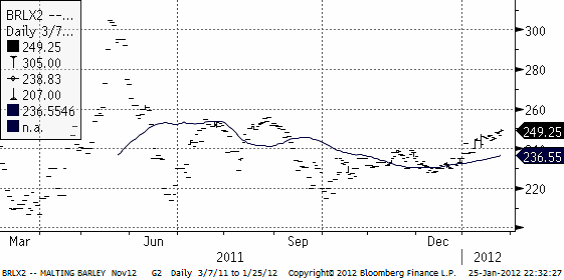
Maltkornet har fortsatt att handlas upp och priset för novemberleverans tangerar nu 250 euro per ton. Motstånd finns strax ovanför, på ca 255 euro.
Argentinska La Nacion rapporterar om landet har fått den högsta maltkornsskörden på 10 år. Skörden uppgår till 3.65 miljoner ton och arealen för maltkornsproduktion har ökat med nästan 50% jämfört med 2010/11. En av de viktigaste orsakerna till denna ökning är att producenterna försöker hitta ett alternativ till vete och en tidig maltkornsskörd ger också möjligheten att så sojabönor efteråt.
Även fast skörden sedan länge är avklarad i Europa verkar det fortfarande råda en viss osäkerhet om tillgången på maltkorn då väderförhållandena under 2011 har lett till betydande kvalitetsproblem.
Den skandinaviska skörden drabbades bl a av höga koncentrationer av fusarium vilket ger kvalitetsstörningar i mältnings- och bryggningsprocessen genom skumbildning, så kallad ”gushing”, och andra länder, t.ex Frankrike, har haft stora problem med proteinhalter. För hög proteinhalt ger grumligt öl.
Potatis
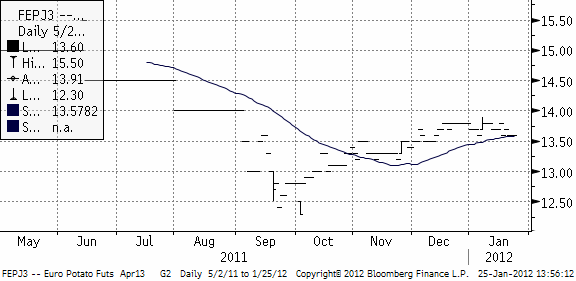
Priset på potatis har fortsatt att försvagas och när nu nära att bryta 55-dagars glidande medelvärde, vilket vore en negativ teknisk signal.
Majs
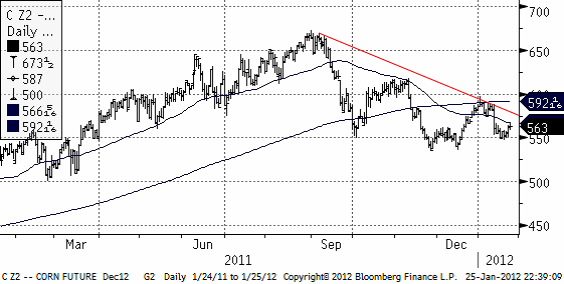
Ur ett teknisk analysperspektiv noterar vi att majspriset är uppe vid 55-dagars glidande medelvärde, som utgör ett slags motstånd (många tittar på just den indikatorn). Nedan ser vi decemberkontraktet på CBOT:
Det gick ett rykte under tisdagen den 24 januari att Argentina skulle införa ett exportstopp på majs, men detta dementerades snabbt av jordbruksministeriet, men prisuppgången stannade ändå kvar. FAO estimerar skörden av majs i Argentina till 21.4 mt, där USDA senast estimerade 26 mt. Privata firmor ligger ännu lägre, på 17-18 mt. Orsaken är som bekant, torkan som varit och som permanent skadat majsskörden. Sojan verkar kunna repa sig, men alltså inte majsen.
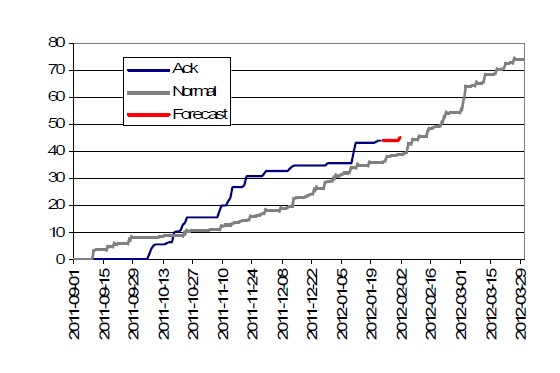
Nedan ser vi ackumulerad nederbörd i Cordoba, Argentina. Den blåa grafen visar ackumulerad nederbörd sedan september förra året. Den lilla röda snutten är den senaste väderleksprognosen, som har ungefär 12 mm nederbörd för den 30 januari till den 1 februari. Vi ser att nederbörden som föll i början av den här veckan var en ganska kraftig sådan, betydligt mer än vad som var förutspått.
Det är alltså trots den nederbörd som kom i början på veckan, ändå något lite för lite nederbörd så här års mot vad det borde vara ett normalår. Detta är ett orosmoment, främst för sojan eftersom tärningen redan är mer eller mindre kastad för majsen.
Sojabönor
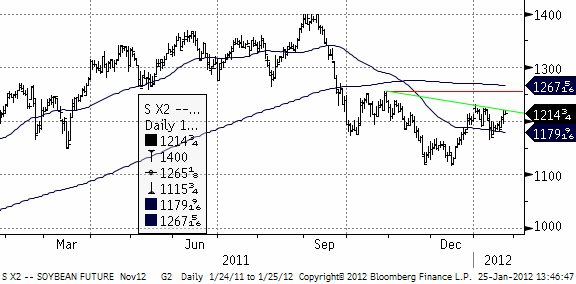
Priset på novemberkontraktet SX2 ligger precis under ett motstånd på 1215 cent. Det finns flera motstånd strax ovanför, men formationen liknar en omvänd head-and-shoulders, vilket alltså har en potentiellt ”bullish” innebörd. Det finns utrymme upp till 1245 och en uppgång över den nivån skulle ge ytterligare skjuts uppåt.
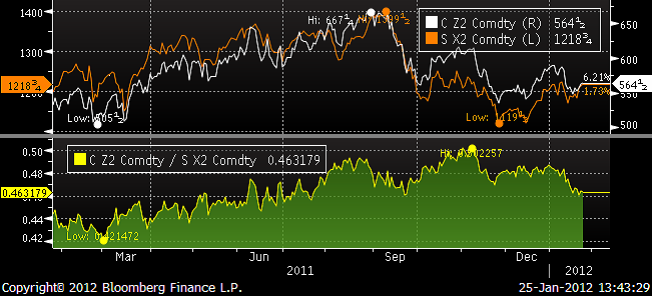
Vi ser i nedanstående diagram som visar kvoten mellan majs- och sojapris att majsen tappat i pris i förhållande till sojabönor, men det finns ingen direkt brist av sojabönor i världen.
Om regnen kommer till Argentina som väntat vid månadsskiftet bör hektarskörden kunna stabiliseras. Det är snarare majsmarknaden som är svag än sojamarknaden som är stark. Det finns gott om tekniska motstånd på ovansidan och det är knappast troligt att en ny bullmarknad skulle orka ta sig rakt igenom dem.
Raps
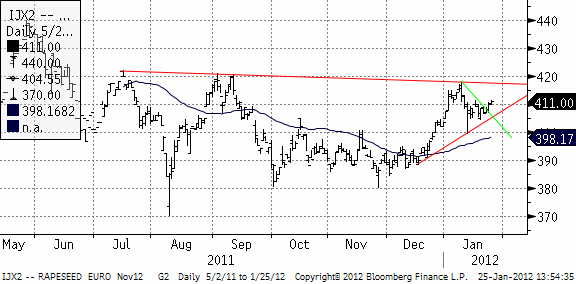
Tekniskt har novemberkontraktet just brutit ett kortsiktigt motstånd och torde röra sig uppåt de närmaste dagarna för att testa motståndet på 420 euro. En uppgång över 420 euro vore en mycket stark köpsignal, annars skulle en uppgång mot 420 euro också kunna vara ett bra tillfälle att sälja om priset inte bryter igenom.
Höstens torra väder i Ukraina kommer också att påverka årets rapsskörd och man räknar med att produktionen kommer att falla 19% till 1.13 miljoner ton vilket skulle vara den lägsta på 5 år enligt data från USDA. EU´s importbehov av raps förväntas bli mycket hög. Den globala produktionen av raps och canola uppskattas uppgå till totalt 61.5 miljoner ton 2012/13, en ökning med 3.4% och den första ökningen på 3 år. Utifrån väderproblemen i Ukraina, en betydligt mindre sådd av höstraps i EU och sjunkande lager, så kommer det att krävas ytterligare ökning av den kanadensiska canola produktionen för att möta efterfrågan under 2012.
Enligt Ag Canada kommer ytterligare areal att tas i bruk för canola produktion och förväntas nå rekordhöga 8.0 miljoner hektar, vilket skulle vara tillräckligt för att få en all-time high skörd på 15 miljoner ton.
Mjölk
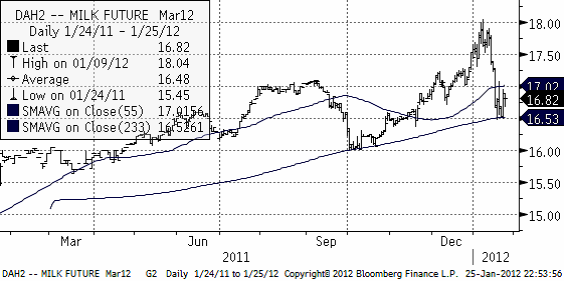
Nedan ser vi priset på marskontraktet på flytande mjölk (kontakt avräknat mot USDA:s prisindex). Rekylen från toppnoteringen vid 18 dollar studsade på 16.50 och de senaste dagarna har priset pendlat mellan 16.50 och 17 med förhållandevis stora
Gris
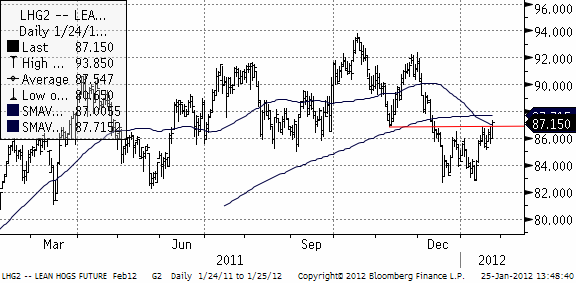
Priset på lean hogs är uppe i sälj-zonen igen. Med så många typer av tekniska motstånd ansamlade vid och strax ovanför där priset ligger idag, är sannolikheten låg att priset tar sig rakt igenom. Vi rekommenderar att man säljer vid den här nivån. Statistik från Kina visar att grispopulationen sjönk i december för första gången på 10 månader. Samtidigt rapporteras som utbrott av African Swine Fever (ASF) på flera håll i världen, bland annat i olika regioner samtidigt i Ryssland.
Vi intar ändå, baserat på den tekniska analysen, en negativ hållning och rekommendationen blir:
1 vecka: negativ
3 månader: negativ
Nedan ser vi februarikontraktet
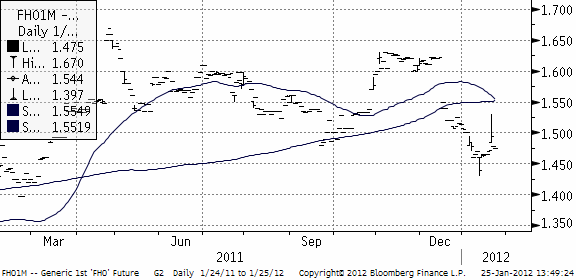
Priset i Europa har betett sig på samma sätt. Nedan ser vi det vid var tid kortaste terminskontraktet (närmast spot):
Valutor
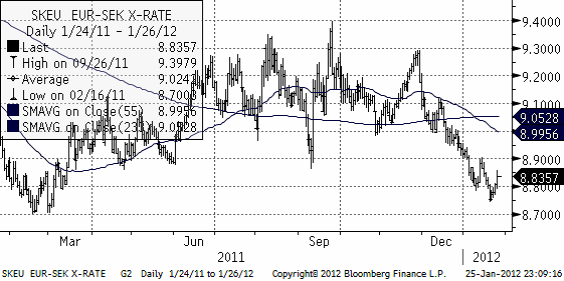
EURSEK – försöker korrigera nedgången
Vi har en neutral rekommendation på både en veckas sikt och tre månaders.
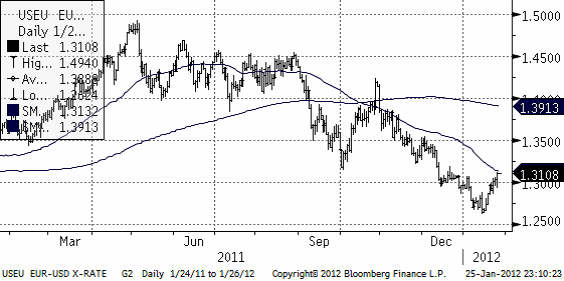
EURUSD – i rekyl fortfarande
Kursen har rekylerat upp till 55-dagars glidande medelvärde, som borde utgöra ett visst motstånd.
Rekommendation: Neutral på en veckas sikt. Negativ på tre månader.
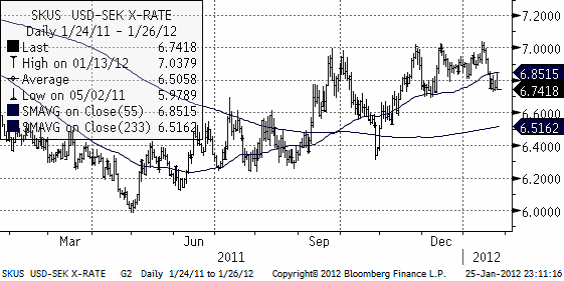
USDSEK – söker efter en botten i korrektionen nedåt
Dollarn föll inte mycket mot kronan efter FOMC-mötet på onsdagskvällen, trots att räntan kommer att ligga kvar på ultralåg nivå till åtminstone 2014, enligt Ben B. Ändå ligger kursen under 55-dagars glidande medelvärde och ny ordentlig uppgång och test av 7-kronors-nivån kan vi inte vänta så länge kursen ligger under medelvärdet.
Vi har en neutral rekommendation på en veckas sikt, men är positive på tre månader.
[box]SEB Veckobrev Jordbruksprodukter är producerat av SEB Merchant Banking och publiceras i samarbete och med tillstånd på Råvarumarknaden.se[/box]
Disclaimer
The information in this document has been compiled by SEB Merchant Banking, a division within Skandinaviska Enskilda Banken AB (publ) (“SEB”).
Opinions contained in this report represent the bank’s present opinion only and are subject to change without notice. All information contained in this report has been compiled in good faith from sources believed to be reliable. However, no representation or warranty, expressed or implied, is made with respect to the completeness or accuracy of its contents and the information is not to be relied upon as authoritative. Anyone considering taking actions based upon the content of this document is urged to base his or her investment decisions upon such investigations as he or she deems necessary. This document is being provided as information only, and no specific actions are being solicited as a result of it; to the extent permitted by law, no liability whatsoever is accepted for any direct or consequential loss arising from use of this document or its contents.
About SEB
SEB is a public company incorporated in Stockholm, Sweden, with limited liability. It is a participant at major Nordic and other European Regulated Markets and Multilateral Trading Facilities (as well as some non-European equivalent markets) for trading in financial instruments, such as markets operated by NASDAQ OMX, NYSE Euronext, London Stock Exchange, Deutsche Börse, Swiss Exchanges, Turquoise and Chi-X. SEB is authorized and regulated by Finansinspektionen in Sweden; it is authorized and subject to limited regulation by the Financial Services Authority for the conduct of designated investment business in the UK, and is subject to the provisions of relevant regulators in all other jurisdictions where SEB conducts operations. SEB Merchant Banking. All rights reserved.
Analys
Brent crude inching higher on optimism that US inflationary pressures are fading


Brent crude price inching higher on optimistic that US inflationary pressures are fading. Brent crude closed up 1.1 USD/b ydy to a close of USD 86.39/b which was the highest close since the end of April. This morning it is trading up another half percent to USD 86.9/b along with comparable gains in industrial metals and Asian equities. At 14:30 CET the US will publish its preferred inflation gauge, the PCE figure. Recent data showed softer US personal spending in Q1. Expectations are now high that the PCE inflation number for May will show fading inflationary pressures in the US economy thus lifting the probability for rate cuts later this year which of course is positive for the economy and markets in general and thus positive for oil demand and oil prices. Hopes are high for sure.
Brent crude is trading at the highest since the end of April
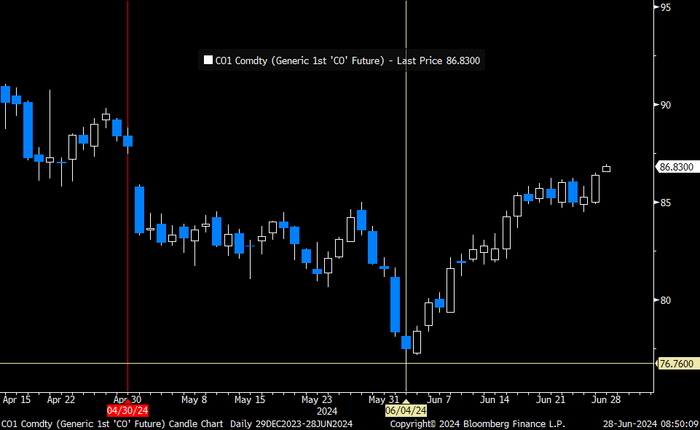
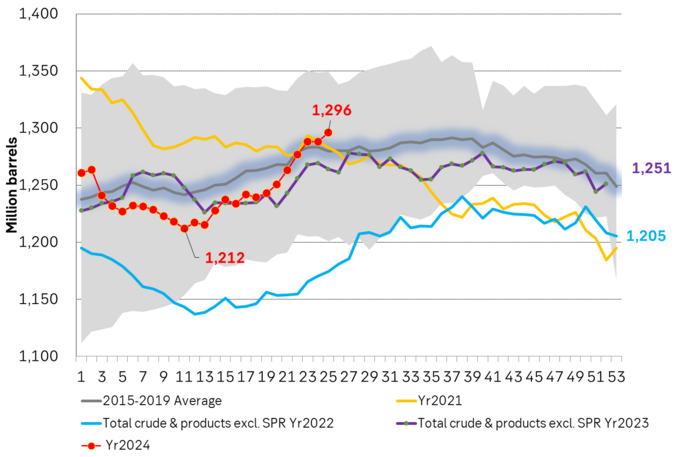
The rally in Brent crude since early June is counter to rising US oil inventories and as such a bit puzzling to the market.
US commercial crude and oil product stocks excluding SPR.
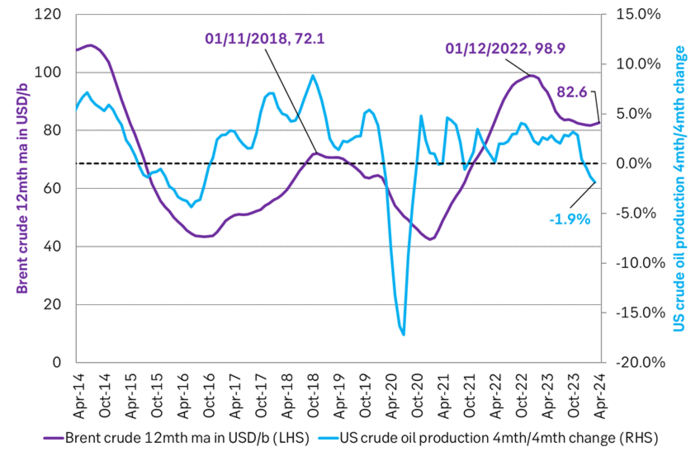
Actual US crude oil production data for April will be published later today. Zero growth in April is likely. Later today the US EIA will publish actual production data for US crude and liquids production for April. Estimates based on US DPR and DUC data indicates that there will indeed be zero growth in US crude oil production MoM in April. This will likely driving home the message that there is no growth in US crude oil production despite a Brent crude oil price of USD 83/b over the past 12 mths. The extension of this is of course rising expectations that there will be no growth in US crude oil production for the coming 12 months either as long as Brent crude hoovers around USD 85/b.
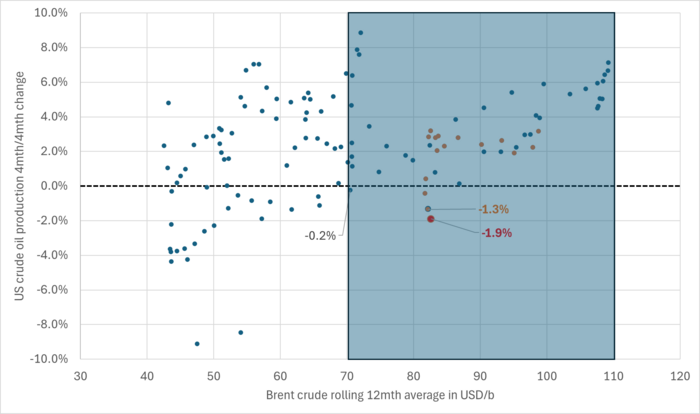
US production breaking a pattern since Jan 2014. No growth at USD 83/b. What stands out when graphing crude oil prices versus growth/decline in US crude oil production is that since January 2014 we have not seen a single month that US crude oil production is steady state or declining when the Brent crude oil price has been averaging USD 70.5/b or higher.
US Senate looking into the possibility that US shale oil producers are now colluding by holding back on investments, thus helping to keep prices leveled around USD 85/b.
Brent crude 12mth rolling average price vs 4mth/4mth change in US crude oil production. Scatter plot of data starting Jan 2014. Large red dot is if there is no change in US crude oil production from March to April. Orange dots are data since Jan 2023. The dot with ”-1.3%” is the March data point.
Brent crude 12mth rolling average price vs 4mth/4mth change in US crude oil production. Data starting Jan 2014. The last data point is if there is no change in US crude oil production from March to April.
Analys
Price forecast update: Weaker green forces in the EU Parliament implies softer EUA prices


We reduce our forecast for EUA prices to 2030 by 10% to reflect the weakened green political agenda in the EU Parliament following the election for the Parliament on 6-9 June. The upcoming election in France on 7 July is an additional risk to the political stability of EU and thus in part also to the solidity of the blocks green agenda. Environmental targets for 2035 and 2040 are most at risk of being weakened on the margin. EUA prices for the coming years to 2030 relate to post-2030 EUA prices through the bankability mechanism. Lower post-2030 climate ambitions and lower post-2030 EUA prices thus have a bearish impact on EUA prices running up to 2030. Actual softening of post-2030 climate ambitions by the EU Parliament have yet to materialize. But when/if they do, a more specific analysis for the consequences for prices can be carried out.
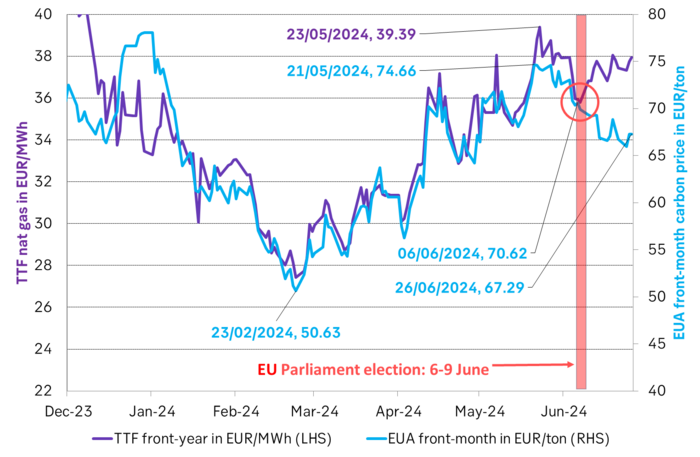
EUA prices broke with its relationship with nat gas prices following the EU Parliament election. The EUA price has dutifully followed the TTF nat gas price higher since they both bottomed out on 23 Feb this year. The EUA front-month price bottomed out with a closing price of EUR 50.63/ton on 23 Feb. It then reached a recent peak of EUR 74.66/ton on 21 May as nat gas prices spiked. Strong relationship between EUA prices and nat gas prices all the way. Then came the EU Parliament election on 6-9 June. Since then the EUA price and TTF nat gas prices have started to depart. Bullish nat gas prices are no longer a simple predictor for bullish EUA prices.
The front-month EUA price vs the front-year TTF nat gas price. Hand in hand until the latest EU Parliament election. Then departing.
The EU Parliament election on 6-9 June was a big backlash for the Greens. The Greens experienced an euphoric victory in the 2019 election when they moved from 52 seats to 74 seats in the Parliament. Since then we have had an energy crisis with astronomic power and nat gas prices, rampant inflation and angry consumers being hurt by it all. In the recent election the Greens in the EU Parliament fell back to 53 seats. Close to where they were before 2019.
While green politics and CO2 prices may have gotten a lot of blame for the pain from energy prices over the latest 2-3 years, the explosion in nat gas prices are largely to blame. But German green policies to replace gas and oil heaters with heat pumps and new environmental regulations for EU farmers are also to blame for the recent pullback in green seats in the Parliament.
Green deal is still alive, but it may not be fully kicking any more. Existing Green laws may be hard to undo, but targets for 2035 and 2040 will be decided upon over the coming five years and will likely be weakened.
At heart the EU ETS system is a political system. As such the EUA price is a politically set price. It rests on the political consensus for environmental priorities on aggregate in EU.
The changes to the EU Parliament will likely weaken post-2030 environmental targets. The changes to the EU Parliament may not change the supply/demand balance for EUAs from now to 2030. But it will likely weaken post-2030 environmental targets and and thus projected EU ETS balances and EUA prices post-2030. And through the bankability mechanism this will necessarily impact EUA prices for the years from now to 2030.
Weaker post-2030 ambitions, targets and prices implies weaker EUA prices to 2030. EUA prices are ”bankable”. You can buy them today and hold on to them and sell them in 2030 or 2035. The value of an EUA today fundamentally rests on expected EUA prices for 2030/35. These again depends on EU green policies for the post 2030 period. Much of these policies will be ironed out and decided over the coming five years.
Weakening of post-2030 targets have yet to materialize. But just talking about it is a cold shower for EUAs. These likely coming weakenings in post-2030 environmental targets and how they will impact EUA prices post 2030 and thus EUA prices from now to 2030 are hard to quantify. But what is clear to say is that when politicians shift their priorities away from the environment and reduce their ambitions for environmental targets post-2030 it’s like a cold shower for EUA prices already today.
On top of this we now also have snap elections in the UK on 4 July and in France on 7 July with the latter having the potential to ”trigger the next euro crisis” according to Gideon Rachman in a recent article in FT.
What’s to be considered a fair outlook for EUA prices for the coming five years in this new political landscape with fundamentally changed political priorities remains to be settled. But that EUA price outlooks will be lowered versus previous forecasts is almost certain.
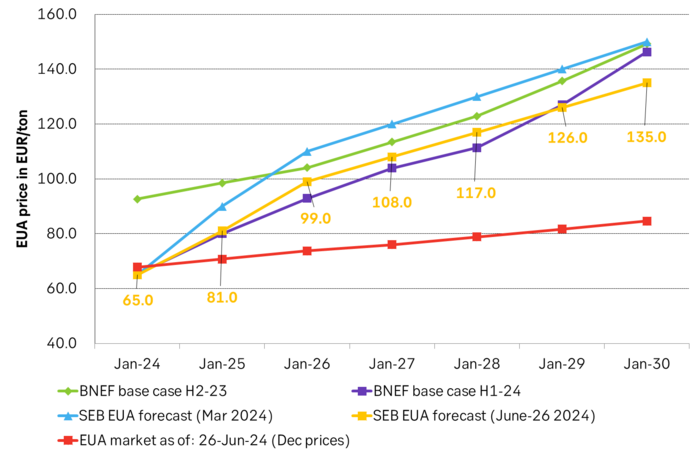
We reduce our EUA price forecast to 2030 by 10% to reflect the new political realities. To start with we reduce our EUA price outlook by 10% from 2025 to 2030 to reflect the weakened Green agenda in the EU parliament.
SEB’s EUA price forecast, BNEF price forecasts and current market prices in EUR/MWh
Analys
The most important data point in the global oil market will be published on Friday 28 June


US crude oil production has been booming for more than a decade. Interrupted by two setbacks in response to sharp price declines. The US boom has created large waves in the global oil market and made life very difficult for OPEC(+). Brent crude has not traded below USD 70/b since Dec-2021 and over the past year, it has averaged USD 84/b. US shale oil production would typically boom with such a price level historically. However, there has been zero growth in US crude oil production from Sep-2023 to Mar-2024. This may be partially due to a cold US winter, but something fundamentally seems to have changed. We recently visited a range of US E&P and oil services companies in Houston. The general view was that there would be zero growth in US crude oil production YoY to May 2025. If so and if it also is a general shift to sideways US crude oil production beyond that point, it will be a tremendous shift for the global oil market. It will massively improve the position of OPEC+. It will also sharply change our perception of the forever booming US shale oil supply. But ”the proof is in the pudding” and that is data. More specifically the US monthly, controlled oil production data is to be published on Friday 28 June.
The most important data point in the global oil market will be published on Friday 28 June. The US EIA will then publish its monthly revised and controlled oil production data for April. Following years of booming growth, the US crude oil production has now gone sideways from September 2023 to March 2024. Is this a temporary blip in the growth curve due to a hard and cold US winter or is it the early signs of a huge, fundamental shift where US crude oil production moves from a decade of booming growth to flat-lining horizontal production?
We recently visited a range of E&P and oil services companies in Houston. The general view there was that US crude oil production will be no higher in May 2025 than it is in May 2024. I.e. zero growth.
It may sound undramatic, but if it plays out it is a huge change for the global oil market. It will significantly strengthen the position of OPEC+ and its ability to steer the oil price to a suitable level of its choosing.
The data point on Friday will tell us more about whether the companies we met are correct in their assessment of non-growth in the coming 12 months or whether production growth will accelerate yet again following a slowdown during winter.
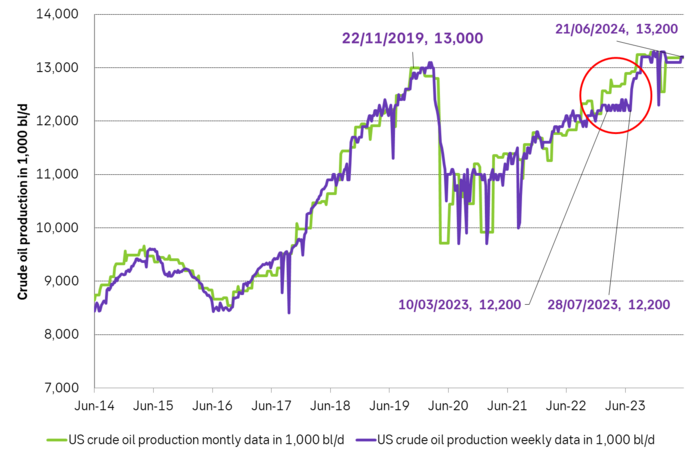
The US releases weekly estimates for its crude oil production but these are rough, temporary estimates. The market was fooled by these weekly numbers last year when the weekly numbers pointed to a steady production of around 12.2 m b/d from March to July while actual monthly data, with a substantial lag in publishing, showed that production was rising strongly.
The real data are the monthly, controlled data. These data will be the ”proof of the pudding” of whether US shale oil production now is about to shift from a decade of booming growth to instead flat-line sideways or whether it will drift gradually higher as projected by the US EIA in its latest Short-Term Energy Outlook.
US crude oil production given by weekly data and monthly data. Note that the monthly, controlled data comes with a significant lag. The market was thus navigating along the weekly data which showed ”sideways at 12.2 m b/d” for a significant period last year until actual data showed otherwise with a time-lag.
If we add in Natural Gas Liquids and zoom out to include history back to 2001 we see an almost uninterrupted boom in supply since Sep 2011 with a few setbacks. At first glance, this graph gives little support to a belief that US crude oil production now suddenly will go sideways. Simple extrapolation of the graph indicates growth, growth, growth.
US crude and liquids production has boomed since September 2011
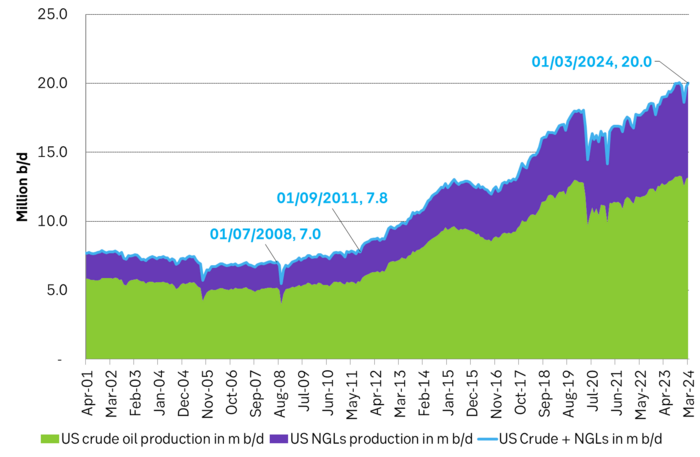
However. The latest actual data point for US crude oil production is for March with a reading of 13.18 m b/d. What stands out is that production then was still below the September level of 13.25 m b/d.
The world has gotten used to forever growing US crude oil production due to the US shale oil revolution, with shorter periods of sharp production declines as a result of sharp price declines.
But the Brent crude oil price hasn’t collapsed. Instead, it is trading solidly in the range of USD 70-80-90/b. The front-month Brent crude oil contract hasn’t closed below USD 70/b since December 2021.
Experiences from the last 15 years would imply wild production growth and activity in US shale oil production at current crude oil prices. But US crude oil production has now basically gone sideways to lower from September to March.
The big, big question is thus: Are we now witnessing the early innings of a big change in US shale oil production where we shift from booming growth to flat-lining of production?
If we zoom in we can see that US liquids production has flat-lined since September 2023. Is the flat-lining from Sep to Mar due to the cold winter so that we’ll see a revival into spring and summer or are we witnessing the early signs of a huge change in the global oil market where US crude oil production goes from booming growth to flat-line production.

The message from Houston was that there will be no growth in US crude oil production until May 2025. SEB recently visited oil and gas producers and services providers in Houston to take the pulse of the oil and gas business. Especially so the US shale oil and shale gas business. What we found was an unusually homogeneous view among the companies we met concerning both the state of the situation and the outlook. The sentiment was kind of peculiar. Everybody was making money and was kind of happy about that, but there was no enthusiasm as the growth and boom years were gone. The unanimous view was that US crude oil production would be no higher one year from now than it is today. I.e. flat-lining from here.
The arguments for flat-lining of US crude oil production here onward were many.
1) The shale oil business has ”grown up” and matured with a focus on profits rather than growth for the sake of growth.
2) Bankruptcies and M&As have consolidated the shale oil companies into larger, fewer public companies now accounting for up to 75% of total production. Investors in these companies have little interest/appetite for growth after having burned their fingers during a decade and a half of capital destruction. These investors may also be skeptical of the longevity of the US shale oil business. Better to fully utilize the current shale oil infrastructure steadily over the coming years and return profits to shareholders than to invest in yet more infrastructure capacity and growth.
3) The remaining 25% of shale oil producers which are in private hands have limited scope for growth as they lack pipeline capacity for bringing more crude oil from field to market. Associated nat gas production is also a problem/bottleneck as flaring is forbidden in many places and pipes to transport nat gas from field to market are limited.
4) The low-hanging fruits of volume productivity have been harvested. Drilling and fracking are now mostly running 24/7 and most new wells today are all ”long wells” of around 3 miles. So hard to shave off yet another day in terms of ”drilling yet faster” and the length of the wells has increasingly reached their natural optimal length.
5) The average ”rock quality” of wells drilled in the US in 2024 will be of slightly lower quality than in 2023 and 2025 will be slightly lower quality than 2024. That is not to say that the US, or more specifically the Permian basin, is quickly running out of shale oil resources. But this will be a slight headwind. There is also an increasing insight into the fact that US shale oil resources are indeed finite and that it is now time to harvest values over the coming 5-10 years. One company we met in Houston argued that US shale oil production would now move sideways for 6-7 years and then overall production decline would set in.
The US shale oil revolution can be divided into three main phases. Each phase is probably equally revolutionary as the other in terms of impact on the global oil market.
1) The boom phase. It started after 2008 but didn’t accelerate in force before the ”Arab Spring” erupted and drove the oil price to USD 110/b from 2011 to 2014. It was talked down time and time again, but it continued to boom and re-boom to the point that today it is almost impossible to envision that it won’t just continue to boom or at least grow forever.
2) The plateau phase. The low-hanging fruits of productivity growth have been harvested. The highest quality resources have been utilized. The halfway point of resources has been extracted. Consolidation, normalization, and maturity of the business has been reached. Production goes sideways.
3) The decline phase. Eventually, the resources will have been extracted to the point that production unavoidably starts to decline.
Moving from phase one to phase two may be almost as shocking for the oil market as the experience of phase 1. The discussions we had with oil producers and services companies in Houston may indicate that we may now be moving from phase one to phase two. That there will be zero shale oil production growth YoY in 2025 and that production then may go sideways for 6-7 years before phase three sets in.
US EIA June STEO report with EIA’s projection for US crude oil production to Dec-2025. Softer growth, but still growth.
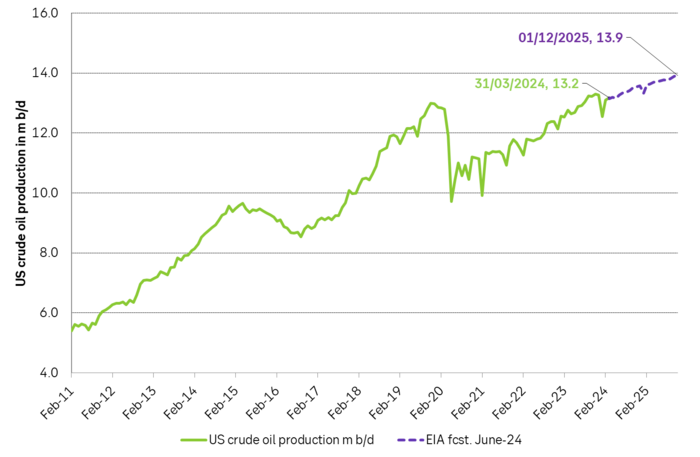
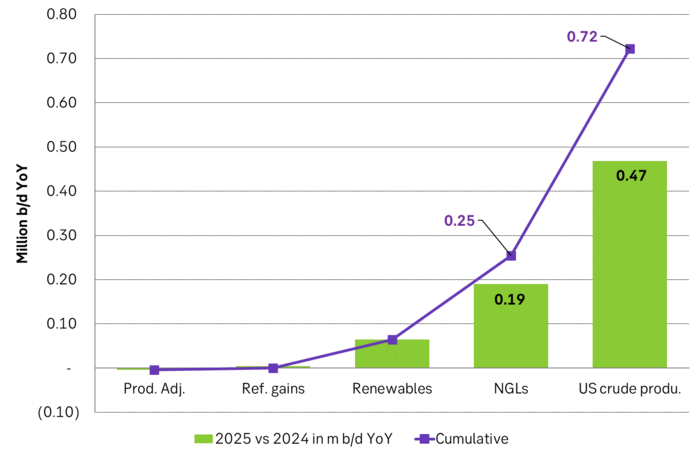
US EIA June STEO report with YoY outlook growth for 2025. Projects that US crude production will grow by 0.47 m b/d YoY in 2025 and that total liquids will grow by 720 k b/d YoY.
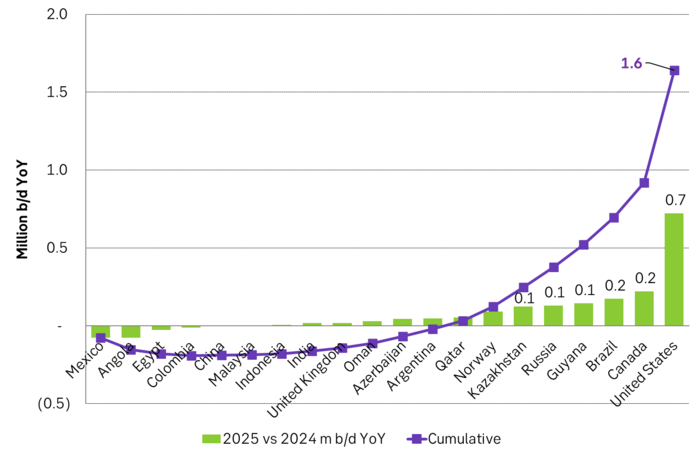
US EIA June STEO report with outlook for production growth by country in 2025. This shows how big the US production growth of 0.7 m b/d YoY really is compared to other producers around the world
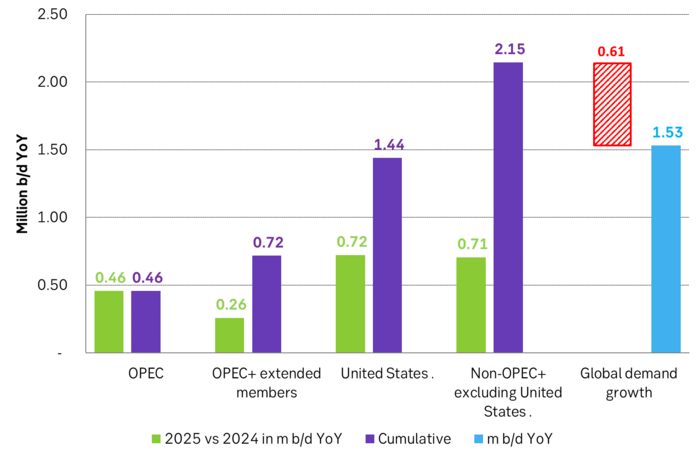
US EIA June STEO report with projected global growth in supply and demand YoY in 2025. Solid demand growth, but even strong supply growth with little room for OPEC+ to expand. Production growth by non-OPEC+ will basically cover global oil demand growth.
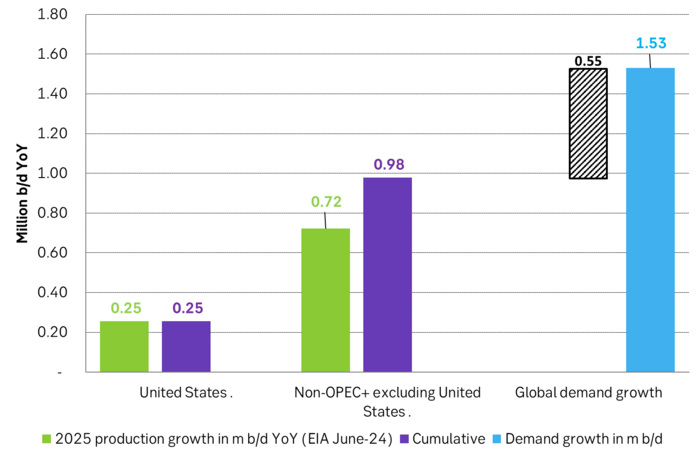
But if there instead is zero growth in US crude oil production in 2025 and the US liquids production only grows by 0.25 m b/d YoY due to NGLs and biofuels, then suddenly there is room for OPEC+ to put some of its current production cuts back into the market. Thus growth/no-growth in US shale oil production will be of huge importance for OPEC+ in 2025. If there is no growth in US shale oil then OPEC+ will have a much better position to control the oil price to where it wants it.
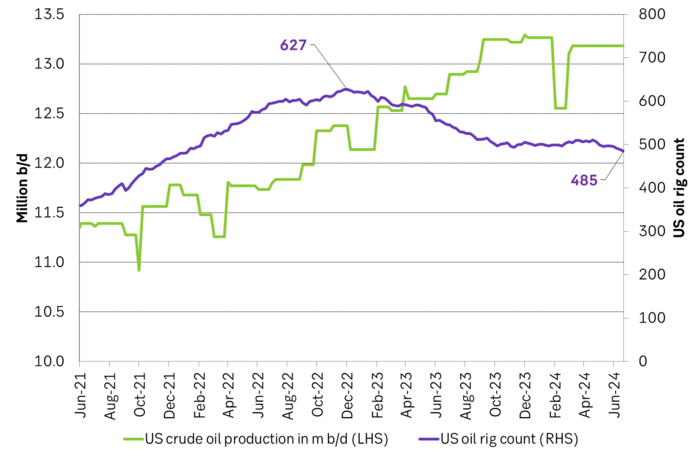
US crude oil production and drilling rig count
-

 Nyheter7 dagar sedan
De tre bästa råvaruvaruaktierna just nu
-

 Nyheter2 veckor sedan
Lundin Mining vill köpa Filo Corp tillsammans med BHP
-

 Nyheter4 veckor sedan
Africa Oil är bra att köpa anser Stifel som inleder analysbevakning
-

 Nyheter3 veckor sedan
Stor risk att Africa Energy inte överlever det kommande året
-

 Nyheter4 veckor sedan
First Nordic Metals har fyra prospekteringsprojekt i Sverige
-

 Analys4 veckor sedan
Brent crude inching higher on optimism that US inflationary pressures are fading
-

 Nyheter2 veckor sedan
Uniper satsar på att göra elektrobränsle av sin elektricitet
-

 Nyheter2 veckor sedan
Tre bra aktier inom olja och oljeservice i Kanada


