

Analys
SEB Jordbruksprodukter, 16 augusti 2012

 Fredagens WASDE-rapport var ”OK” för vete och sojabönor, men USDA:s prognos för utbud och efterfrågan i majs visar rekordlåga lager och vi tror inte att man tagit hänsyn till de produktionsbortfall som kunnat tas hänsyn till. Priset måste ransonera konsumtionen mycket. Risken är på uppsidan. Att priset ändå inte gick upp ordentligt beror på att EPA/USDA efter WASDE-rapporten i fredags erkände att man ”tittar på” att minska etanolanvändningen. Regn under helgen fick också sojabönspriset att mjukna.
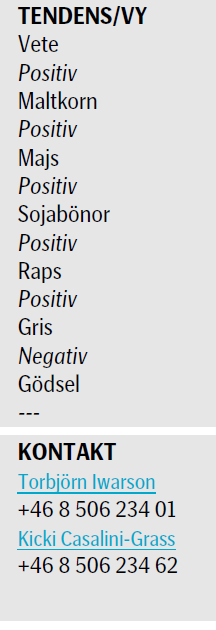
Ett politiskt beslut som leder till minskade stöd till etanolproduktion med majs skulle kunna få priserna att falla. Vi vet alldeles för lite än så länge om den här processen, men behåller tills vidare vår positiva vy på prisutvecklingen för majs, och därmed för vete och oljeväxter också.
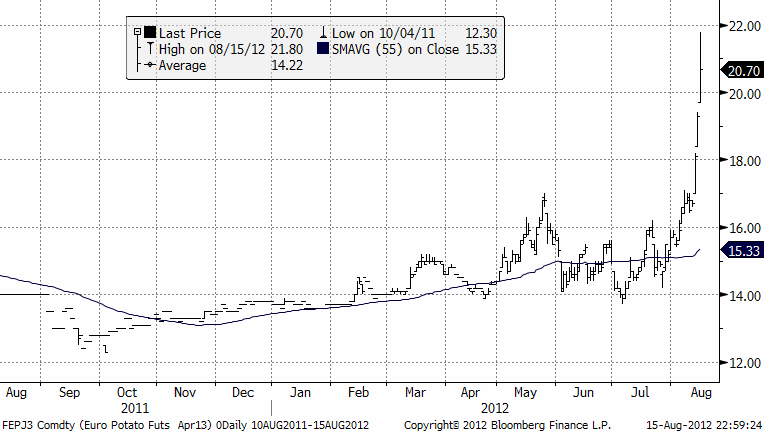
Priset på potatis för ny skörd har på tre dagar stigit från 17 euro per dt till 20.70 euro. Potatishaussen är alltså det mest spännande vi har att berätta om den här veckan.
”The Duke brothers” som på 80-talet försökte klämma åt apelsinjuicemarknaden i filmen ”Ombytta roller” (Trading places), har nu fått en ny marknad. Idag är tredje dagen man kan handla frystkoncentrerad äppeljuice, på MGEX.
 Nu har vi lagt till terminspris-tabeller för EUREX mjölkpulver och Amerikansk klass 3 flytande mjölk som handlas på CME, längst bak i det här brevet.
Odlingsväder
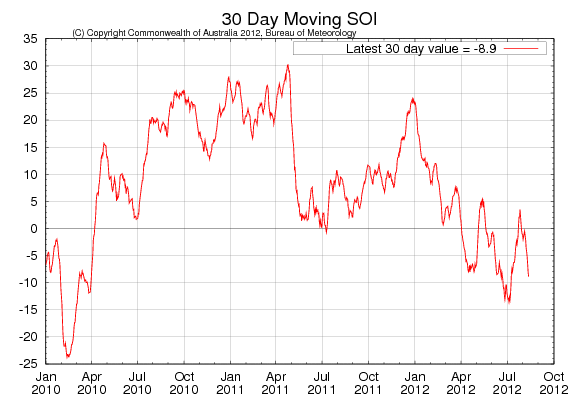
”Renewed development towards El Niño” skrev Australian Bureau of Meteorology den 14 augusti. De skriver att utvecklingen mot El Niño avtog under juli, men att utvecklingen har tagit ny fart de senaste två veckorna. Deras klimatmodeller indikerar nu att El Niño-förhållanden uppnås innan september är slut. Southern Oscillation Index (SOI) har återigen fallit och ligger nu på -8.1. Ett värde på mellan -8 och +8 indikerar neutrala ENSO-förhållanden, medan ett värde under -8 indikerar El Niño. Flera andra faktorer, såsom t ex högre temperatur vattnet i mellersta Stilla Havet pekar i samma riktning, en återkomst av El Niño. El Niño innebär generellt sett torrt och varmt väder i Australien och Sydostasien, och fuktigt väder i Sydamerika. Australien producerar mycket vete, medan Sydamerika producerar mindre vete, mindre i år än vanligt pga Kirschners konfiskatoriska skatt av argentiska veteodlare. Däremot producerar Sydamerika mycket sojabönor och mycket majs, och socker. För världen väger Sydamerikas fördelar mycket tyngre än Australiens nackdelar.
Vete
WASDE-rapporten i fredags visade precis som väntat lägre produktion. Produktionen var till och med lägre än väntat.
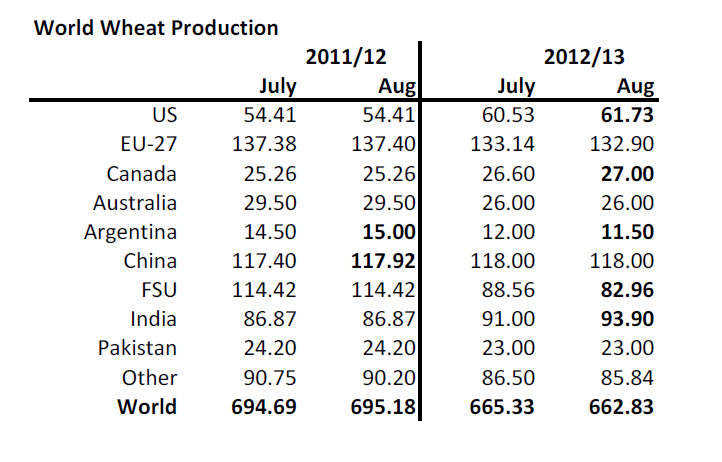
För USA och Kanada justerades produktionen upp något lite. Även Indien justerades upp. EU justerades ner en gnutta, liksom Argentina (på lägre areal). Ryssland justerades ner 6 mt, vilket antagligen INTE är tillräckligt, som vi skrev för ett par veckor sedan. Med 30% lägre hektarskörd, såsom siffrorna nått oss, innebär en total spannmålsskörd på 66 mt, inte 75 – 80 som Rysslands jordbruksministerium säger. Man lämnar Australiens förutspådda skörd oförändrad, förmodligen för att man inte visste något säkert om El Niño när man gjorde rapporten. Vi har sett ovan att det är mycket troligt att det kommer att vara El Niño innan slutet av september. USDA har justerat ner hektarskörden från förra året med 6% och då var förra årets hektarskörd långt över trenden. Det ligger alltså väldigt lite El Niño-effekt i siffrorna från USDA. Nedan ser vi förändringen i hektarskörd för vete i Australien från året innan, för de år då det varit El Niñoförhållanden den 30 september.
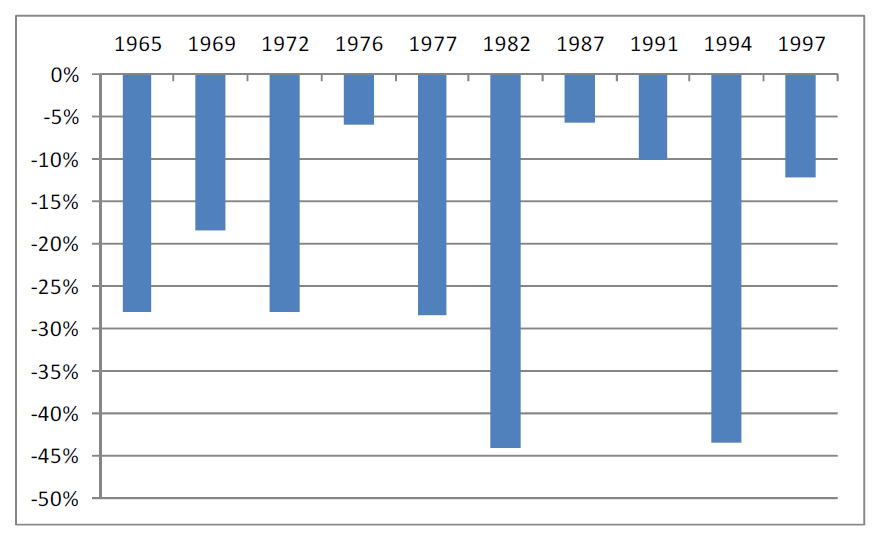
Jag har valt att identifiera El Niño med SOI < -8 per 30 september. Om vi nu tänker på att USDA endast har justerat ner förra årets hektarskörd med 6% för Australien, och vi tänker att det borde vara närmare genomsnittet de senaste 50 åren, -22%, så kan vi räkna lite. Skörden förra året i Australien var 29.5 mt. USDA har den till 26 mt i år. USDA räknar då med 6% lägre areal också. Låt oss anta att det är så och så sänker vi hektarskörden med 22% istället för 6%. Då hamnar vi på 21.5 mt. Det är alltså 4.5 mt lägre och alltså 4.5 mt lägre globala carry out stocks, eftersom detta skulle ha exporterats. Nedan ser vi USDA:s idé om carry out stocks:
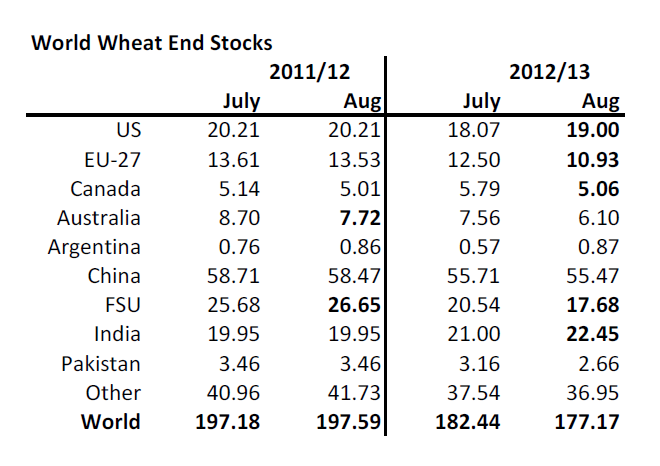
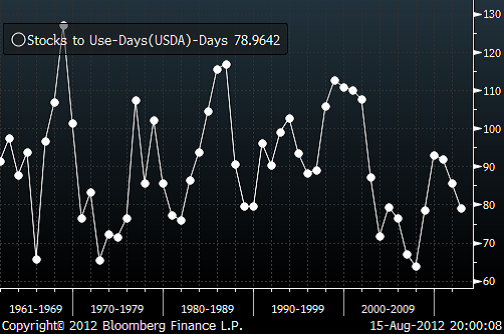
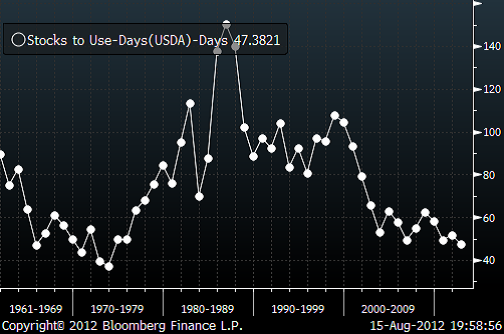
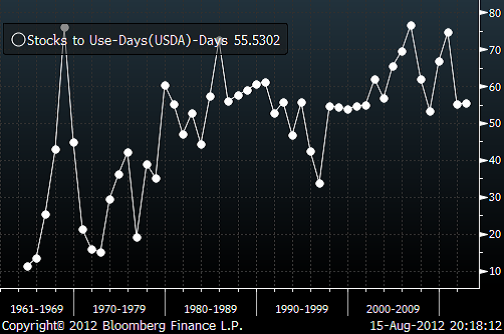
Vi tror att utgående lager kommer att reduceras ytterligare. Lagren är inte akut låga i ett historiskt perspektiv. Problemet i världen är inte vete, utan majs. Nedan ser vi utgående lager enligt USDA:s prognos i förhållande till global konsumtion (i antal dagar av konsumtion).
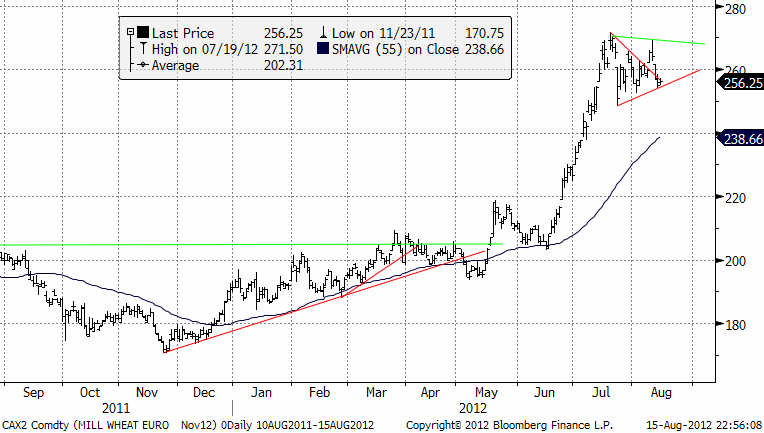
Matifvetet med novemberleverans har fortfarande en ”bullish” triangel. Priset ”brukar” bryta upp vid sådana mönster.
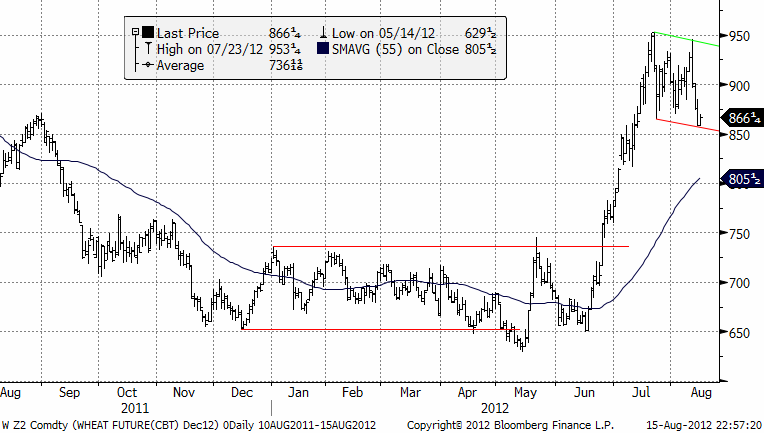
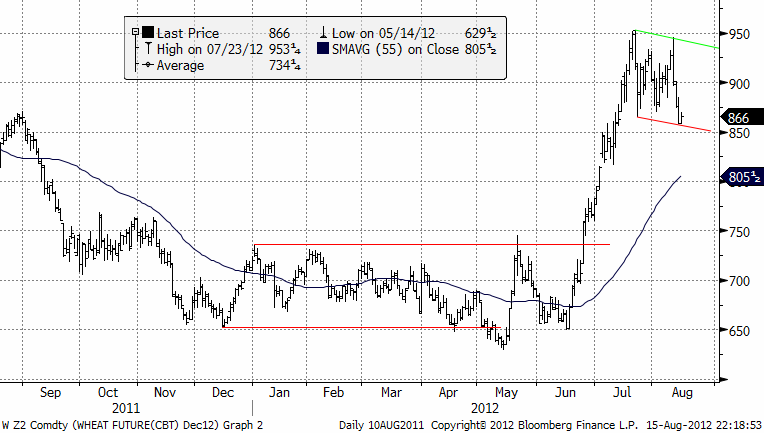
Nedan ser vi Chicagovetet med leverans i december. Den tekniska bilden indikerar samma sak här, men antyder snarare att ytterligare trendlös ”sidledes” rörelse är mest sannolik.
Maltkorn
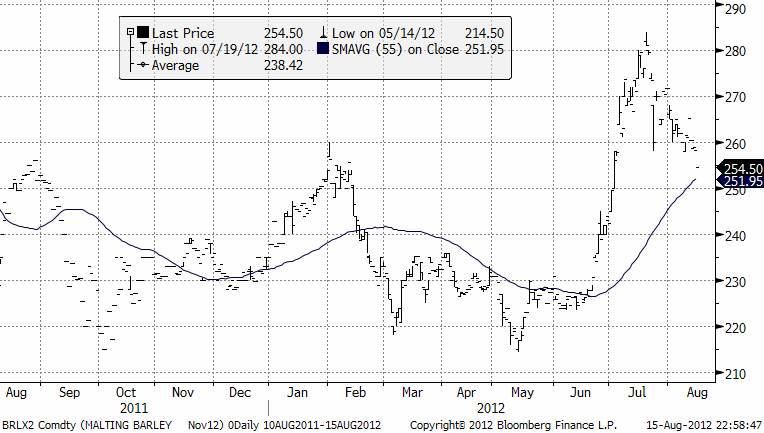
Novemberkontraktet på maltkorn ligger i en nedgångsfas som har stora likheter med vad som i efterhand ofta identifieras som en rekyl inför en ny, kraftig prisuppgång. Nedgången från förra veckan är 4 euro per ton.
Potatis
Potatispriset bröt intervallet när 17 euro bröts och det genererade en teknisk köpsignal. Säljarna klev bort från 17. Det fick priset att på tre dagar gå upp från 17 euro per dt till 21.80 som högst för att igår stänga på 20.70.
Majs
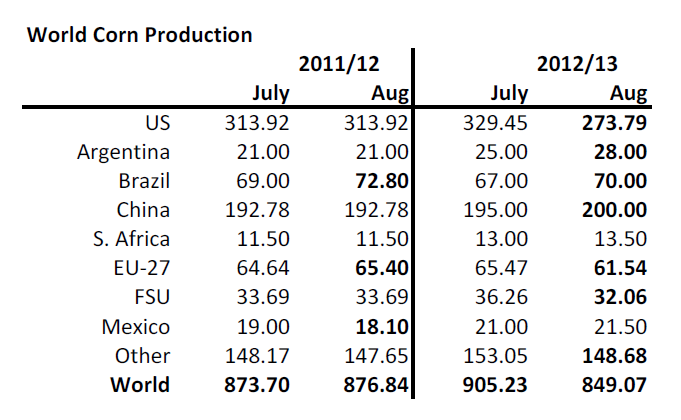
Nedanför ser vi USDA:s produktionsestimat. Sedan julirapporten har de justerat ner produktionen med 55 mt. Man har höjt produktionen med 6 mt för Brasilien + Argentina, vilket inte är orimligt om man tar hänsyn till El Niño (vilket de dock inte gjorde för veteproduktionen i Australien). Före detta Sovjetunionen har man antagligen sänkt för lite.
Nedan ser vi utgående lager. USDA har skurit bort 750 miljoner bushels i foderefterfrågan i USA. Dessutom har man sänkt åtgången till etanolproduktion med 400 mbu och 300 mbu i lägre export. Det tar ner utgående lager för USA från 30 till 16.5 mt.
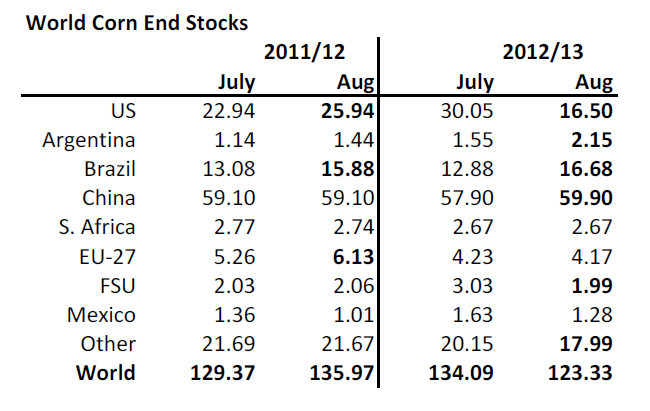
I termer av USA:s konsumtion, är det den näst lägsta nivån på 50 år. 1996 var det en fraktion lägre. Ser vi dock USA som försörjaren av mat till världsmarknaden, och vi jämför utgående lager i USA med global konsumtion, så är det den lägsta lagernivån på 50 år (så långt bakåt vi har data). Vi ser ett diagram över detta nedan.
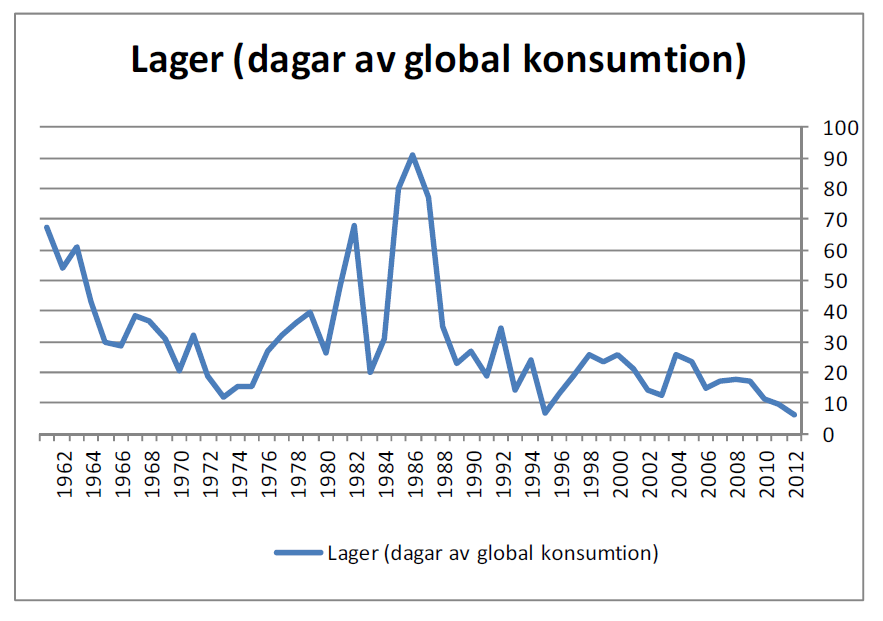
USA:s lager räcker till 6 dagar av global konsumtion. Som vi ser i diagrammet ovan ”slår” det 1995, då lagren räckte i 6.55 dagar. 1973 är ett annat lågvattenmärke. Då bottnade lagren på 12 dagar. 1973 är året för ”the Great Grain Robbery”, då Sovjetunionen råkade ut för torka och i hemlighet dammsög världsmarknaden på spannmål, innan missväxten blev känd. Det var så pass allvarligt att USDA ansåg sig behöva inrätta FAS. FAS är Foreign Agricultural Service. Det är tack vare FAS vi har så bra statistik på globalt utbud och efterfrågan som publiceras genom WASDE-rapporterna. Det lite skrämmande att inse att situationen just nu alltså är värre än 1973 när vi ser på det på det här sättet. Men det kanske inte är fullt lika illa, därför att Argentina och framförallt Brasilien har klivit in som stora producenter för världsmarknaden vid sidan av USA.
Globala utgående lager i termer av global konsumtion ser vi nedan. Det är lågt även där. Det mest väsentliga för världsmarknadspriset är emellertid inte vad som finns i t ex Kina, utan vad som kan komma ut på världsmarknaden. Störst relevans för världsmarknadspriset har situationen i USA.
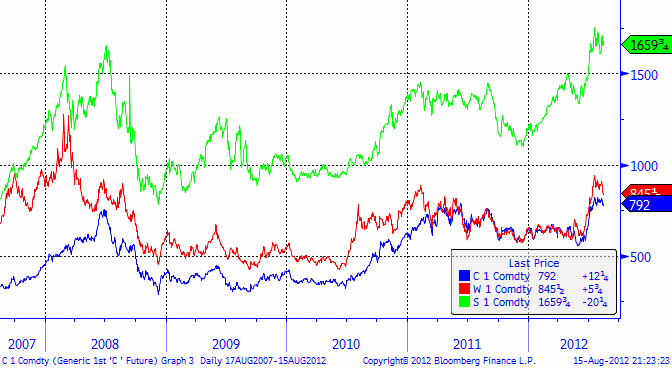
Nedanför ser vi prisutvecklingen för spotkontrakten på sojabönor, vete och majs. Vi ser att världen inte egentligen har ett veteproblem, utan ett sojabönsproblem och framförallt ett majsproblem. Majs är ett mycket sämre spannmål än vete och kan inte gärna bli dyrare än vete, eftersom man då kommer att substituera majs med vete i foderblandningar. Därmed blir världens majsproblem ett veteproblem.
Måndagens crop ratings visade att majs i visade en ökning på 1% i kategorin very poor, till 26%. Förra året var det 5%. Good och Excellent var oförändrade på 20% och 3%. Priset på decembermajs har även den senaste veckan rört sig ”sidledes”, trots all ”action” i fredags vid WASDE-rapporten.
I fredags bekräftade EPA / USDA att man ”tittade på” etanolmandatet. Vi skrev för ett par veckor sedan om att Frankrike kallat in ett nytt G20-möte om matkrisen. Jag hade trott att de återigen skulle försöka anklaga ”investerare” eller ”spekulanter” för att ha drivit upp priset (i strid mot bättre vetande). Men det verkar som om fokus kommer att vara på etanolproduktion av spannmål. I en artikel i måndagens Financial Times rapporteras också om att FN vill att man på G20-mötet ska försöka begränsa produktionen av etanol med spannmål som råvara. För bara några få år sedan var det just samma FN som krävde mer etanolproduktion med spannmål.
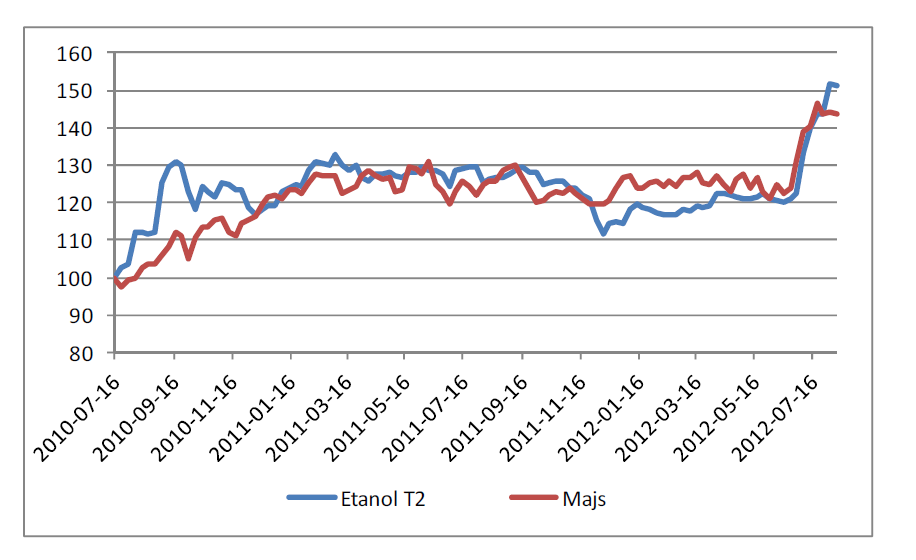
Att majspriset hänger ihop med priset på etanol ser vi lätt i nedanstående diagram, där båda serierna börjar på 100 och anpassade med hedge-ratiot mellan etanol och majs.
Vad politikerna i USA och i G20 kommer fram till har klivit in på höstens scen som en central faktor för prisutvecklingen. Om de beslutar sig för att minska subventionerna för etanol och spara såväl pengar i sina skuldtyngda statsbudgetar, säkert lockande, och återigen ”rädda planeten”, kan de få spannmålspriset att falla kraftigt. Ironiskt nog håller EU nu på att reglera råvaruterminsmarknaden för att hindra spekulanter att orsaka volatilitet, en anklagelse som enhälligt avvisats av alla från IMF, OECD och FAO till akademia. Det är verklighetens ironi, att det nu är politikerna själva som orsakar volatiliteten på marknaden. Det är i och för sig inget ovanligt. Vi har tidigare visat hur exportstopp och prisregleringar införs av politiker när priset stiger. Genom detta får de priset på världsmarknaden att stiga ännu mer. Men hur troligt är det att Obama ett valår fattar ett politiskt beslut som ger redan bedrövade amerikanska bönder ett lägre pris på vad de nu lyckas skörda? Indiens foderindustri har begärt att exporten av majs ska förbjudas omedelbart pga den dåliga produktionen i spåren av den dåliga monsunen. Processen med exportstopp är definitivt startad nu. På en vecka har marknaden glömt frågan om Ryssland kommer att införa exportstopp. Den faktorn är trots allt alltjämt aktuell.
Priset ”borde” gå upp på den rekorddåliga skörden, men den politiska etanolfrågan vet vi för lite om än så länge. Med viss tvekan behåller vi vår köprekommendation.
Sojabönor
Väderleksprognosen för de närmaste tio dagarna innehåller en hel del regn och kallare temperaturer för relevanta sojabönsområden i USA. Men bönorna är å andra sidan ca 3 veckor tidiga i sin utveckling mot normalt. Enligt måndagens crop report sätter 83% av sojabönorna baljor nu, mot 64% förra året. Andelen i good / excellent condition ökade 1% till 30%. Produktionsestimaten i fredagens WASDE-rapport ser vi nedan.
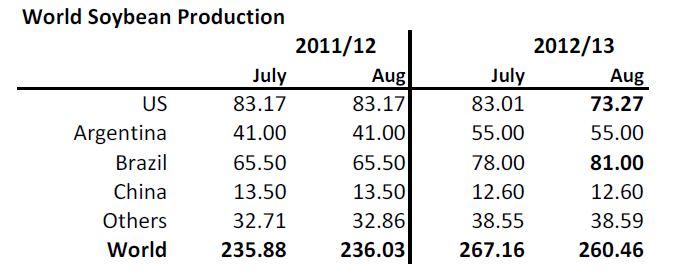
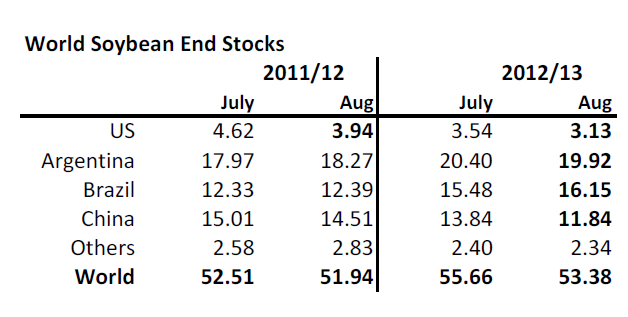
Det är en stor sänkning för USA och en ökning för Brasilien. Enligt detta är Brasilien nu världens största producent av sojabönor. Argentina har just höjt exportskatten på biodiesel från 20% till 32%. Nedan ser vi utgående lager. USA ligger rekordlågt, liksom på majs.
Tack vare Brasilien ligger globala lager inte lågt i ett historiskt perspektiv, som vi ser i nedanstående diagram som visar utgående globala lager i termer av dagar av konsumtion. Argentina har också stora lager, men med den kortsiktiga och destruktiva jordbrukspolitik som landets president bedriver är det svårt att se hur Argentina ska kunna växa enligt sin potential.
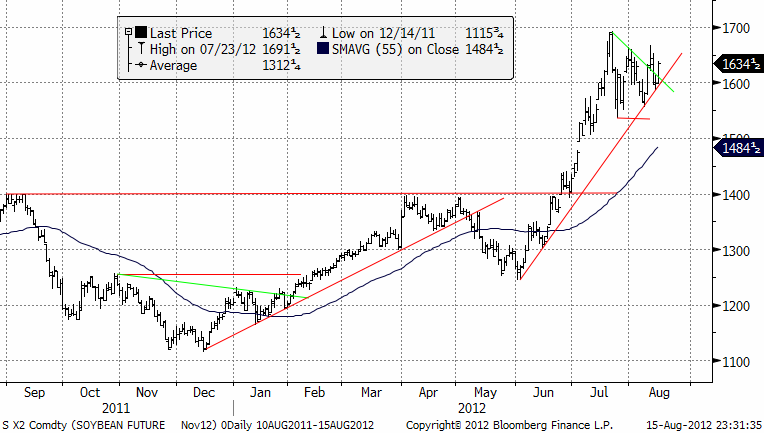
Nedan ser vi kursdiagrammet på sojabönor med leverans i november. Sojabönor har rört sig sidledes precis som majs och vete. Om något pekar trenden fortsatt uppåt.
Raps
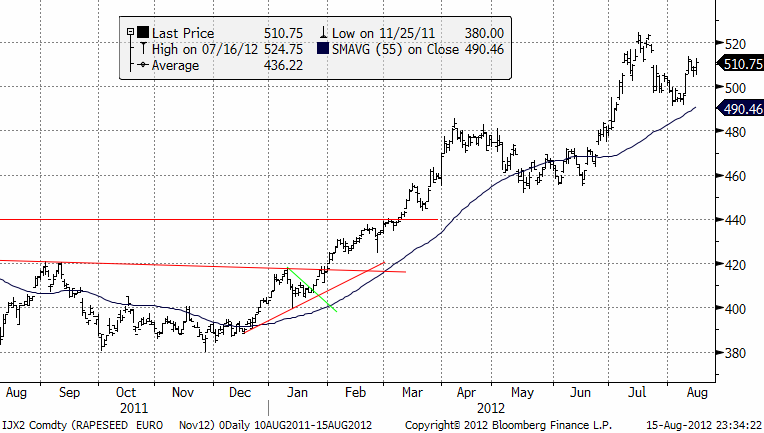
Priset på novemberterminen befinner sig alltjämt i en obruten uppåtgående trend. 500 som var ett starkt stöd, bröts för en vecka sedan, men köpare dök upp på 490 nivån. Trenden uppåt är intakt och det är möjligt att marknaden ska upp och testa toppen från juli igen.
Gris
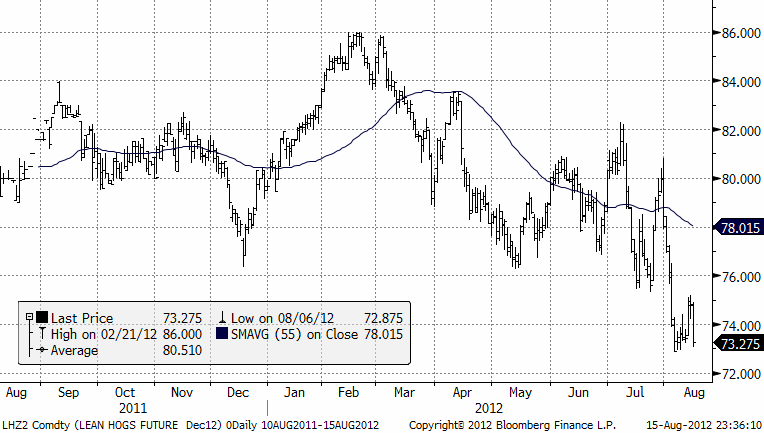
Decemberkontraktet på lean hogs som bröt under stödet på 76 cent, rekylerade upp till detta (ett säljtillfälle) och har nu återtagit prisfallet.
Mjölk
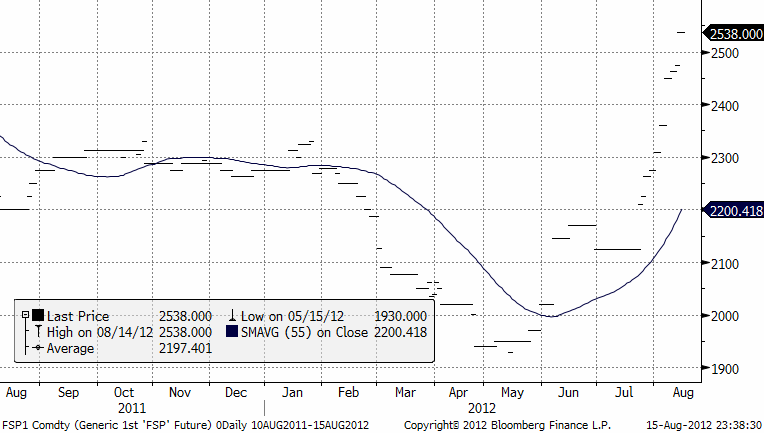
Priset på mjölkpulver i Nordeuropa har fortsatt att stiga ännu en vecka. Priset har ökat 4% från 2450 euro per ton till 2538.
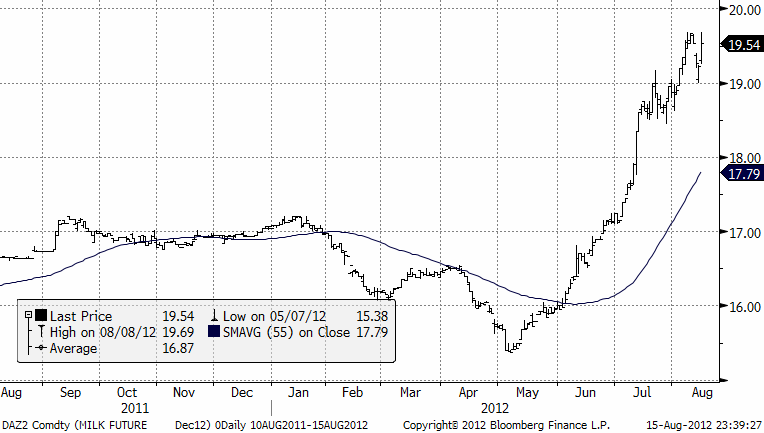
På den amerikanska börsen, har priset rört sig sidledes, liksom majsen och sojan. Trenden är dock uppåtriktad och 20 cent är en psykologiskt viktig ni pga att det är en så jämn siffra. Säkerligen ligger det en del ”take profit” / prissäkringsordrar där.
Socker
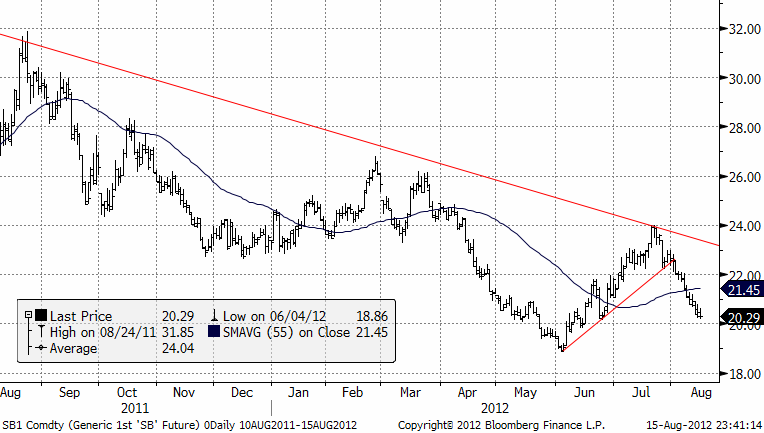
Priset på socker har, såsom vi har förutspått, fortsatt att sjunka. 20 cent är en psykologiskt viktig nivå. Möjligen kan det komma en rekyl på den nivån, men trenden på lite längre sikt är nedåtriktad.
[box]SEB Veckobrev Jordbruksprodukter är producerat av SEB Merchant Banking och publiceras i samarbete och med tillstånd på Råvarumarknaden.se[/box]
Disclaimer
The information in this document has been compiled by SEB Merchant Banking, a division within Skandinaviska Enskilda Banken AB (publ) (“SEB”).
Opinions contained in this report represent the bank’s present opinion only and are subject to change without notice. All information contained in this report has been compiled in good faith from sources believed to be reliable. However, no representation or warranty, expressed or implied, is made with respect to the completeness or accuracy of its contents and the information is not to be relied upon as authoritative. Anyone considering taking actions based upon the content of this document is urged to base his or her investment decisions upon such investigations as he or she deems necessary. This document is being provided as information only, and no specific actions are being solicited as a result of it; to the extent permitted by law, no liability whatsoever is accepted for any direct or consequential loss arising from use of this document or its contents.
About SEB
SEB is a public company incorporated in Stockholm, Sweden, with limited liability. It is a participant at major Nordic and other European Regulated Markets and Multilateral Trading Facilities (as well as some non-European equivalent markets) for trading in financial instruments, such as markets operated by NASDAQ OMX, NYSE Euronext, London Stock Exchange, Deutsche Börse, Swiss Exchanges, Turquoise and Chi-X. SEB is authorized and regulated by Finansinspektionen in Sweden; it is authorized and subject to limited regulation by the Financial Services Authority for the conduct of designated investment business in the UK, and is subject to the provisions of relevant regulators in all other jurisdictions where SEB conducts operations. SEB Merchant Banking. All rights reserved.

Market is starting to take US/Iran headlines with a pinch of salt. Brent crude rose $2.8/b yesterday to an official close of $112.1/b. But after that it traded as low as $108.05/b before ending late night at around $109.7/b. Through the day it traded in a range of $106.87 – 112.72/b amid a flurry of news or rumors from Iran and the US. ”US temporary sanctions during negotiations” (falls alarm). ”We will bomb Iran” (not anyhow),… etc. While the market is still fluctuating to this kind of news flow, it is starting to take such headlines with a pinch of salt.

We’ll see. Maybe, maybe not. The Brent M1 contract is trading at $110.2/b this morning which very close to the average ticks through yesterday of $110.4/b.
Trump with bearish, verbal intervention whenever Brent trades above $110/b it seems. What seems to be a pattern is that Trump states something like ”very good negotiations going on with Iran”, ”New leaders in Iran are great,..”, ”Great progress in negotiations,…”, ”Deal in sight,..” etc whenever the Brent M1 contract trades above $110/b. An effort to cool the market. These hot air verbal interventions from Trump used to have a heavy bearish impact on prices, but they now seems to have less and less effect unless they are backed by reality.
As far as we can see there has been no real progress in the negotiations between the US and Iran with both sides still standing by their previous demands.
Iran is getting stronger while the cease fire lasts making a return to war for Trump yet harder. Iran is naturally in constant preparation for a return to war given Trump’s steady threats of bombing Iran again. Iran is naturally doing what ever is possible to prepare for a return to war. And every day the cease fire lasts it is better prepared. This naturally makes it more and more difficult and dangerous for the US to return to warring activity versus Iran as the consequences for energy infrastructure in the Persian Gulf will be more and more severe the longer the cease fire lasts. Israel seems to see it this way as well. That the war is not won and that current frozen state of a cease fire gives Iran opportunity to rebuild military and politically.
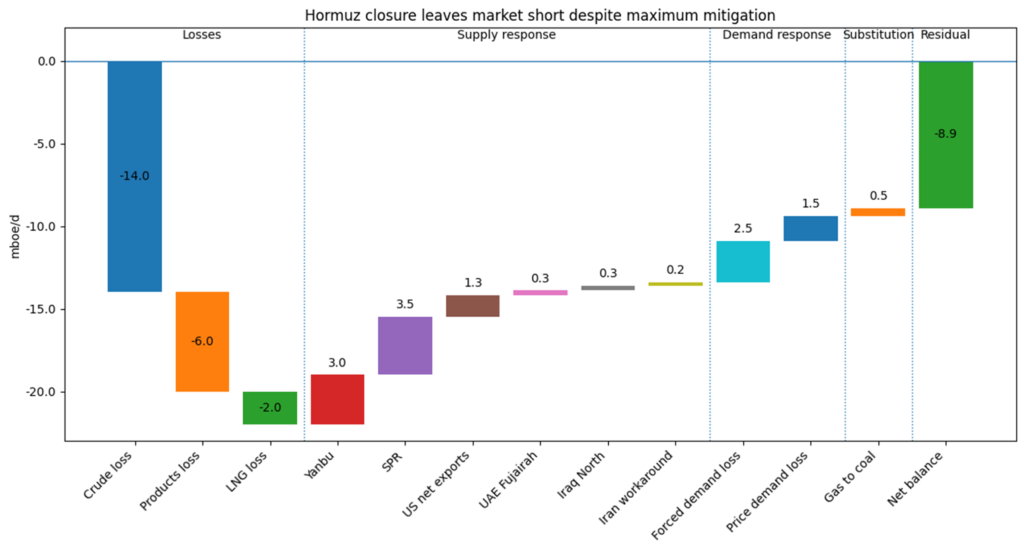
Global inventories are drawing down day by day. How much? In the meantime the Strait of Hormuz stays closed. There is varying measures and estimates of how much global inventories are drawing down. Our rough estimate, back of the envelope, is that global inventories are drawing down by at least some 10 mb/d or about 300 mb/d in a balance between loss of supply versus demand destruction. Other estimates we see are a monthly draw of 250-270 mb/d. The IEA only ’measured’ a draw in global observable stocks of 117 mb in April with oil on water rising 53 mb while on shore stocks fell 170 mb. But global stocks are hard to measure with large invisible, unmeasured stocks. As such a back of the envelope approach may be better.
Oil products is what the world is consuming. Oil product prices likely to rise while product stocks fall. Strategic Petroleum Reserves (SPR) are predominantly crude oil. Discharging oil from OECD SPR stocks, a sharp reduction in Chinese crude imports and a reduction in global refinery throughput of 6-7 mb/d has helped to keep crude oil markets satisfactorily supplied. But global inventories are drawing down none the less. And oil products is really what the world is consuming. So if global refinery throughput stays subdued, then demand will eventually have to match the supply of oil products. The likely path forward this summer is a steady draw down in jet fuel, diesel and gasoline. Higher prices for these. Then, if possible, higher refinery throughput and higher usage of crude in response to very profitable refinery margins. And lastly sharper draw in crude stocks and higher prices for these. But some 6 mb/d of oil products used to be exported through the Strait of Hormuz. And it may not be so easy to ramp up refinery activity across the world to compensate. Especially as Ukraine continues to damage Russian refineries as well as Russian crude production and export facilities.
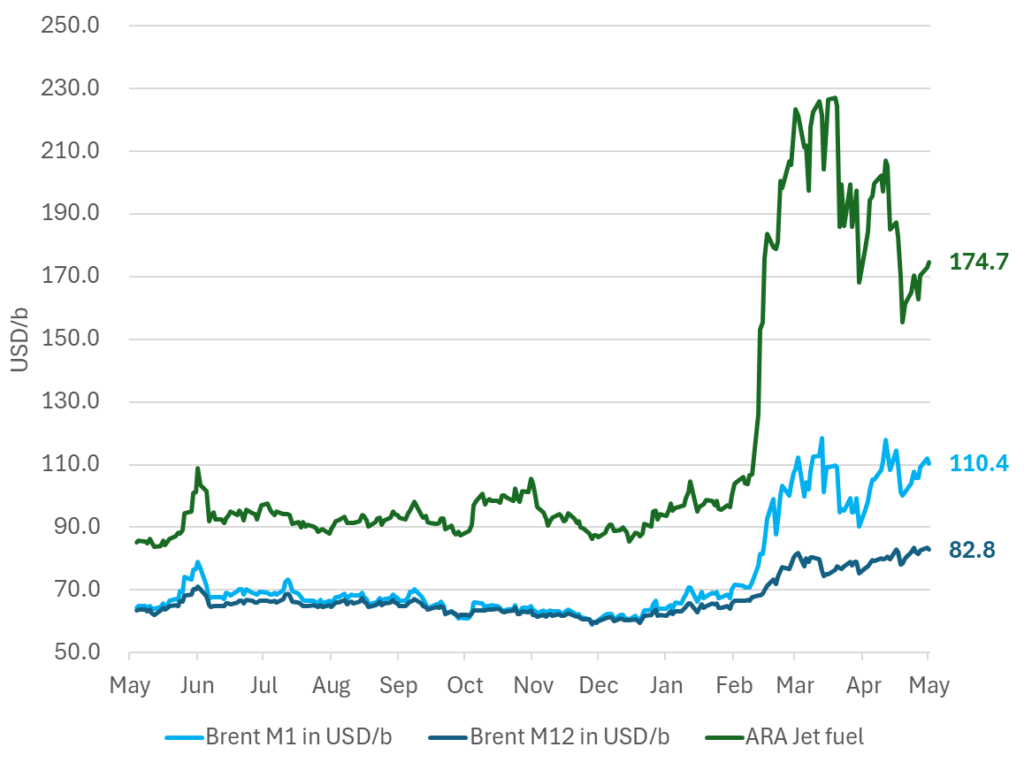
Watch oil product stocks and prices as well as Brent calendar 2027. What to watch for this summer is thus oil product inventories falling and oil product premiums to crude rising. Another measure to watch is the Brent crude 2027 contract as it rises steadily day by day as the Strait of Hormuz stays closed and global oil inventories decline. The latter is close to the highest level since the start of the war and keeps rising.
The Brent M1 contract and the Brent 2027 prices and current price of jet fuel in Europe (ARA). All in USD/b
Our back of the envelope calculation of the global shortage created by the closure of the Strait of Hormuz. Note that 3.5 mb/d of discharge from SPR is also a draw. Note also that ’Forced demand loss’ of 2.5 mb/d is probably temporary and will fall back towards zero as logistics are sorted out leaving ’Price demand loss’ to do the job of balancing the market. Thus a shortfall of at least 9 mb/d created by the closure. More if SPR discharge is included and more if Forced demand loss recedes.
Brent is climbing higher. Front-month is at USD 106.3/bl this morning, close to a weekly high and a USD 9/bl jump from Mondays open. This is the move we flagged as a risk earlier in the week: the market shifting from ”a deal is around the corner” to ”this is going to take longer than we thought”.

Analyst Commodities, SEB
During April, rest-of-year Brent remained remarkably stable around USD 90/bl. A stability which rested on one single assumption: the SoH reopens around 1 May. That assumption is now slowly falling apart.
As we highlighted yesterday: every week of delay beyond 1 May adds (theoretically) ish USD 5/bl to the rest-of-year average, as global inventories draw 100 million barrels per week. i.e., a mid-May reopening implies rest-of-year Brent closer to USD 100/bl, and anything pushing into June or July takes us meaningfully higher.
What’s changed in the last 48 hours:
#1: The US military has formally warned that clearing suspected sea mines from SoH could take up to six months. That is a completely different timescale from what the financial market is pricing. Even a political deal tomorrow does not immediately reopen the strait.
#2: Trump has shifted his tone from urgency to ”strategic patience”. In yesterday’s press conference: ”Don’t rush me… I want a great deal.” The market is reading this as a president no longer feeling pressured by timelines, with the naval blockade running in the background.
#3: So far, the military activity is escalating, not de-escalating. Axios reports Iran is laying more mines in SoH. The US 3rd carrier strike group (USS George H.W. Bush) is arriving with two countermine vessels. Trump yesterday ordered the US Navy to destroy any Iranian boats caught laying mines. While CNN reports that the Pentagon is actively drawing up plans to strike Iranian SoH capabilities and individual Iranian military leaders if the ceasefire collapses. i.e., NOT a attitude consistent with an imminent deal!
Spot crude and product prices eased off the early-April highs on a combination of system rerouting and deal optimism. Both now weakening. Goldman estimates April Gulf output is reduced by 14.5 mbl/d, or 57% of pre-war supply, a number that keeps getting worse the longer this drags on.
Demand-side adaptation is ongoing: S. Korea has cut its Middle East crude dependence from 69% to 56% by pulling more from the Americas and Africa, and Japan is kicking off a second round of SPR releases from 1 May. But SPRs are finite.
Ref. to the negotiations, we should not bet on speed. The current Iranian leadership is dominated by genuine hardliners willing to absorb economic pain and run the clock to extract concessions. That is not a setup for a rapid resolution. US/Israeli media briefings keep framing the delay as ”internal Iranian divisions”, the reality is more complicated and points toward weeks and months, not days.
Our point is that the complexity is large, and higher prices have only just started (given a scenario where the negotiations drag out in time). The market spent April leaning on the USD 90/bl rest-of-year assumption; that case is diminishing by the hour. If ”early May reopening” is replaced by ”June, July or later” over the next week or two, both crude and products have meaningful room to reprice higher from here. There is a high risk being short energy and betting on any immediate political resolution(!).
Down on Friday. Up on Monday. The Brent June crude oil contract traded down 5.1% last week to a close of $90.38/b. It reached a high of $103.87/b last Monday and a low of $86.09/b on Friday as Iran announced that the Strait of Hormuz was fully open for transit. That quickly changed over the weekend as the US upheld its blockade of Iranian oil exports while Iran naturally responded by closing the SoH again. The US blew a hole in the engine room of the Iranian ship TOUSKA and took custody of the ship on Sunday. Brent crude is up 5.6% this morning to $95.4/b.
The cease-fire is expiring tomorrow. The US has said it will send a delegation for a second round of negotiations in Islamabad in Pakistan. But Iran has for now rejected a second round of talks as it views US demands as unrealistic and excessive while the US is also blocking the Strait of Hormuz.
While Brent is up 5% this morning, the financial market is still very optimistic that progress will be made. That talks will continue and that the SoH will fully open by the start of May which is consistent with a rest-of-year average Brent crude oil price of around $90/b with the market now trading that balance at around $88/b.
Financial optimism vs. physical deterioration. We have a divergence where the financial market is trading negotiations, improvements and resolution while at the same time the physical market is deteriorating day by day. Physical oil flows remain constrained by disrupted flows, longer voyage times and elevated freight and insurance costs.
Financial markets are betting that a US/Iranian resolution will save us in time from violent shortages down the road. But every day that the SoH remains closed is bringing us closer to a potentially very painful point of shortages and much higher prices.
The US blockade is also a weapon of leverage against its European and Asian allies. When Iran closed the SoH it held the world economy as a hostage against the US. The US blockade of the SoH is of course blocking Iranian oil exports. But it is also an action of disruption directed towards Europe and Asia. The US has called for the rest of the world to engaged in the war with Iran: ”If you want oil from the Persian Gulf, then go and get it”. A risk is that the US plays brinkmanship with the global oil market directed towards its European and Asian allies and maybe even towards China to force them to engage and take part. Maybe unthinkable. But unthinkable has become the norm with Trump in the White House.




Sommarväder skapar prisrally på elbörsen
Oil product price pain is set to rise as the Strait of Hormuz stays closed into summer

Solkraften pressar elpriserna dagtid

Michel Gubel ger sin syn på oljemarknaden