

Analys
Market likely to rewrite all Brent crude forecasts for 2018

 Exactly two weeks ago we argued that Brent crude would probably reach $65/b before Christmas. And wow has that delivered quicker than we thought. Of course yesterday’s 3.5% jump to $54.27/b (intraday high of $54.44/b) did come on the back of the political events in Saudi Arabia. Princes, billionaires and ministers were arrested and accused of corruption while the real reason of course was to secure the way to the throne for Prince Mohammed Bin Salman (MBS). In our view the events in Saudi Arabia this weekend were merely a catalyst which drove the oil price higher and more quickly than expected. In general we see little reason to be concerned for the supply of Saudi Arabia’s production. That was probably also the main view by European traders yesterday as Brent crude traded only marginally up in the European season (aligned with some positive moves in metals) before US traders came into the market and kicked it higher.
What is really at the heart of why we think everyone now will revise their Brent crude forecasts for 2018 is the realisation that the Brent crude 1 month contract, the Brent “spot price”, is not really what the US shale oil players are getting for their crude oil. Whatever unhedged oil the US shale oil players currently are producing they will only get $57.3/b or the WTI 1 month price. And they won’t even get that as there is a transportation cost from the well-head to Cushing Oklahoma as a discount to that as well.
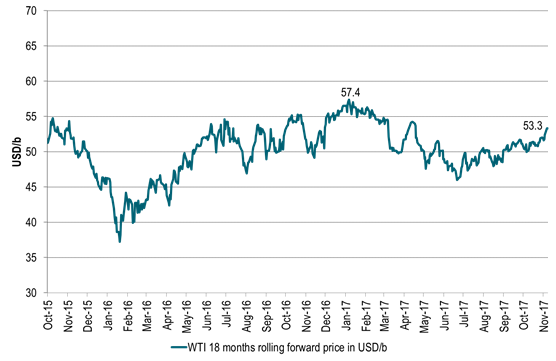
More importantly is what’s dictating shale oil players’ profitability for new investments, new drilling and additional wells. That is not the front month WTI price but the 1.5 year forward WTI price (the WTI 18 month contract) at which they can hedge new investments. And that price yesterday closed at only $53.3/bl. I.e. for new investments US shale oil players are only offered $53.3/bl for delivery at Cushing Oklahoma which is far away from the current Brent 1mth price of $64/b.
The WTI 18 mth contract traded as high as $57.4/b earlier in the year. So while the Brent 1mth price is rising to new highs of the year and highest since 2015, the WTI 18mth contract is still 3 dollar lower than its high this year and not at all giving a strong stimulating investment push for shale oil producers.
This is clearly a dream come true for OPEC. That they can have a high Brent 1mth price close to $65/b while at the same time not giving a strong price stimulus to US shale oil producers as they are only offered $53.3/bl on the curve. Yes, Christmas did indeed come early for OPEC this year! Then of course the question is whether Christmas will last all of 2018 or not. So what is at the heart of this Christmas present?
It is two-fold.
One is the increasing Brent crude oil backwardation with the Brent 1mth contract trading at a $5.1/bl premium to the the Brent 18mth contract. This comes partly as a result of the constant draw down in global crude oil inventories and partly due to the increasing net long Brent speculative positioning. And yes there is a relationship between backwardation and speculative length. When net length is increasing the backwardation is increasing.
At the moment net long Brent is at an all-time high. That will of course not last for ever. So in the next market turn when specs pull out the level of backwardation will soften somewhat as well. However, assume that OPEC+ will “hold” the market all through 2018 so that inventories continue yet lower. Not necessarily steeply lower but at least ticking lower. Then the Brent crude oil backwardation should not fall back to zero. Rather it should hold up at some level and then strengthen with declining stocks. In perspective the Brent 1 to 18 mth backwardation time spread traded around $7/b from mid-2011 to mid-2014 when Brent crude traded around $110/b. So the $5/b backwardation may be a bit rich as we are not quite back to a 2011-2014 situation quite yet.
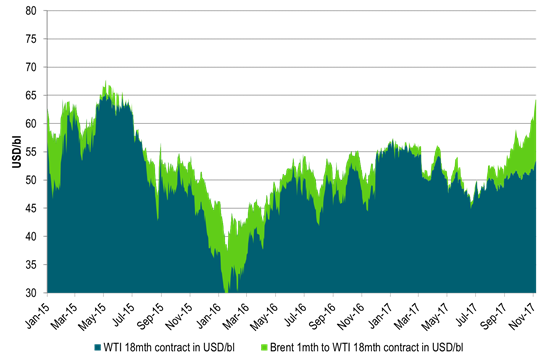
The second and more important one is the increasing Brent to WTI spread we have witnessed this year. And it is not just in the front of the curves where the spread has widened out. It has happened all along the curve. In January the Brent 18mth to WTI 18 mth spread only traded at $1/b while it now trades at close to $6/bl.
When we look at global oil inventories they have been drawing down relentlessly since mid-March this year. In the US we have seen that oil product stocks have drawn down to normal with middle distillate stocks there down to below now ahead of winter. US crude stocks have however been a much more tedious and slow draw down as they in total still stand more than 100 mbl above a fair normal. However, if we split out the US mid-Continent which contains Cushing Oklahoma stocks where the WTI crude is priced we see that non-mid-Continent US crude stocks have been drawn down rapidly. The mid-Continent stocks however are actually now higher than a year ago and rising. And since this is where the WTI crude is priced it is holding down the WTI price.
The WTI crude curve is actually still in contango at the front end of the curve due to this. And since stocks in the mid-Continent are rising higher there is an increasing risk that the WTI crude price might break down into deeper front end contango and an even wider Brent to WTI spread and thus a lower WTI 1mth price.
We are thus likely going to witness a yet widening divergence between Brent and WTI crude oil price. Especially in the front. That is also why the net long speculative positions in WTI is not at an all-time-high as is the case with Brent positions. And those with a long position in WTI are at risk for a break-down in the WTI prices as the mid-Continent stocks continues to rise.
A key question for us at the moment (which we are unable to answer) is whether the rising crude stocks in the US mid-Continent now is due to natural bottlenecks due to lack of pipeline investments or whether it is due to damaged infrastructure following the Hurricane Harvey.
If it is the first then the bottleneck is probably of a lasting character. Then US shale producers have probably reached the short/medium term transportation capacity of getting their oil to the market. It will of course not last for ever as there is always possible to lay more pipes, but it takes time. In that case the Brent crude oil price can continue to rally without having to worry too much because the WTI price which then is stuck in surplus in the mid-US Continent. Then there is no point for US shale oil producers to increase production as they cannot easily get it to market. And the subdued WTI price will be the one telling them not to invest more and not to produce more since it will be low due to high mid-Continent stocks.
If the rising mid-Continental stocks are due to Hurricane Harvey damages then it might be quicker to mend. Then the Brent to WTI spread should contract from current levels once the Harvey damage is mended.
Looking at the US mid-Continent stocks we see that they started to rise at the end of August which was right at the time of Hurricane Harvey and has gone up by some 10 mbl since then. However, this might not be a good indication that Harvey is the culprit as inventories normally rise some 4 mbl during this period anyhow.
We are not quite sure whether it is Hurricane Harvey damage which drives US mid-Continental stocks higher or whether it is structural under investments in pipelines. However, as US shale oil production continues to rise (as we think it will in 2018) the pressure in terms of utilization of US oil pipeline transportation capacities will be increasingly taxed which is likely to hold the Brent – WTI price spread high.
So Brent crude oil price forecasts for 2018 are likely going to be revised up across the board as they now are likely to incorporate a more substantial Brent – WTI 1mth price spread for 2018. Current Brent crude 2018 Bloomberg consensus forecast currently stand at $56/bl with market pricing at $62/bl while SEB’s standing forecast from September is $55/bl.
The fundamental assumption for most forecasting methodologies is still that US shale oil is on the margin. For a long time the assumption has been that US shale oil can deliver almost unlimited at WTI $50/b. That assumption is now breaking down. US shale oil producers have not made money this year with investors now DEMANDING that they deliver profits and not just promises. While it is difficult to say exactly at what level they will create profits it is natural to shift the shale oil base floor price assumption from $50/bl to $55/bl. I.e. assuming that US shale oil production is not going through the roof with a WTI 18 mth price at $55/b. I.e. the WTI price is allowed to trade at $55/bl both in spot and on the curve without creating surplus havoc in the global market.
We thus expect revisions of Brent crude oil forecasts to assume a WTI 1mth crude price delivered at around $55/bl next year and then with a Brent 1mth to WTI 1mth price spread to Brent on top of some $5-7/bl thus placing Brent forecasts for 2018 at around $60-62/bl. Such assumptions are likely to affect our own Brent crude oil forecast for 2018 when we revise it in February next year.
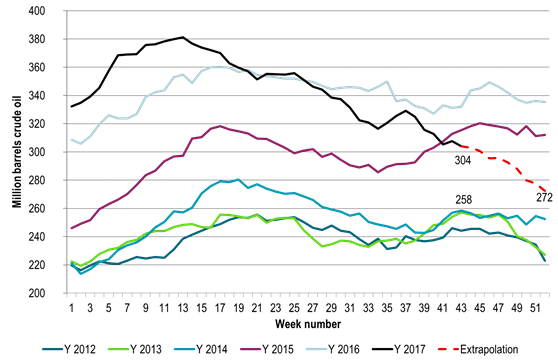
Ch1) US commercial crude oil stocks less the US mid-continent are drawing down rapidly
Getting close to normal by end of year
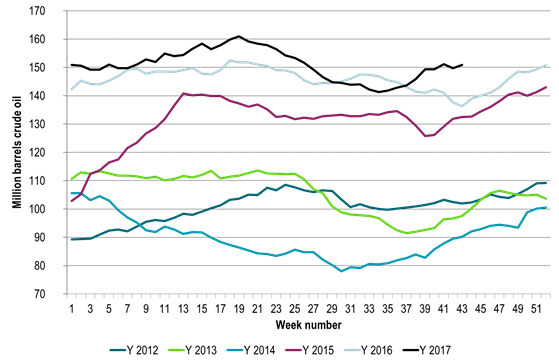
Ch2) US mid-Continent stocks (Pad2) have however rising and above last year.
This is where WTI crude is priced in Cushing Oklahoma and is why the WTI crude curve has front end contango with risk for deeper contango
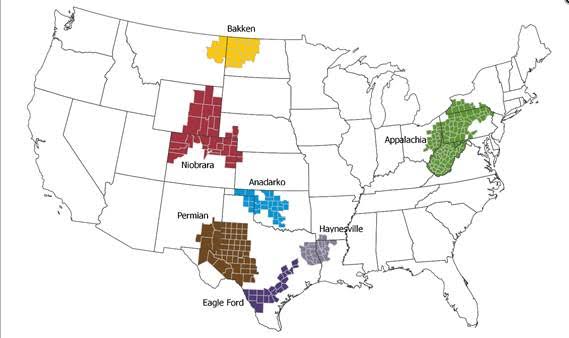
Ch3) US shale oil regions
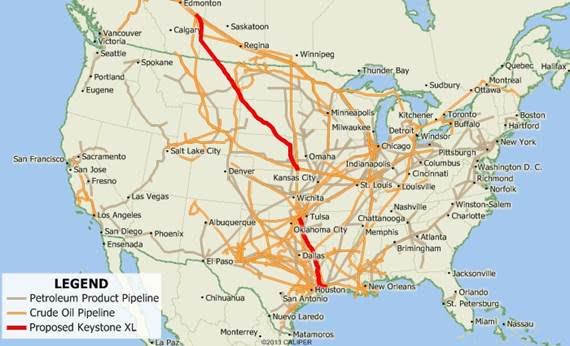
Ch4) Not all shale oil producers need to pass through Cushing Oklahoma
But the exact magnitude and location of bottlenecks getting shale oil to the U.S. Gulf we don’t know.
Looks like Eagle Ford and Permian have more options to bypass Cushing getting right to the US Gulf.
Are Eagle Ford and Permian producers actually getting a price closer to seaborne crude prices than to WTI?
Ch5) Brent and WTI crude curves moving higher over last two weeks
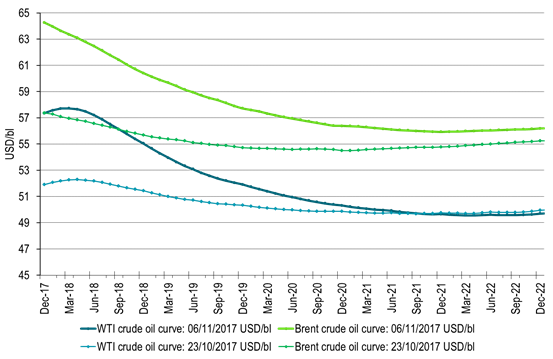
Ch6) Brent 1mth contract has rallied to close to $65/b.
Steepening Brent backwardation and widening Brent – WTI crude spreads has left the WTI 18 mth contract in the doldrums no higher than $53.3/b
Ch7) The WTI 18 mth forward price at $53.3/b still short of year high of $57.4/b
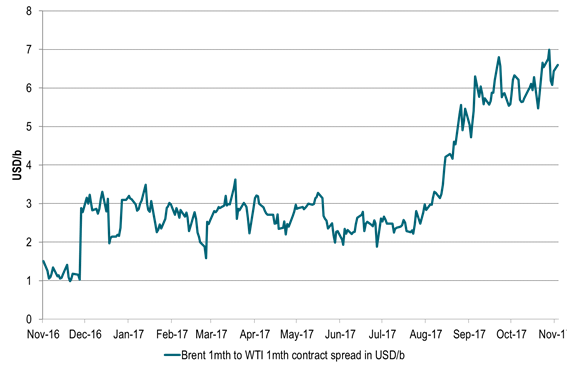
Ch8) Brent 1mth to WTI 1mth crude spread has blown out
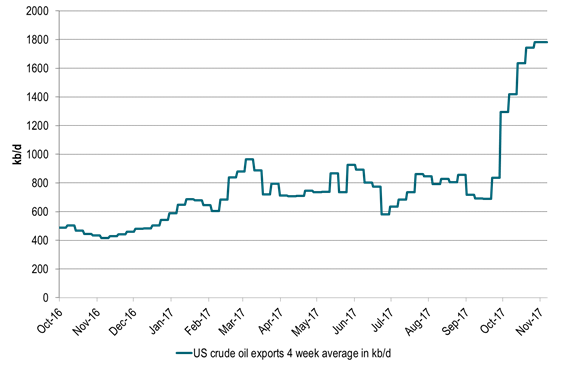
Ch9) And US crude oil is flushing out of the US as exports as a result of the strong widening in Brent to WTI
But as we see above it is not flowing out of the US mid-Continent where WTI is priced
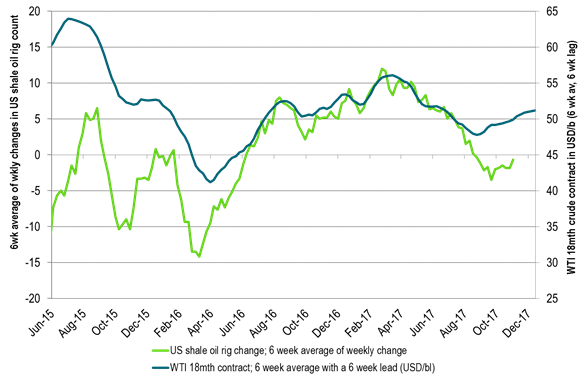
Ch10) US shale oil players are kicking drilling rigs out of the US at a WTI 18mth curve price of $50/bl
They can of course drill more but then they are begging a higher forward WTI price.
Risk for a smoke and mirror in these statistics as shale players are currently running some 100 drilling rigs more than they need.
They need to kick they out in order to align drilling with completions which still ran at a surplus in September as they drilled more than they completed.
We expect shale players to kick out 5-10 rigs every week to Christmas.
It will be sentiment bullish, but unlikely to impact completions all that much in 2018 as they have a load full of DUCs they can complete in 2018
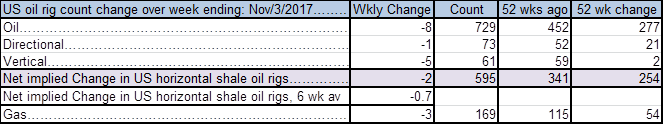
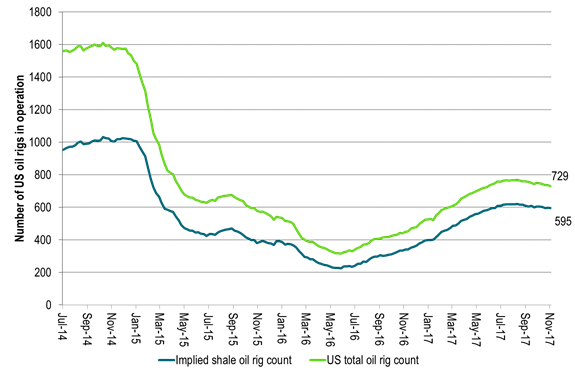
Ch11) US shale players kicking out rigs at a WTI18 curve price of $50/bl
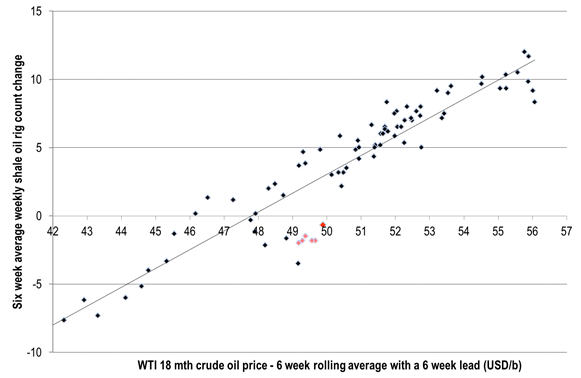
Ch12) Will shale players hold their horses as the mid-term WTI forward price moves higher?
Good reasons to believe that they will kick out more drilling rigs at WTI curve $50/b as investors demand profits
Kind regards
Bjarne Schieldrop
Chief analyst, Commodities
SEB Markets
Merchant Banking
Parts of the Brent crude curve dipping into the high $50ies/b. Brent crude fell 2.3% over the week to Friday. It closed the week at $61.29/b, a slight gain on the day, but also traded to a low of $60.14/b that same day and just barely avoided trading into the $50ies/b. This morning it is risk-on in equities which seems to help industrial metals a little higher. But no such luck for oil. It is down 0.8% at $60.8/b. This week looks set for Brent crude to dip its feet in the $50ies/b. The Brent 3mth contract actually traded into the high $50ies/b on Friday.

The front-end backwardation has been on a weakening foot and is now about to fully disappear. The lowest point of the crude oil curve has also moved steadily lower and lower and its discount to the 5yr contract is now $6.8/b. A solid contango. The Brent 3mth contract did actually dip into the $50ies/b intraday on Friday when it traded to a low point of $59.93/b.
More weakness to come as lots of oil at sea comes to ports. Mid-East OPEC countries have boosted exports along with lower post summer consumption and higher production. The result is highly visibly in oil at sea which increased by 17 mb to 1,311 mb over the week to Sunday. Up 185 mb since mid-August. On its way to discharge at a port somewhere over the coming month or two.
Don’t forget that the oil market path ahead is all down to OPEC+. Remember that what is playing out in the oil market now is all by design by OPEC+. The group has decided that the unwind of the voluntary cuts is what it wants to do. In a combination of meeting demand from consumers as well as taking back market share. But we need to remember that how this plays out going forward is all at the mercy of what OPEC+ decides to do. It will halt the unwinding at some point. It will revert to cuts instead of unwind at some point.
A few months with Brent at $55/b and 40-50 US shale oil rigs kicked out may be what is needed. We think OPEC+ needs to see the exit of another 40-50 drilling rigs in the US shale oil patches to set US shale oil production on a path to of a 1 mb/d year on year decline Dec-25 to Dec-26. We are not there yet. But a 2-3 months period with Brent crude averaging $55/b would probably do it.
Oil on water increased 17 mb over the week to Sunday while oil in transit increased by 23 mb. So less oil was standing still. More was moving.

Crude oil floating storage (stationary more than 7 days). Down 11 mb over week to Sunday

The lowest point of the Brent crude oil curve versus the 5yr contract. Weakest so far this year.

Crude oil 1mth to 3mth time-spreads. Dubai held out strongly through summer, but then that center of strength fell apart in late September and has been leading weakness in crude curves lower since then.

Rebounding along with most markets. But concerns over solidity of Gaza peace may also contribute. Brent crude fell 0.8% yesterday to $61.91/b and its lowest close since May this year. This morning it is bouncing up 0.9% to $62.5/b along with a softer USD amid positive sentiment with both equities and industrial metals moving higher. Concerns that the peace in Gaza may be less solid than what one might hope for also yields some support to Brent. Bets on tech stocks are rebounding, defying fears of trade war. Money moving back into markets. Gold continues upwards its strong trend and a softer dollar helps it higher today as well.
US crude & products probably rose 5.6 mb last week (API) versus a normal seasonal decline of 2.4 mb. The US API last night partial and thus indicative data for US oil inventories. Their data indicates that US crude stocks rose 7.4 mb last week, gasoline stocks rose 3.0 mb while Distillate stocks fell 4.8 mb. Altogether an increase in commercial crude and product stocks of 5.6 mb. Commercial US crude and product stocks normally decline by 2.4 mb this time of year. So seasonally adjusted the US inventories rose 8 mb last week according to the indicative numbers by the API. That is a lot. Also, the counter seasonal trend of rising stocks versus normally declining stocks this time of year looks on a solid pace of continuation. If the API is correct then total US crude and product stocks would stand 41 mb higher than one year ago and 6 mb higher than the 2015-19 average. And if we combine this with our knowledge of a sharp increase in production and exports by OPEC(+) and a large increase in oil at sea, then the current trend in US oil inventories looks set to continue. So higher stocks and lower crude oil prices until OPEC(+) switch to cuts. Actual US oil inventory data today at 18:00 CET.
US commercial crude and product stocks rising to 1293 mb in week 41 if last nights indicative numbers from API are correct.

Crude oil soon coming to a port near you. OPEC has lifted production sharply higher this autumn. At the same time demand for oil in the Middle-East has fallen as we have moved out of summer heat and crude oil burn for power for air-conditioning. The Middle-East oil producers have thus been able to lift exports higher on both accounts. Crude oil and condensates on water has shot up by 177 mb since mid-August. This oil is now on its way to ports around the world. And when they arrive, it will likely help to lift stocks onshore higher. That is probably when we will lose the last bit of front-end backwardation the the crude oil curves. That will help to drive the front-month Brent crude oil price down to the $60/b line and revisit the high $50ies/b. Then the eyes will be all back on OPEC+ when they meet in early November and then again in early December.
Crude oil and condensates at sea have moved straight up by 177 mb since mid-August as OPEC(+) has produced more, consumed less and exported more.

When it starts to move lower it moves rather quickly. Gaza, China, IEA. Brent crude is down 2.1% today to $62/b after having traded as high as $66.58/b last Thursday and above $70/b in late September. The sell-off follows the truce/peace in Gaze, a flareup in US-China trade and yet another bearish oil outlook from the IEA.
A lasting peace in Gaze could drive crude oil at sea to onshore stocks. A lasting peace in Gaza would probably calm down the Houthis and thus allow more normal shipments of crude oil to sail through the Suez Canal, the Red Sea and out through the Bab-el-Mandeb Strait. Crude oil at sea has risen from 48 mb in April to now 91 mb versus a pre-Covid normal of about 50-60 mb. The rise to 91 mb is probably the result of crude sailing around Africa to be shot to pieces by the Houthis. If sailings were to normalize through the Suez Canal, then it could free up some 40 mb in transit at sea moving onshore into stocks.
The US-China trade conflict is of course bearish for demand if it continues.
Bearish IEA yet again. Getting closer to 2026. Credibility rises. We expect OPEC to cut end of 2025. The bearish monthly report from the IEA is what it is, but the closer we get to 2026, the more likely the IEA is of being ball-park right in its outlook. In its monthly report today the IEA estimates that the need for crude oil from OPEC in 2026 will be 25.4 mb/d versus production by the group in September of 29.1 mb/d. The group thus needs to do some serious cutting at the end of 2025 if it wants to keep the market balanced and avoid inventories from skyrocketing. Given that IEA is correct that is. We do however expect OPEC to implement cuts to avoid a large increase in inventories in Q1-26. The group will probably revert to cuts either at its early December meeting when they discuss production for January or in early January when they discuss production for February. The oil price will likely head yet lower until the group reverts to cuts.
Dubai: The Mid-East anchor dragging crude oil lower. Surplus emerging in Mid-East pricing. Crude oil prices held surprisingly strong all through the summer. A sign and a key source of that strength came from the strength in the front-end backwardation of the Dubai crude oil curve. It held out strong from mid-June and all until late September with an average 1-3mth time-spread premium of $1.8/b from mid-June to end of September. The 1-3mth time-spreads for Brent and WTI however were in steady deterioration from late June while their flat prices probably were held up by the strength coming from the Persian Gulf. Then in late September the strength in the Dubai curve suddenly collapsed. Since the start of October it has been weaker than both the Brent and the WTI curves. The Dubai 1-3mth time-spread now only stands at $0.25/b. The Middle East is now exporting more as it is producing more and also consuming less following elevated summer crude burn for power (Aircon) etc.
The only bear-element missing is a sudden and solid rise in OECD stocks. The only thing that is missing for the bear-case everyone have been waiting for is a solid, visible rise in OECD stocks in general and US oil stocks specifically. So watch out for US API indications tomorrow and official US oil inventories on Thursday.
No sign of any kind of fire-sale of oil from Saudi Arabia yet. To what we can see, Saudi Arabia is not at all struggling to sell its oil. It only lowered its Official Selling Prices (OSPs) to Asia marginally for November. A surplus market + Saudi determination to sell its oil to the market would normally lead to a sharp lowering of Saudi OSPs to Asia. Not yet at least and not for November.
The 5yr contract close to fixed at $68/b. Of importance with respect to how far down oil can/will go. When the oil market moves into a surplus then the spot price starts to trade in a large discount to the 5yr contract. Typically $10-15/b below the 5yr contract on average in bear-years (2009, 2015, 2016, 2020). But the 5yr contract is usually pulled lower as well thus making this approach a moving target. But the 5yr contract price has now been rock solidly been pegged to $68/b since 2022. And in the 2022 bull-year (Brent spot average $99/b), the 5yr contract only went to $72/b on average. If we assume that the same goes for the downside and that 2026 is a bear-year then the 5yr goes to $64/b while the spot is trading at a $10-15/b discount to that. That would imply an average spot price next year of $49-54/b. But that is if OPEC doesn’t revert to cuts and instead keeps production flowing. We think OPEC(+) will trim/cut production as needed into 2026 to prevent a huge build-up in global oil stocks and a crash in prices. But for now we are still heading lower. Into the $50ies/b.


Australien och USA investerar 8,5 miljarder USD för försörjningskedja av kritiska mineraler
Brent crude set to dip its feet into the high $50ies/b this week

Vad guldets uppgång egentligen betyder för världen

Spotpriset på guld över 4300 USD och silver över 54 USD
Crude oil soon coming to a port near you

OPEC+ missar produktionsmål, stöder oljepriserna

Goldman Sachs höjer prognosen för guld, tror priset når 4900 USD

Ett samtal om guld, olja, fjärrvärme och förnybar energi

Blykalla och amerikanska Oklo inleder ett samarbete
Guld nära 4000 USD och silver 50 USD, därför kan de fortsätta stiga
-
 Nyheter4 veckor sedan
OPEC+ missar produktionsmål, stöder oljepriserna
-
 Nyheter2 veckor sedan
Goldman Sachs höjer prognosen för guld, tror priset når 4900 USD
-
 Nyheter4 veckor sedan
Ett samtal om guld, olja, fjärrvärme och förnybar energi
-
 Nyheter3 veckor sedan
Blykalla och amerikanska Oklo inleder ett samarbete
-
 Nyheter3 veckor sedan
Guld nära 4000 USD och silver 50 USD, därför kan de fortsätta stiga
-
Analys4 veckor sedan
Are Ukraine’s attacks on Russian energy infrastructure working?
-

 Nyheter4 veckor sedan
Guldpriset uppe på nya höjder, nu 3750 USD
-
Nyheter3 veckor sedan
Ett samtal om guld, olja, koppar och stål