

Analys
Det stora spannmålsrånet
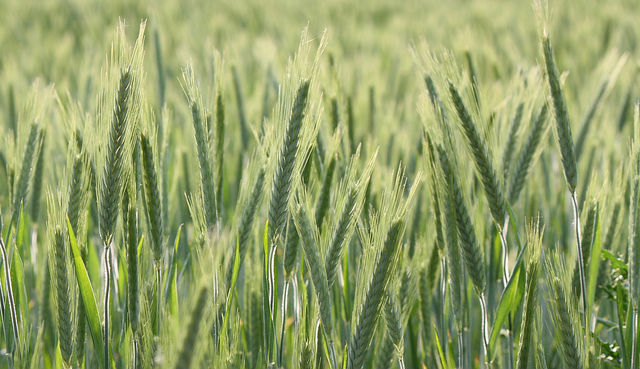
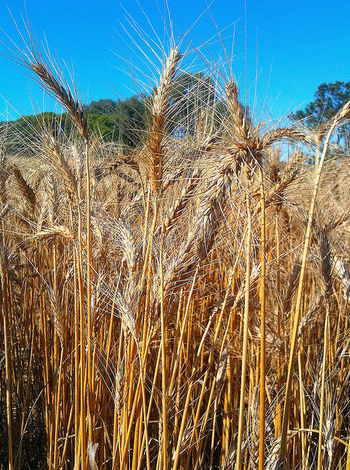
Det stora spannmålsrånet, eller The Great grain robbery, också känt som The Russian wheat deal, refererar till när det forna Sovjetunionen 1972 köpte betydande mängder spannmål, främst vete och majs men också sojabönor, av USA till låga priser. Orsaken till att Sovjetunionen köpte sådana mängder spannmål från USA berodde på att Sovjetunionen drabbats av en betydande torka som förstörde 20 procent av landets skördar.
 Egentligen hade Sovjetunionen börjat köpa amerikanskt spannmål redan innan, trots det kalla kriget som då rådde och gjorde att det i princip var omöjligt för amerikanska företag att handla med företag i Östeuropa.
De stora köpen kom under perioden juli och augusti 1972, när Sovjetunionen köpte 440 miljoner bushels vete, cirka 25 procent av USAs skörd det året, till ett pris om 700 MUSD. Från början var det endast tänkt att Sovjetunionen skulle köpa spannmål till ett värde om 150 MUSD, men i all tysthet signerade den amerikanska regeringen ett treårigt avtal med Sovjetunionen enligt vilket de styrande i det stora landet i öst förband sig att köpa stora mängder spannmål från USA.
Sovjetunionen gjorde sedan ytterligare köp från en rad olika spannmålshandlare. Sovjetunionen använde en kredit på 750 MUSD som landet hade fått från den amerikanska regeringen samt 500 MUSD av sin egen hårdvaluta för att köpa majs, vete och sojabönor. Sovjetunionen köpte när priserna var låga och i all tysthet, faktum är att det tog flera månader innan det kom ut att Sovjetunionen agerat så pass tungt på köpsidan. När detta väl läckte ut kom spannmålspriserna att explodera uppåt.
De högsta spannmålspriserna på 125 år
Händelsen ledde sedan till de högsta spannmålspriserna på 125 år i USA, en av de verkliga tjurmarknaderna som varade mellan 1972 och 1973. Under en femmånadersperiod 1973 handlades sojabönorna till 8 USD per bushel och noterade sedan en toppnotering på Chicago Board of Trade på 12,90 USD per bushel. Mindre än ett år tidigare hade sojabönorna handlats till 3,31 USD per bushel, en prisuppgång på 390 procent. Att priserna steg så pass kraftigt var inte enbart en effekt av Sovjetunionens köp, det sammanföll med en torka i Australien och av att Indien vid detta tillfälle kom att bli en stor aktör på de globala råvarubörserna, i detta fall som en stor köpare av spannmål.
Samtidigt kom ett antal av USAs spannmålsexportörer att göra stora vinster på denna affär, uppskattningsvis kunde de dela på 300 MUSD av de amerikanska skattebetalarnas pengar. Att händelsen kom att bli känd som The Great grain robbery är således inte så konstigt. Flera av dessa spannmålshandlare hade dessutom agerat som köpare, i syfte att hedga det spannmål de sålde till Sovjetunionen så hade de köpt vete, majs och sojabönor på råvarubörserna. När de sovjetiska spannmålsköpen blev allmän kännedom ledde det till att råvaruhandlarna gjorde enorma vinster. Det förekom också beskyllningar om att Sovjet hade köpt stora mängder terminskontrakt i syfte att göra vinster som skulle finansiera köpen av den fysiska spannmålen. Senare ledde detta till att en rad anklagelser om att insidertrading hade skett, men inga åtal väcktes och det gick inte att påvisa att det förekommit någon otillbörlig marknadspåverkan trots senatsförhör och liknande undersökningar. Det enda signifikanta resultatet av detta var att konsumenterna drabbades av högre priser på spannmålsprodukter.
Neil Sanders, Londonbaserad detaljhandelsanalytiker, sade att vetekrisen 1973 bidrog till att priset på en limpa bröd steg med 87 procent, från 10,1 pence, till 18,9 pence året efter. I slutet av 2011 låg priset på motsvarande limpa i England på 84 pence. Även andra livsmedel som till exempel pasta, foder och i förlängningen kyckling och kött kom också att påverkas, om än i mindre omfattning.
Vid FN:s mat och jordbruksorganisation, FAO, i Rom, säger ekonomen Abdolreza Abbassian att det är ländernas regeringar som skall ta skulden i de fall konsumenterna drabbas av spannmålskriserna. Han säger att världen blivit för fokuserad på vete från Svarta havs-regionen. Skördarna i detta område är emellertid mindre pålitliga än det spannmål som odlas i stabilare regioner som Kanada och USA. Enligt Abbassian måste det vidtas åtgärder för att mildra effekter av händelser som torka eller skyfall.
Ryska spioner avlyssnade råvaruhandlarnas telefoner
The Great grain robbery var en lysande insats som bland annat inbegrep den före detta spionorganisationen KGB som avlyssnade råvaruhandlarnas telefoner. Målet med detta var att de ryska spannmålshandlarna skulle kunna hitta de lägsta priserna och kunna köpa spannmålet där det var billigast utan att driva upp priset. På detta sätt kom Sovjet åt 300 MUSD av de amerikanska skattebetalarnas pengar i form av exportsubventioner, i en tid då den amerikanska regeringen var ute efter att lindra de kroniskt låga spannmålspriser genom att uppmuntra spannmålsexport.
Efterdyningar
The Great grain robbery var en av de ekonomiska händelser som kom att ändra världen för alltid. Det stora spannmålsrånet ledde till nya, stränga rapporteringsregler för de amerikanska råvaruhandlarna, regler som gäller än i dag. Det stora spannmålsrånet kom också att leda till en massiv ökning av råvarupriserna i allmänhet, och bidrog till att driva den amerikanska ekonomin till både recession och stagflation. Detta resulterade sedan i vad som kom att kallas för Reaganomics.
President Nixon införde ett exportförbud av sojabönor för att bromsa ytterligare prishöjningar på sojabönor. Detta partiella embargo ledde till kritik från utlandet eftersom det ledde till att amerikanska kontrakt upphävdes.
En bomullskris uppstod 1973 och 1974 där priset på bomull nästan fördubblats under en sexmånadersperiod. Ungefär 500 stämningar lämnades in avseende bomullskontrakt som hade baserats på lägre priser. Samtidigt steg priset på majs kraftigt. Matpriserna världen över steg med cirka 50 procent under de första sex månaderna av 1973. Livsmedelspriserna exploderade igen 1974.
U.S. General Accounting Office släppte en rapport i juli 1973 som säger att försäljningen hade misskötts och bidrog till att pressa upp livsmedelspriserna. Spannmålsförsäljningen ledde dessutom till att de amerikanska skattebetalarna tvingades till att betala onödiga subventioner. GAO sade att Ryssland borde ha betalat högre priser för det spannmål landet köpte vilket skulle ha minska subventionerna till spannmålsföretagen, och att jordbrukarna inte drog någon nytta av veteaffären, utan att det endast var de exporterande spannmålsföretagen som gjorde vinster på detta.
”The Big Grain Robbery” är ett perfekt exempel på vad som händer när utbud och efterfrågan kullkastas på spannmålsmarknaderna.
1987 kom Sovjetunionen tillbaka till spannmålsbörserna
1987 kom sedan Sovjetunionen tillbaka till de globala spannmålsmarknaderna och genomförde tillsammans med Reaganadministrationen en ny affär i amerikanskt vete. Sovjetunionen köpte då fyra miljoner ton motsvarande 147 miljoner bushels, av det amerikanska vetet. Detta vete motsvarade cirka åtta procent av det amerikanska veteöverskottet på 1,88 miljarder bushels vete.
Hur kunde detta ske?
Under hela det kalla kriget, hade de ryska bönderna utmaningar i form av det ryska klimatet och de tvivelaktiga sovjetiska jordbruksmetoderna, något som gjorde missväxt till ett regelbundet förekommande inslag i Sovjetunionen. Detta gjorde också förekomsten av sovjetiska spannmålshandlare på råvarumarknaderna till något vanligt förekommande. De sovjetiska spannmålshandlarna agerade då oftast som köpare eftersom den sovjetiska ledningen alltid haft svårt att tillhandahålla tillräckliga mängder baslivsmedel till sin befolkning.
Händelserna som kom att utmynna i det som kallades The Great grain robbery inträffade inom loppet av några veckor, och de amerikanska myndigheterna hade ingen aning, eller någon annan heller för den delen, att Sovjet hade drabbats av en akut livsmedelskris som en följd av situationen i landets jordbruksindustri. Det var inte heller allmänt känt att de sovjetiska spannmålshandlarna genomförde små, men tillsammans omfattande inköp av spannmål på råvarubörserna. Hur kunde detta hända? I dag finns det ett stort antal satelliter som cirkulerar runt jorden som fotograferar de områden där spannmål odlas, men på 1970-talet var det få råvaruhandlare som hade direktkontakt med de sovjetiska jordbrukarna. Den tidens satelliter kunde inte heller visa de skador som förorsakats av torka, insekter eller sjukdomar.


The latest weekly report from the US DOE showed a substantial drawdown across key petroleum categories, adding more upside potential to the fundamental picture.

Commercial crude inventories (excl. SPR) fell by 5.8 million barrels, bringing total inventories down to 415.1 million barrels. Now sitting 11% below the five-year seasonal norm and placed in the lowest 2015-2022 range (see picture below).
Product inventories also tightened further last week. Gasoline inventories declined by 2.1 million barrels, with reductions seen in both finished gasoline and blending components. Current gasoline levels are about 3% below the five-year average for this time of year.
Among products, the most notable move came in diesel, where inventories dropped by almost 4.1 million barrels, deepening the deficit to around 20% below seasonal norms – continuing to underscore the persistent supply tightness in diesel markets.
The only area of inventory growth was in propane/propylene, which posted a significant 5.1-million-barrel build and now stands 9% above the five-year average.
Total commercial petroleum inventories (crude plus refined products) declined by 4.2 million barrels on the week, reinforcing the overall tightening of US crude and products.


A classic case of “buy the rumor, sell the news” played out in oil markets, as Brent crude has dropped sharply – down nearly USD 10 per barrel since yesterday evening – following Iran’s retaliatory strike on a U.S. air base in Qatar. The immediate reaction was: “That was it?” The strike followed a carefully calibrated, non-escalatory playbook, avoiding direct threats to energy infrastructure or disruption of shipping through the Strait of Hormuz – thus calming worst-case fears.
After Monday morning’s sharp spike to USD 81.4 per barrel, triggered by the U.S. bombing of Iranian nuclear facilities, oil prices drifted sideways in anticipation of a potential Iranian response. That response came with advance warning and caused limited physical damage. Early this morning, both the U.S. President and Iranian state media announced a ceasefire, effectively placing a lid on the immediate conflict risk – at least for now.
As a result, Brent crude has now fallen by a total of USD 12 from Monday’s peak, currently trading around USD 69 per barrel.
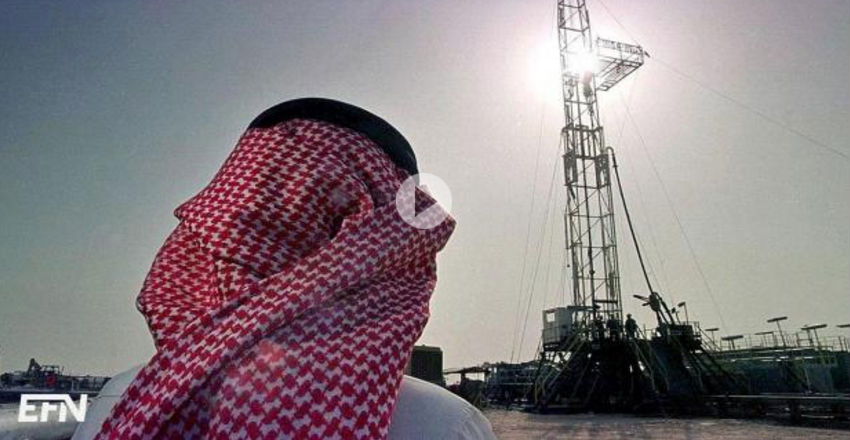
Looking beyond geopolitics, the market will now shift its focus to the upcoming OPEC+ meeting in early July. Saudi Arabia’s decision to increase output earlier this year – despite falling prices – has drawn renewed attention considering recent developments. Some suggest this was a response to U.S. pressure to offset potential Iranian supply losses.
However, consensus is that the move was driven more by internal OPEC+ dynamics. After years of curbing production to support prices, Riyadh had grown frustrated with quota-busting by several members (notably Kazakhstan). With Saudi Arabia cutting up to 2 million barrels per day – roughly 2% of global supply – returns were diminishing, and the risk of losing market share was rising. The production increase is widely seen as an effort to reassert leadership and restore discipline within the group.
That said, the FT recently stated that, the Saudis remain wary of past missteps. In 2018, Riyadh ramped up output at Trump’s request ahead of Iran sanctions, only to see prices collapse when the U.S. granted broad waivers – triggering oversupply. Officials have reportedly made it clear they don’t intend to repeat that mistake.
The recent visit by President Trump to Saudi Arabia, which included agreements on AI, defense, and nuclear cooperation, suggests a broader strategic alignment. This has fueled speculation about a quiet “pump-for-politics” deal behind recent production moves.
Looking ahead, oil prices have now retraced the entire rally sparked by the June 13 Israel–Iran escalation. This retreat provides more political and policy space for both the U.S. and Saudi Arabia. Specifically, it makes it easier for Riyadh to scale back its three recent production hikes of 411,000 barrels each, potentially returning to more moderate increases of 137,000 barrels for August and September.
In short: with no major loss of Iranian supply to the market, OPEC+ – led by Saudi Arabia – no longer needs to compensate for a disruption that hasn’t materialized, especially not to please the U.S. at the cost of its own market strategy. As the Saudis themselves have signaled, they are unlikely to repeat previous mistakes.
Conclusion: With Brent now in the high USD 60s, buying oil looks fundamentally justified. The geopolitical premium has deflated, but tensions between Israel and Iran remain unresolved – and the risk of missteps and renewed escalation still lingers. In fact, even this morning, reports have emerged of renewed missile fire despite the declared “truce.” The path forward may be calmer – but it is far from stable.
Analys
A muted price reaction. Market looks relaxed, but it is still on edge waiting for what Iran will do
Brent crossed the 80-line this morning but quickly fell back assigning limited probability for Iran choosing to close the Strait of Hormuz. Brent traded in a range of USD 70.56 – 79.04/b last week as the market fluctuated between ”Iran wants a deal” and ”US is about to attack Iran”. At the end of the week though, Donald Trump managed to convince markets (and probably also Iran) that he would make a decision within two weeks. I.e. no imminent attack. Previously when when he has talked about ”making a decision within two weeks” he has often ended up doing nothing in the end. The oil market relaxed as a result and the week ended at USD 77.01/b which is just USD 6/b above the year to date average of USD 71/b.

Brent jumped to USD 81.4/b this morning, the highest since mid-January, but then quickly fell back to a current price of USD 78.2/b which is only up 1.5% versus the close on Friday. As such the market is pricing a fairly low probability that Iran will actually close the Strait of Hormuz. Probably because it will hurt Iranian oil exports as well as the global oil market.
It was however all smoke and mirrors. Deception. The US attacked Iran on Saturday. The attack involved 125 warplanes, submarines and surface warships and 14 bunker buster bombs were dropped on Iranian nuclear sites including Fordow, Natanz and Isfahan. In response the Iranian Parliament voted in support of closing the Strait of Hormuz where some 17 mb of crude and products is transported to the global market every day plus significant volumes of LNG. This is however merely an advise to the Supreme leader Ayatollah Ali Khamenei and the Supreme National Security Council which sits with the final and actual decision.
No supply of oil is lost yet. It is about the risk of Iran closing the Strait of Hormuz or not. So far not a single drop of oil supply has been lost to the global market. The price at the moment is all about the assessed risk of loss of supply. Will Iran choose to choke of the Strait of Hormuz or not? That is the big question. It would be painful for US consumers, for Donald Trump’s voter base, for the global economy but also for Iran and its population which relies on oil exports and income from selling oil out of that Strait as well. As such it is not a no-brainer choice for Iran to close the Strait for oil exports. And looking at the il price this morning it is clear that the oil market doesn’t assign a very high probability of it happening. It is however probably well within the capability of Iran to close the Strait off with rockets, mines, air-drones and possibly sea-drones. Just look at how Ukraine has been able to control and damage the Russian Black Sea fleet.
What to do about the highly enriched uranium which has gone missing? While the US and Israel can celebrate their destruction of Iranian nuclear facilities they are also scratching their heads over what to do with the lost Iranian nuclear material. Iran had 408 kg of highly enriched uranium (IAEA). Almost weapons grade. Enough for some 10 nuclear warheads. It seems to have been transported out of Fordow before the attack this weekend.
The market is still on edge. USD 80-something/b seems sensible while we wait. The oil market reaction to this weekend’s events is very muted so far. The market is still on edge awaiting what Iran will do. Because Iran will do something. But what and when? An oil price of 80-something seems like a sensible level until something do happen.


Eurobattery Minerals förvärvar majoritet i spansk volframgruva

USA ska införa 50 procent tull på koppar

Ryska staten siktar på att konfiskera en av landets största guldproducenter

Hur säkrar vi Sveriges tillgång till kritiska metaller och mineral i en ny geopolitisk verklighet?

Lundin Mining ska bli en av de tio största kopparproducenterna i världen

Mahvie Minerals växlar spår – satsar fullt ut på guld

Uppgången i oljepriset planade ut under helgen

Låga elpriser i sommar – men mellersta Sverige får en ökning
A muted price reaction. Market looks relaxed, but it is still on edge waiting for what Iran will do

Jonas Lindvall är tillbaka med ett nytt oljebolag, Perthro, som ska börsnoteras
-
 Nyheter3 veckor sedan
Mahvie Minerals växlar spår – satsar fullt ut på guld
-
 Nyheter4 veckor sedan
Uppgången i oljepriset planade ut under helgen
-
 Nyheter4 veckor sedan
Låga elpriser i sommar – men mellersta Sverige får en ökning
-
Analys3 veckor sedan
A muted price reaction. Market looks relaxed, but it is still on edge waiting for what Iran will do
-
 Nyheter3 veckor sedan
Jonas Lindvall är tillbaka med ett nytt oljebolag, Perthro, som ska börsnoteras
-

 Nyheter3 veckor sedan
Oljan, guldet och marknadens oroande tystnad
-
Analys4 veckor sedan
Very relaxed at USD 75/b. Risk barometer will likely fluctuate to higher levels with Brent into the 80ies or higher coming 2-3 weeks
-

 Nyheter3 veckor sedan
Domstolen ger klartecken till Lappland Guldprospektering