

Nyheter
What’s behind the shrinking difference in crude oil prices?
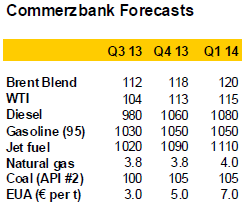
 The price spread between Brent and WTI has recently shrunk to its lowest level since the beginning of 2011. This is mainly due to the disproportionate fall in the Brent oil price. WTI, on the other hand, has benefited from growing US rail transport capacity and resulting arbitrage opportunities. These have now reached their limit, in view of rail transport costs. With the commissioning of new US pipeline capacity, the narrowing of the price difference is likely to continue in the second half of the year.
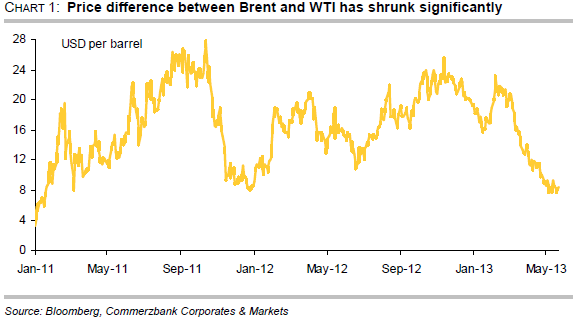
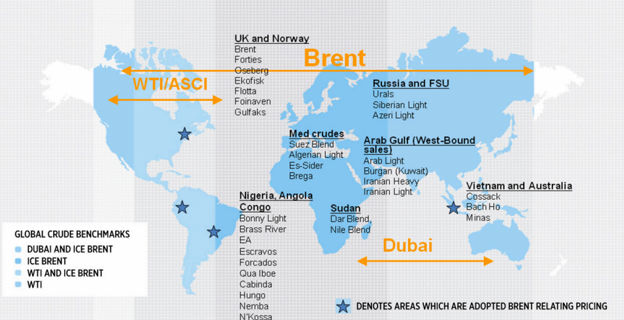
 One of the most remarkable and surprising developments in the oil market this year is the rapid narrowing of the price differential between Brent and WTI. At the beginning of March, the spread between the prices of the two most important oil types was more than 20 USD per barrel. Since then it has shrunk temporarily to less than 8 USD, the smallest it has been since January 2011 (chart 1). The spread tightening since early March is largely due to the weakness of the Brent price. Since the beginning of the year, Brent has fallen by around 8%. Besides the general weakness of industrial commodities – the LME base metals index has fallen by around 7% over the same period – Brent-specific factors have also been at work. For example, the North Sea oil supply has normalised in recent months. After months of production-related delivery delays, spring actually saw an oversupply of Brent. Another contributory factor was the fall in demand for North Sea oil after South Korea closed a tax loophole at the beginning of April. This had favoured the purchase of North Sea oil by South Korean customers after a free trade agreement was signed with the EU starting in July 2011. Furthermore, Brent increasingly has to compete for customers in the Asia-Pacific region with similar-quality crude oil from West Africa. The USA is importing far less oil from West Africa due to rising domestic production of (shale) oil.
However, the narrowing is also due to the WTI price. Against the general trend of falling commodity prices, WTI has risen by 2% since the beginning of the year. This is remarkable given that US crude oil stocks rose to an all-time high in May and US oil production reached a 21-year high in the same month. However, newly built transport capacity has made it possible to drain the oversupply in the US Midwest to other parts of the country more quickly. As a result, stockpiles in Cushing – the storage and delivery point for WTI – fell slightly up to the beginning of May.
Railway improves the availability of shale oil
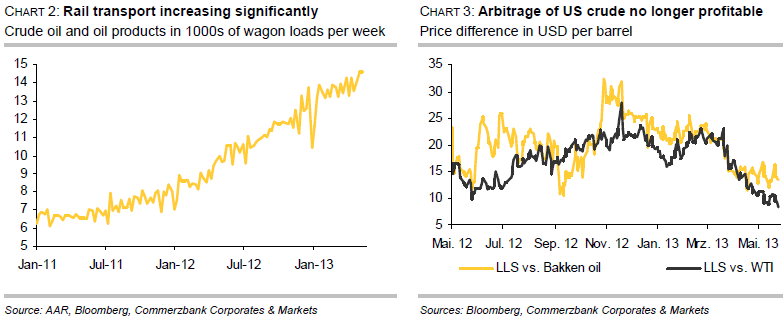
The development of rail transport capacity is having an effect. According to the US Railway Association, between the start of the year and mid-May, around 50% more crude oil and oil products were transported by rail than in the same period last year (chart 2). Total goods transport by rail rose by only 1% y-o-y in the same period. The railway makes it possible to transport surplus shale oil from the US Midwest, not only to refineries on the US Gulf Coast, but also to the US East Coast and eastern Canada. The refineries on the US East Coast and in eastern Canada prefer to process light oil. As these refineries gain access to light shale oil from their country’s interior, so their demand for imports from the Atlantic Basin – i.e. from Western Europe or West Africa – diminishes. This in turn puts pressure on the Brent oil price.
Current price differential barely covers transport costs
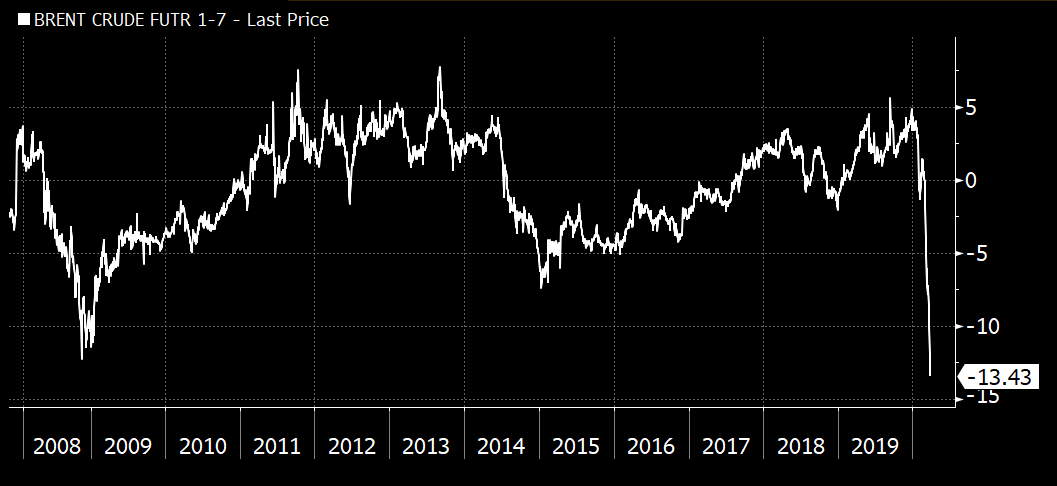
Without new US pipeline capacity, continued narrowing of the price differential between Brent and WTI is difficult to justify. The costs of transporting (shale) oil from the US Midwest by rail are more than 12 USD per barrel to the US Gulf Coast and 15 USD per barrel to the US East Coast. Therefore, in view of the current price difference between Light Louisiana Sweet (LLS) as a reference for the US Gulf Coast and shale oil from the Bakken formation, it is barely profitable anymore to transport surplus crude from the Bakken to the US Gulf Coast via rail (chart 3). This applies even more to the transport from Cushing to the US Gulf Coast and from the Bakken to the US East Coast, given the price difference between LLS and WTI and between Brent and Bakken oil, respectively. In recent months, these arbitrage opportunities were a driving factor in the narrowing of the price differential between Brent and WTI. The rise in oil stocks in Cushing since the start of May could already be a sign that arbitrage is declining. We therefore expect that the price differential between Brent and WTI will temporarily widen to 10-12 USD per barrel again in the upcoming weeks.
Commissioning of new pipeline capacity opens up scope for further narrowing
Pipeline capacity is set to rise steadily over the coming months and will provide sufficient relief in the medium-term. A noteworthy example is the reversed Longhorn Pipeline, through which crude oil has been able since mid-April to flow from the Permian Basin in Texas to the Gulf Coast, and no longer as previously to Cushing. During the summer months the capacity of this pipeline will increase by 150,000 barrels per day, which should be enough to balance the increase in oil production in the US Midwest and prevent Cushing stocks from rising. With the expected commissioning of the southern Keystone XL Pipeline in December, capacity will increase by an additional 400,000 barrels per day. Another 100,000 barrels per day will be added as soon as the extended Seaway Pipeline is able to return to full capacity in Q4. The now completed reversal of the Ho-Ho Pipeline plays an important role in this regard. This is able to carry up to 300,000 barrels of oil per day from Houston to Houma in Louisiana. A noticeable decline in Cushing stocks is expected from autumn onwards, which should cause the price differential to shrink to 5 USD per barrel by year-end. Pipeline transport costs are 2-4 USD per barrel. The price differential between Brent and WTI should fall to this level next year.


Snabba väderomslag har präglat elmarknaden i april, med både prisfall och pristoppar som följd. Samtidigt får solkraften allt större påverkan och pressar ner elpriserna, särskilt i södra Sverige.

Månadsmedelpriset för april på den nordiska elbörsen Nord Pool utan påslag och exklusive moms blev 58,66 öre/kWh i elområde 3, södra Mellansverige, och 22,75 öre/kWh i elområde 1, norra Sverige. På kontinenten syns den så kallade ankkurvan tydligt.
– Nu är solen helt klart på gång. I Tyskland har solen under april producerat nästan 2 TWh mer än ifjol vilket även gynnar oss i Sverige. Ankkurvefenomenet innebär att elpriset är lågt mitt på dagen och stiger raskt mot kvällen. Under perioder med soligt och varmare vårväder är solen ett välkommet inslag här hemma och det påverkar elpriserna nedåt. Den ökar produktionen och minskar konsumtionen, säger Jonas Stenbeck, privatkundschef på Vattenfall Försäljning.
De årliga, planerade underhållsarbetena på kärnkraftverken pågår, vilket innebär att den tillgängliga kapaciteten just nu är cirka 60 procent. Vinden var varierande under april, med snabba skiften mellan stilla och blåsiga perioder, vilket märktes på elpriset.
Den hydrologiska balansen i Norden, alltså det sammanlagda vatteninnehållet i snö, mark och magasin, är svag med betydande underskott i södra Norge. Men magasinsnivåerna i Sverige ligger kring normala nivåer för årstiden och har börjat fyllas på.
– Dock förväntas årets vårflod att, givet dagens förutsättningar, bli lägre än normalt då snötäcket är avsevärt mindre än vanliga nivåer. Vädret kommer avgöra hur väl vårfloden fyller magasinen inför sommaren, säger Jonas Stenbeck.
De höga gaspriserna har fallit något, samtidigt som stigande temperaturer på kontinenten och den stora andelen solkraft haft en stabiliserande effekt. Det geopolitiska läget är dock fortsatt ett orosmoment.
– Det vi sett är att marknaden är väldigt nyhetsdriven. Beroende av vad som rapporteras så reagerar marknaden direkt. Det gör att vi befinner oss i en väldigt speciell situation eftersom denna osäkerhet skapar svängiga och oförutsägbara bränslepriser, vilket i slutändan påverkar elpriset. Jag förstår att många känner en oro men i och med att det blir varmare så kommer man inte att behöva lika mycket el, vilket ger en lägre elkostnad, säger Jonas Stenbeck.
| Medelspotpris | April 2025 | April 2026 |
| Elområde 1, Norra Sverige | 14,39 öre/kWh | 26,09 öre/kWh |
| Elområde 2, Norra Mellansverige | 14,21 öre/kWh | 26,85 öre/kWh |
| Elområde 3, Södra Mellansverige | 37,61 öre/kWh | 56,08 öre/kWh |
| Elområde 4, Södra Sverige | 58,35 öre/kWh | 66,55 öre/kWh |
*Ankkurva: Ankkurvan beskriver hur elproduktionen från förnybara energikällor, som solenergi, påverkar elnätet och elanvändningen över en dag. Kurvan har fått sitt namn eftersom grafen under en dag liknar profilen av en anka.

Råvaran olja handlas fortsatt över 100 USD per fat och det är något stökigt med prissättningen. Michel Gubel ger sin syn på läget för oljan, att priskurvan kan vara i contango och backwardation, samt vad som kan hända med olja på längre sikt.

Den norrländska vårfloden väntas dra igång den här veckan och pågå fram till slutet av maj. Att den är ovanligt svag i år bidrar till att elpriset i system fram till midsommar blir ungefär dubbelt så högt som under samma period i fjol. Det visar Bixias elprognos för maj och juni.

Efter en relativt dyr april väntas systempriset landa på 55 öre per kilowattimme i maj och 50 öre i juni, att jämföra med 31 respektive 21 öre förra året.
– Vi har inte haft så lite snö någon vinter sedan 2019 och det syns tydligt i vårfloden. Den prispress vi normalt sett räknar med den här tiden på året blir betydligt svagare än vanligt. Dessutom ligger bränslepriserna på en högre nivå än i fjol på grund av oron i Mellanöstern, vilket spiller över på de svenska elpriserna, säger Johan Sigvardsson, elprisanalytiker på Bixia.
Den hydrologiska balansen ligger på minus 20 terawattimmar, jämfört med ett överskott på 5–10 terawattimmar vid samma tidpunkt i fjol. Tillrinningen väntas kulminera på ungefär 7 terawattimmar per vecka i slutet av maj, långt under ett normalår.
Hur elpriserna utvecklas under resten av 2026 beror i hög grad på hur blöt sommaren blir. Terminspriset för fjärde kvartalet ligger på runt 70 öre per kilowattimme, vilket speglar marknadens oro inför hösten.
– Det krävs fyra till fem blöta veckor för att ta igen underskottet och fylla på vattenmagasinen. Det finns indikationer på att sommaren kan bli torr i mellersta och södra Skandinavien, men osäkerheten är stor. Om det blir så lär priserna stiga ytterligare, säger Johan Sigvardsson.
Elpris april–juni 2026 jämfört med utfall 2025 (öre/kWh)
| Område | Apr 2026 | Apr 2025 | Maj 2026 | Maj 2025 | Juni 2026 | Juni 2025 |
| System | 70 | 35 | 55 | 31 | 50 | 21 |
| SE1 | 27 | 14 | 27 | 14 | 23 | 3 |
| SE2 | 28 | 14 | 29 | 15 | 24 | 5 |
| SE3 | 50 | 38 | 57 | 43 | 47 | 23 |
| SE4 | 62 | 58 | 66 | 60 | 59 | 41 |


Oil product price pain is set to rise as the Strait of Hormuz stays closed into summer

Solkraften pressar elpriserna dagtid

Michel Gubel ger sin syn på oljemarknaden