

Analys
US shale oil production growth slowing sharply


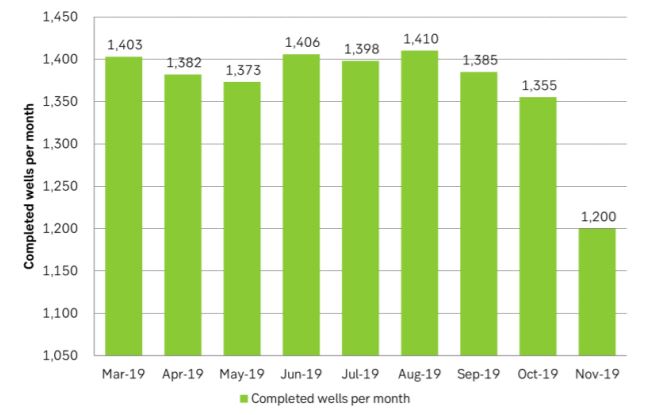
The US EIA yesterday released its monthly drilling and productivity data. It showed that US shale oil production is slowing down even faster than they assumed just one week ago in their monthly STEO oil market outlook. All through 2019 we have seen an ongoing sharp decline in drilling. The slowdown in production growth has however been much more muted as producers have been able to tap a large inventory of drilled but uncompleted wells (DUCs). The well-completion rate has been holding out at around 1350 to 1400 wells per month but now it suddenly fell off a cliff in November.

The number of usable wells in the DUC inventory has always been highly uncertain. We had expected the well-completion rate to hold out at around 1350 to 1400 until Feb/Mar next year before producers would be forced to reduce the completion rate in lack of usable wells in the DUC inventory. But now it is happening already in November. This could be noise, or it could be a sign that number of useful wells in the DUC inventory are fewer than expected.
Losses in existing production is still on the rise while new monthly production is in decline as fewer wells are completed. US shale oil production is now projected to grow by only 30 k bl/d in January (360 k bl/d annualized rate) and it is rapidly moving towards zero growth. If the well completion rate falls another 50-100 wells, we’ll have zero production growth in US shale oil production. Last week the US EIA projected that US shale oil production will be in contraction at the end of 2020 but still hold out at a 50 k bl/d production growth rate MoM through the first five months of 2020. Yesterday’s drilling and productivity data is probably indicating that these assumptions are too high, and that production is slowing down even faster than projected just one week ago. Our view is still that the US EIA is estimating drilling productivity at too high a level because the DUC inventory is being drawn down and thus crates an image of high production per drilling rig in operation.
In a nutshell the number of drilled wells went down by 79 wells, completed wells went down by 155, the DUC inventory declined by 131 wells, production growth fell in 5 out of 7 regions with only one region slightly higher and one unchanged. Non-Permian production will decline by 18 k bl/d MoM in January (216 k bl/d annualized decline rate) and total US shale oil production will only grow by 30 k bl/d in January (360 k bl/d annualized rate).
Across the raw material space, the mantra today is “profit, not volume”, so also in shale oil. It is lack of profitability which is driving down the activity in US shale oil production. It is not lack of ability to produce.
Yesterday’s data and reports from the US EIA is truly great reading for OPEC+. It makes the task of controlling the supply/demand balance in the global oil market next year so much easier. Rather than US shale oil flooding into the market at an increasing rate it is now instead rapidly moving towards zero growth. That makes it much more controllable for OPEC+.
The great thing about US shale oil seen in the eyes of OPEC is the sharp underlying decline rate. OPEC can at any time get back its lost market share probably within a year or so. All it needs to do is to let the oil price drop down deep for 6-12 months. US shale oil production would crash, demand would boom on low prices and voila OPEC’s market share would be back to normal.
So, in terms of market share OPEC has nothing to worry about. It can easily and quickly get it back again anytime it wants to. This would not have been the case if the new oil supply in the US had been more like classic oil which typically never goes away before 10 years or more have passed. A lower price would of course be the price to pay for getting back the lost market share. But time of getting it back would be quick.
Ch1: The number of completed shale oil wells in the US fell off a cliff in November. Much sooner than expected.
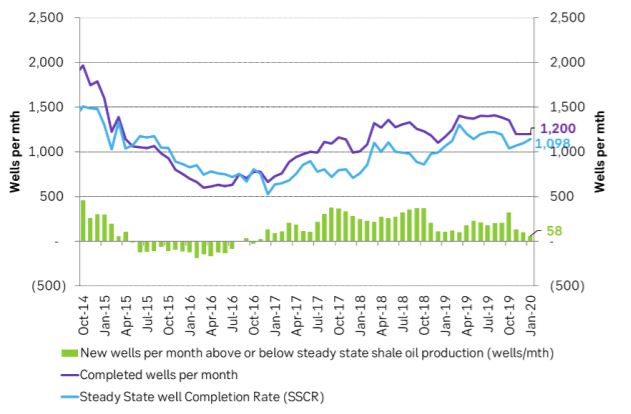
Ch2: If US shale oil producers reduce the number of completed wells by another 58 wells then US shale oil production will have zero growth in January rather than a projected growth rate of 30 k bl/d MoM as projected by the US EIA yesterday
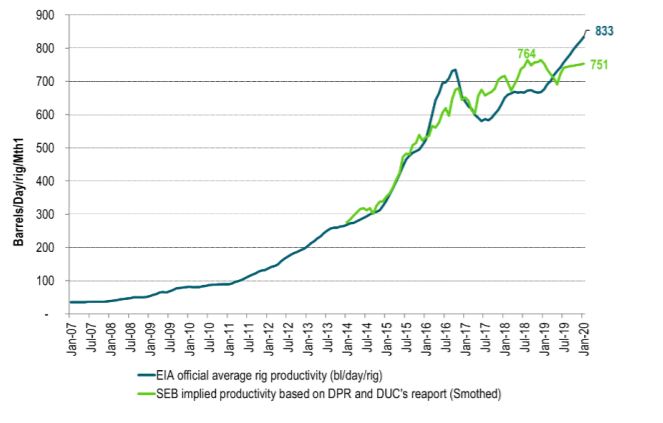
Ch3: The US EIA is over-estimating the drilling productivity due to the DUC inventory draw
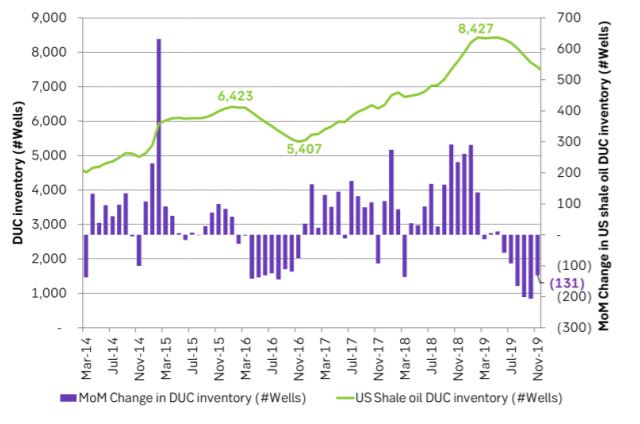
Ch4: The US shale oil DUC inventory is drawing down. We had expected that the draw down rate should accelerate with the DUC inventory then bottoming out at around 5,500 where it bottomed out last time. But the draw down slowed in November. Lack of good wells in the DUC inventory?
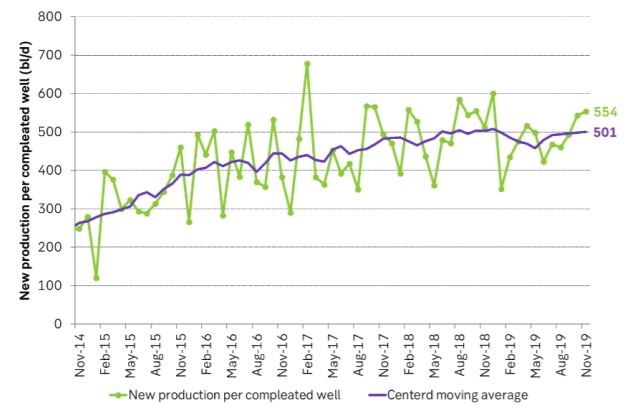
Ch5: SEB well productivity estimate
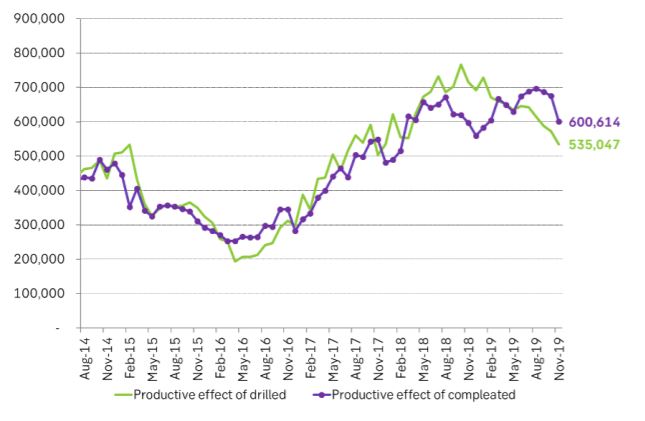
Ch6: The productive value of drilled wells has fallen for a long time as the number of drilled wells per month has declined along with a lower drilling rig count. New in November was that the completion rate also declined sharply. It was bound to happen sooner or later but now it happened sooner.
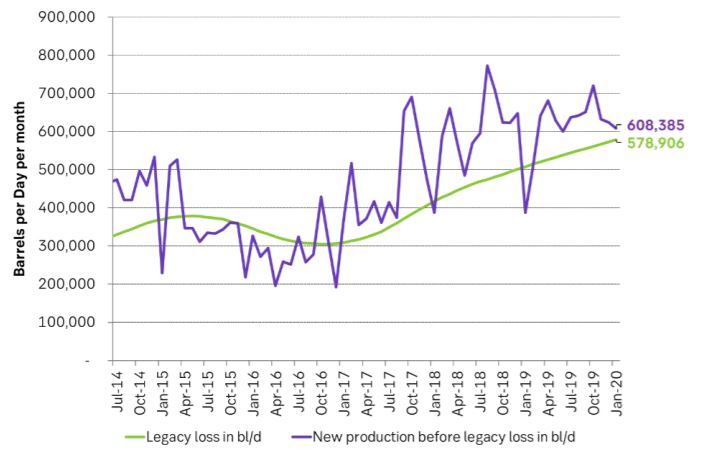
Ch7: Losses in existing production continued to rise while new production is declining. When they meet overall production growth will be zero and then rapidly decline as new production goes below losses in existing production. It’s like breaking off a stick in terms of production. That’s what we saw back in early 2015.
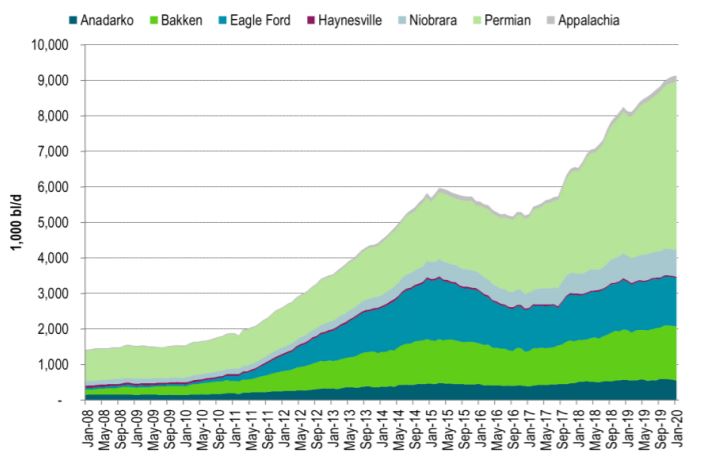
Ch8: US production growth is slowing down. Non-Permian shale oil production is now in decline by a marginal, annualized rate of 216 k bl/d/yr.
Brent is climbing higher. Front-month is at USD 106.3/bl this morning, close to a weekly high and a USD 9/bl jump from Mondays open. This is the move we flagged as a risk earlier in the week: the market shifting from ”a deal is around the corner” to ”this is going to take longer than we thought”.

Analyst Commodities, SEB
During April, rest-of-year Brent remained remarkably stable around USD 90/bl. A stability which rested on one single assumption: the SoH reopens around 1 May. That assumption is now slowly falling apart.
As we highlighted yesterday: every week of delay beyond 1 May adds (theoretically) ish USD 5/bl to the rest-of-year average, as global inventories draw 100 million barrels per week. i.e., a mid-May reopening implies rest-of-year Brent closer to USD 100/bl, and anything pushing into June or July takes us meaningfully higher.
What’s changed in the last 48 hours:
#1: The US military has formally warned that clearing suspected sea mines from SoH could take up to six months. That is a completely different timescale from what the financial market is pricing. Even a political deal tomorrow does not immediately reopen the strait.
#2: Trump has shifted his tone from urgency to ”strategic patience”. In yesterday’s press conference: ”Don’t rush me… I want a great deal.” The market is reading this as a president no longer feeling pressured by timelines, with the naval blockade running in the background.
#3: So far, the military activity is escalating, not de-escalating. Axios reports Iran is laying more mines in SoH. The US 3rd carrier strike group (USS George H.W. Bush) is arriving with two countermine vessels. Trump yesterday ordered the US Navy to destroy any Iranian boats caught laying mines. While CNN reports that the Pentagon is actively drawing up plans to strike Iranian SoH capabilities and individual Iranian military leaders if the ceasefire collapses. i.e., NOT a attitude consistent with an imminent deal!
Spot crude and product prices eased off the early-April highs on a combination of system rerouting and deal optimism. Both now weakening. Goldman estimates April Gulf output is reduced by 14.5 mbl/d, or 57% of pre-war supply, a number that keeps getting worse the longer this drags on.
Demand-side adaptation is ongoing: S. Korea has cut its Middle East crude dependence from 69% to 56% by pulling more from the Americas and Africa, and Japan is kicking off a second round of SPR releases from 1 May. But SPRs are finite.
Ref. to the negotiations, we should not bet on speed. The current Iranian leadership is dominated by genuine hardliners willing to absorb economic pain and run the clock to extract concessions. That is not a setup for a rapid resolution. US/Israeli media briefings keep framing the delay as ”internal Iranian divisions”, the reality is more complicated and points toward weeks and months, not days.
Our point is that the complexity is large, and higher prices have only just started (given a scenario where the negotiations drag out in time). The market spent April leaning on the USD 90/bl rest-of-year assumption; that case is diminishing by the hour. If ”early May reopening” is replaced by ”June, July or later” over the next week or two, both crude and products have meaningful room to reprice higher from here. There is a high risk being short energy and betting on any immediate political resolution(!).
Down on Friday. Up on Monday. The Brent June crude oil contract traded down 5.1% last week to a close of $90.38/b. It reached a high of $103.87/b last Monday and a low of $86.09/b on Friday as Iran announced that the Strait of Hormuz was fully open for transit. That quickly changed over the weekend as the US upheld its blockade of Iranian oil exports while Iran naturally responded by closing the SoH again. The US blew a hole in the engine room of the Iranian ship TOUSKA and took custody of the ship on Sunday. Brent crude is up 5.6% this morning to $95.4/b.

The cease-fire is expiring tomorrow. The US has said it will send a delegation for a second round of negotiations in Islamabad in Pakistan. But Iran has for now rejected a second round of talks as it views US demands as unrealistic and excessive while the US is also blocking the Strait of Hormuz.
While Brent is up 5% this morning, the financial market is still very optimistic that progress will be made. That talks will continue and that the SoH will fully open by the start of May which is consistent with a rest-of-year average Brent crude oil price of around $90/b with the market now trading that balance at around $88/b.
Financial optimism vs. physical deterioration. We have a divergence where the financial market is trading negotiations, improvements and resolution while at the same time the physical market is deteriorating day by day. Physical oil flows remain constrained by disrupted flows, longer voyage times and elevated freight and insurance costs.
Financial markets are betting that a US/Iranian resolution will save us in time from violent shortages down the road. But every day that the SoH remains closed is bringing us closer to a potentially very painful point of shortages and much higher prices.
The US blockade is also a weapon of leverage against its European and Asian allies. When Iran closed the SoH it held the world economy as a hostage against the US. The US blockade of the SoH is of course blocking Iranian oil exports. But it is also an action of disruption directed towards Europe and Asia. The US has called for the rest of the world to engaged in the war with Iran: ”If you want oil from the Persian Gulf, then go and get it”. A risk is that the US plays brinkmanship with the global oil market directed towards its European and Asian allies and maybe even towards China to force them to engage and take part. Maybe unthinkable. But unthinkable has become the norm with Trump in the White House.
Wild moves yesterday. Brent crude traded to a high of $114.43/b and a low of $96.0/b and closed at $99.94/b yesterday.
US – Iran negotiations ongoing or not? What a day. Donald Trump announced that good talks were ongoing between Iran and the US and that the 48 hour deadline before bombing Iranian power plants and energy infrastructure was postponed by five days subject to success of ongoing meetings. Iranian media meanwhile stated that no meetings were ongoing at all.
Today we are scratching our heads trying to figure out what yesterday was all about.
Friends and family playing the market? Was it just Trump and his friends and family who were playing with oil and equity markets with $580m and $1.46bn in bets being placed by someone in oil and equity markets just 15 minutes before Trump’s announcement?
Was Trump pulling a TACO as he reached his political and economic pain point: Brent at $112/b, US Gas at $4/gal, SPX below 200dma and US 10yr above 4.4%?
Different Iranian factions with Trump talking with one of them? Are there real negotiations going on but with the US talking to one faction in Iran while another, the hardliners, are not involved and are denying any such negotiations going on?
Extending the ultimatum to attack and invade Kharg island next weekend? Or, is the five day delay of the deadline a tactical decision to allow US amphibious assault ships and marines to arrive in the Gulf in the upcoming weekend while US and Israeli continues to degrade Iranian military targets till then. And then next weekend a move by the US/Israel to attack and conquer for example the Kharg island?
We do not really know which it is or maybe a combination of these.
We did get some kind of TACO ydy. But markets have been waiting for some kind of TACO to happen and yesterday we got some kind of TACO. And Brent crude is now trading at $101.5/b as a result rather than at $112-114/b as it did no the high yesterday.
But what really matters in our view is the political situation on the ground in Iran. Will hardliners continue to hold power or will a more pragmatic faction gain power?
If the hardliners remain in power then oil pain should extend all the way to US midterm elections. The hardliners were apparently still in charge as of last week. Iran immediately retaliated and damaged LNG infrastructure in Qatar after Israel hit Iranian South Pars. The SoH was still closed and all messages coming out of Iran indicated defiance. Hardliners continues in power has a huge consequence for oil prices going forward. The regime has played its ’oil-weapon’ (closing or chocking the Strait of Hormuz). It is using it to achieve political goals. Deterrence: it needs to be so politically and economically expensive to attack Iran that it won’t happen again in the future. Or at least that the US/Israel thinks 10-times over before they attack again. The highest Brent crude oil closing price since the start of the war is $112.19/b last Friday. In comparison the 20-year inflation adjusted Brent price is $103/b. So Brent crude last Friday at $112.19/b isn’t a shockingly high price. And it is still far below the nominal high of $148/b from 2008 which is $220/b if inflation adjusted. So once in a lifetime Iran activates its most powerful weapon. The oil weapon. It needs to show the power of this weapon and it needs to reap political gains. Getting Brent to $112/b and intraday high of $119.5/b (9 March) isn’t a display of the power of that weapon. And it is not a deterrence against future attacks.
So if the hardliners remain in power in Iran, then the SoH will likely remain chocked all the way to US midterm elections and Brent crude will at a minimum go above the historical nominal high of $148/b from 2008.
Thus the outlook for the oil price for the rest of the year doesn’t depend all that much of whether Trump pulls a TACO or not. Stops bombing or not. It depends more on who is in charge in Iran. If it is the hardliners, then deterrence against future attacks via chocking of the SoH and high oil prices is the likely line of action. It is impacting the world but the Iranian ’oil-weapon’ is directed towards the US president and the the US midterm elections.
If a pragmatic faction gets to power in Iran, then a very prosperous future is possible. However, if power is shifting towards a more pragmatic faction in Iran then a completely different direction could evolve. Such a faction could possibly be open for cooperation with the US and the GCC and possibly put its issues versus Israel aside. Then the prosperity we have seen evolving in Dubai could be a possible future also for Iran.
So far it looks like the hardliners are fully in charge. As far as we can see, the hardliners are still fully in control in Iran. That points towards continued chocking of the SoH and oil prices ticking higher as global inventories (the oil market buffers) are drawn lower. And not just for a few more weeks, but possibly all the way to the US midterm elections.


Brent crude up USD 9/bl on the week… ”deal around the corner” narrative fades
Market Still Betting on Timely Resolution, But Each Day Raises Shortage Risk

Christian Kopfer om läget för oljan

Marknaden måste börja betrakta de höga kopparpriserna som det nya normala

Det fysiska spotpriset på brentolja har slagit nytt rekord

40 minuter med Javier Blas om hur världen verkligen påverkas av energikrisen
Det fysiska spotpriset på brentolja har slagit nytt rekord
Marknaden måste börja betrakta de höga kopparpriserna som det nya normala
Christian Kopfer om läget för oljan

Efter tillväxten: Guldbrev satsar på expansion i Europa
-
 Nyheter3 veckor sedan
40 minuter med Javier Blas om hur världen verkligen påverkas av energikrisen
-
 Nyheter3 veckor sedan
Det fysiska spotpriset på brentolja har slagit nytt rekord
-
 Nyheter3 veckor sedan
Marknaden måste börja betrakta de höga kopparpriserna som det nya normala
-
 Nyheter2 veckor sedan
Christian Kopfer om läget för oljan
-
 Nyheter3 veckor sedan
Efter tillväxten: Guldbrev satsar på expansion i Europa
-
Analys6 dagar sedan
Market Still Betting on Timely Resolution, But Each Day Raises Shortage Risk
-
Analys2 dagar sedan
Brent crude up USD 9/bl on the week… ”deal around the corner” narrative fades