

Analys
US crude recovery could cover all OPEC cuts

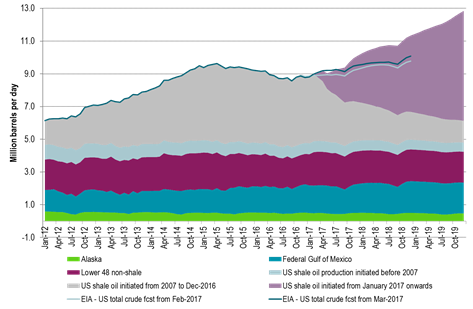
 Over the last two weeks Brent crude has fallen close to $4/b. Market perception has shifted from “OPEC will do the job and US crude production will recover gradually” to instead “Can OPEC do the job? and US production is rebounding strongly”. The hypothesis that US crude oil production will only recover gradually and slowly as long as the oil price stays below $60/b has clearly fallen. The US EIA projects that US crude production will move above its April 2015 peak of 9.6 mb/d in February 2018. We think that this will happen already in October 2017. However, if we extrapolate the average weekly increase since the start of 2017 (+33.9 kb/d/week) we get that with a starting point of 9.1 mb/d on the 10th of March then US crude production will pass the 9.6 mb/d already in June 2017. Thus full attention to the US EIA’s weekly publishing of US crude production is clearly warranted.
If US production had only recovered slowly as long as the oil price stayed below $60/b, then it would easily have been in OPEC’s power to drive the oil price rather quickly back to $60/b. However, US shale oil rig count rose by 7 rigs per week in H2-17 when the WTI 15mth forward price averaged around $52/b in H2-16. When that part of the forward curve was pushed up to $55-56/b following OPEC’s decision to cut it lifted the weekly rig count additions to 9.2 rigs/week on average so far in 2017. Along with the latest sell-off the WTI 15mths price has now fallen back to $50.5/b. This can be interpreted as an effort by the market to push back the current acceleration in shale oil investments. If this price stays at this level of about $50/b then we won’t know the effect of this before some 6-8 weeks down the road which is the typical lag between price action to rig count reaction. Thus the growth in US shale oil rig count is likely to continue unabated all through April.
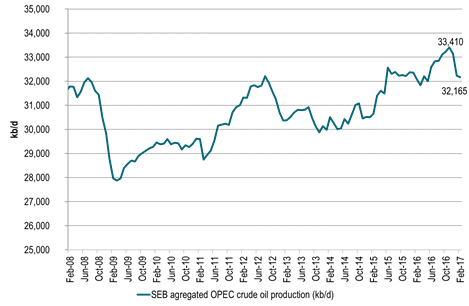
OPEC will meet on the 25th of May this year to discuss whether to continue its cuts or not. US crude oil production stood at 8.7 mb/d when OPEC decided to cut at its 30th November meeting in 2016. That was only 0.25 mb/b above the US crude production trough of 8.45 mb/d in July/August 2016. The general view then was clearly that US crude production would recover gradually. There would not be much acceleration unless the oil price moved up to $60/b. OPEC decided to cut 1.16 mb/d from its October production level which lead to a production target of 31.8 mb/d for H1-17. So far OPEC has cut 0.4 mb/d less than planned with an averaged Jan/Feb production of 32.2 mb/d. I.e. the organisation has cut some 0.8 mb/d versus its October 2016 level. Back in November a US crude production rebound was not even on the horizon and not much discussed. The US EIA’s monthly report only stretched out to the end of 2017 with a prediction that US crude production would hit 8.94 mb/d in Dec 2017 which was just 250 kb/d above the US crude production in November 2016.
Now it all looks different. If we look away from EIA’s projection of US hitting 9.6 mb/d in Feb 2018 and instead focus on the latest weekly production data of 9.1 mb/d and extend it with the growth trend so far this year then US production would hit close to 9.5 mb/d just when OPEC’s members meet on the 25th of May. US production would then have increased by close to 0.8 mb/d since OPEC decided to cut in November 2016. That is close to exactly what OPEC has cut in Jan and Feb. Thus if OPEC’s compliance to the decided cuts don’t rise from here then US crude oil production recovery could end up rising equaly much as OPEC ended up cutting. The previous oil minister in Saudi Arabia, Ali al-Naimi’s words that an OPEC cut would only yield a lower market share while not necessarily lift the oil price may start to ring in the back of the head of OPEC’s members. We don’t expect OPEC to extend its cuts into H2-17. We have this itching feeling that OPEC compliance to cuts may start to erode towards the end of H1-17. Especially if the expectation is that there will be no further cuts.
Speculative market repositioning helped to shift oil prices lower
The pullback in the oil price last two weeks was clearly a repositioning in speculative positions as holders of long positions started to be concerned about the increasingly visible strong US production recovery. Net long speculative positions in WTI reached close to 600 mb some 4 weeks ago but have now sold off back down to 500 mb. A more neutral level is however around 350 mb. Thus there is still risk for further bearish repositioning.
We still expect Brent crude at $57.5/b in Q2-17 before falling back to $52.5/b in Q4-17
We are still positive for crude oil prices into Q2-17 where we expect front month Brent to average $57.5/b. We expect to see inventories to start to draw any moment as OPEC’s elevated production in Nov and Dec now increasingly is assimilated. Global refineries are also now increasingly coming back on line thus starting to process crude oil again. As oil inventories continues to draw as it did all through H2-16 we expect the forward crude oil curves to flip fully into backwardation. This will then enable the Brent crude oil front month contract to move up to $57.5/b while still leaving the WTI 15mth contract at around $51-52/b. Our outlook for Q2-17 is however at risk if US crude oil production continues to grow at its current trend rate. We still expect Brent crude to head down to average $52.5/b in Q4-17 in order to cool US shale oil production growth.
We expect OECD inventories to draw down 160 million barrels in 2017
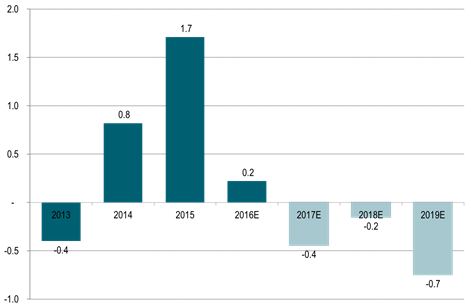
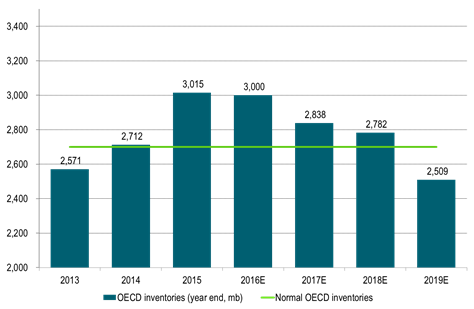
The market was disappointed when it heard from IEA that OECD inventories rose by 48 mb in January. In perspective however, OECD inventories normally increase by some 30 mb from Dec to Jan. Thus the increase in inventories was only 18 mb more than normal. What is striking is that OECD’s inventories trended downwards all through H2-16 and ended down y/y for the first time in a long, long time in both December and January. And this was even without the help of OPEC cuts. We still expect the oil market to run a deficit of some 0.4 mb/d in 2017 thus resulting in a steady draw in inventories. Thus we have passed the OECD peak inventories and we are now heading downwards. The higher activation of US shale oil rigs than expected over the last two to three months has however impacted our projected supply/demand balance for 2018 leading to virtually no deficit in 2018 and thus very limited draws. Thus 2018 look likely to be a waiting year for the oil market with still plenty of oil in OECD inventories and with few pressure points.
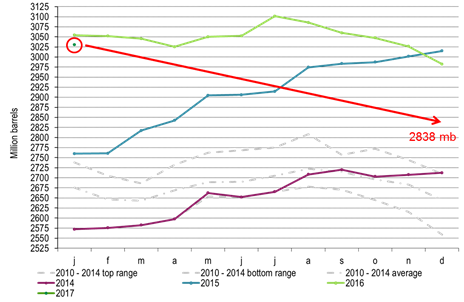
Ch1: OECD down y/y for the first time in a long time in Dec and Jan
We are past the peak OECD inventories. To draw down from here
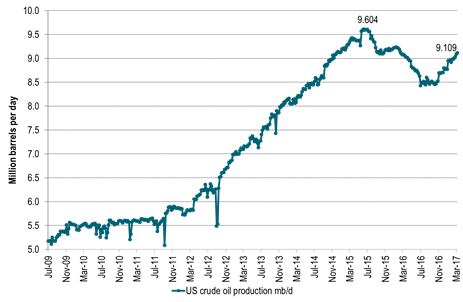
Ch2: Strong US production growth recovery is posing a problem for OPEC
OPEC cuts unlikely to continue in H2-17 as US production may reach 9.5 mb/d already in late May (trend extrapolation)
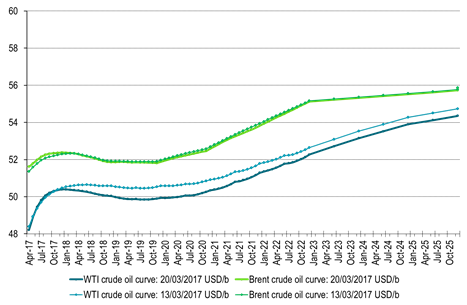
Ch3: Latest sell-off has increased the depth of front end crude curve contango
This contango and discount for spot crude prices versus longer dated contracts is just what OPEC wants to get away from
The 1-2 year forward WTI curve has shifted down to $50/b which would reduce the profitability for new shale oil investments
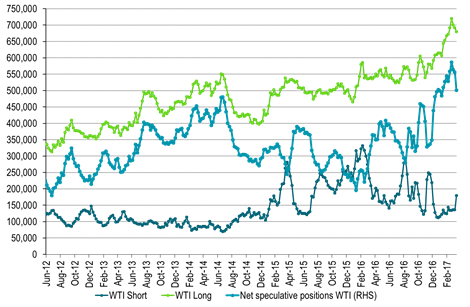
Ch4: Net long speculative WTI positions has pulled back but are still high
Now standing at 500,000 contracts or 500 million barrels.
Neutral level would be around 350 million barrels
Ch5: OPEC production at 32.16 mb/d in Feb and thus some 350 kb/d above its target.
Will OPEC compliance fall apart if it becomes increasingly clear that there will be no cuts in H2-17?
Ch6: We still expect a deficit the next three years despite strong US production growth
The balance assumes no OPEC cuts after H1-17
Ch7: Due to current high OECD inventories the global oil market is fine all through 2017 and 2018.
Not a lot of pressure points to be seen before 2019
Ch8: And yes, we are bullish US crude oil production but even more than that is needed in 2019
Then it all boils down to “too little too late” or “too much too soon”.
The US EIA is lifting its prognosis every month all since last July.
We expect them to continue to do that going forward as well as the EIA prognosis is still way behind the curve in our view.
Kind regards
Bjarne Schieldrop
Chief analyst, Commodities
SEB Markets
Merchant Banking
When it starts to move lower it moves rather quickly. Gaza, China, IEA. Brent crude is down 2.1% today to $62/b after having traded as high as $66.58/b last Thursday and above $70/b in late September. The sell-off follows the truce/peace in Gaze, a flareup in US-China trade and yet another bearish oil outlook from the IEA.

A lasting peace in Gaze could drive crude oil at sea to onshore stocks. A lasting peace in Gaza would probably calm down the Houthis and thus allow more normal shipments of crude oil to sail through the Suez Canal, the Red Sea and out through the Bab-el-Mandeb Strait. Crude oil at sea has risen from 48 mb in April to now 91 mb versus a pre-Covid normal of about 50-60 mb. The rise to 91 mb is probably the result of crude sailing around Africa to be shot to pieces by the Houthis. If sailings were to normalize through the Suez Canal, then it could free up some 40 mb in transit at sea moving onshore into stocks.
The US-China trade conflict is of course bearish for demand if it continues.
Bearish IEA yet again. Getting closer to 2026. Credibility rises. We expect OPEC to cut end of 2025. The bearish monthly report from the IEA is what it is, but the closer we get to 2026, the more likely the IEA is of being ball-park right in its outlook. In its monthly report today the IEA estimates that the need for crude oil from OPEC in 2026 will be 25.4 mb/d versus production by the group in September of 29.1 mb/d. The group thus needs to do some serious cutting at the end of 2025 if it wants to keep the market balanced and avoid inventories from skyrocketing. Given that IEA is correct that is. We do however expect OPEC to implement cuts to avoid a large increase in inventories in Q1-26. The group will probably revert to cuts either at its early December meeting when they discuss production for January or in early January when they discuss production for February. The oil price will likely head yet lower until the group reverts to cuts.
Dubai: The Mid-East anchor dragging crude oil lower. Surplus emerging in Mid-East pricing. Crude oil prices held surprisingly strong all through the summer. A sign and a key source of that strength came from the strength in the front-end backwardation of the Dubai crude oil curve. It held out strong from mid-June and all until late September with an average 1-3mth time-spread premium of $1.8/b from mid-June to end of September. The 1-3mth time-spreads for Brent and WTI however were in steady deterioration from late June while their flat prices probably were held up by the strength coming from the Persian Gulf. Then in late September the strength in the Dubai curve suddenly collapsed. Since the start of October it has been weaker than both the Brent and the WTI curves. The Dubai 1-3mth time-spread now only stands at $0.25/b. The Middle East is now exporting more as it is producing more and also consuming less following elevated summer crude burn for power (Aircon) etc.
The only bear-element missing is a sudden and solid rise in OECD stocks. The only thing that is missing for the bear-case everyone have been waiting for is a solid, visible rise in OECD stocks in general and US oil stocks specifically. So watch out for US API indications tomorrow and official US oil inventories on Thursday.
No sign of any kind of fire-sale of oil from Saudi Arabia yet. To what we can see, Saudi Arabia is not at all struggling to sell its oil. It only lowered its Official Selling Prices (OSPs) to Asia marginally for November. A surplus market + Saudi determination to sell its oil to the market would normally lead to a sharp lowering of Saudi OSPs to Asia. Not yet at least and not for November.
The 5yr contract close to fixed at $68/b. Of importance with respect to how far down oil can/will go. When the oil market moves into a surplus then the spot price starts to trade in a large discount to the 5yr contract. Typically $10-15/b below the 5yr contract on average in bear-years (2009, 2015, 2016, 2020). But the 5yr contract is usually pulled lower as well thus making this approach a moving target. But the 5yr contract price has now been rock solidly been pegged to $68/b since 2022. And in the 2022 bull-year (Brent spot average $99/b), the 5yr contract only went to $72/b on average. If we assume that the same goes for the downside and that 2026 is a bear-year then the 5yr goes to $64/b while the spot is trading at a $10-15/b discount to that. That would imply an average spot price next year of $49-54/b. But that is if OPEC doesn’t revert to cuts and instead keeps production flowing. We think OPEC(+) will trim/cut production as needed into 2026 to prevent a huge build-up in global oil stocks and a crash in prices. But for now we are still heading lower. Into the $50ies/b.
Some rebound but not much. Brent crude rebounded 1.5% yesterday to $65.47/b. This morning it is inching 0.2% up to $65.6/b. The lowest close last week was on Thursday at $64.11/b.
The curve structure is almost as week as it was before the weekend. The rebound we now have gotten post the message from OPEC+ over the weekend is to a large degree a rebound along the curve rather than much strengthening at the front-end of the curve. That part of the curve structure is almost as weak as it was last Thursday.
We are still on a weakening path. The message from OPEC+ over the weekend was we are still on a weakening path with rising supply from the group. It is just not as rapidly weakening as was feared ahead of the weekend when a quota hike of 500 kb/d/mth for November was discussed.
The Brent curve is on its way to full contango with Brent dipping into the $50ies/b. Thus the ongoing weakening we have had in the crude curve since the start of the year, and especially since early June, will continue until the Brent crude oil forward curve is in full contango along with visibly rising US and OECD oil inventories. The front-month Brent contract will then flip down towards the $60/b-line and below into the $50ies/b.
At what point will OPEC+ turn to cuts? The big question then becomes: When will OPEC+ turn around to make some cuts? At what (price) point will they choose to stabilize the market? Because for sure they will. Higher oil inventories, some more shedding of drilling rigs in US shale and Brent into the 50ies somewhere is probably where the group will step in.
There is nothing we have seen from the group so far which indicates that they will close their eyes, let the world drown in oil and the oil price crash to $40/b or below.
The message from OPEC+ is also about balance and stability. The world won’t drown in oil in 2026. The message from the group as far as we manage to interpret it is twofold: 1) Taking back market share which requires a lower price for non-OPEC+ to back off a bit, and 2) Oil market stability and balance. It is not just about 1. Thus fretting about how we are all going to drown in oil in 2026 is totally off the mark by just focusing on point 1.
When to buy cal 2026? Before Christmas when Brent hits $55/b and before OPEC+ holds its last meeting of the year which is likely to be in early December.
Brent crude oil prices have rebounded a bit along the forward curve. Not much strengthening in the structure of the curve. The front-end backwardation is not much stronger today than on its weakest level so far this year which was on Thursday last week.

The front-end backwardation fell to its weakest level so far this year on Thursday last week. A slight pickup yesterday and today, but still very close to the weakest year to date. More oil from OPEC+ in the coming months and softer demand and rising inventories. We are heading for yet softer levels.

Down to the lowest since early May. Brent crude has fallen sharply the latest four days. It closed at USD 64.11/b yesterday which is the lowest since early May. It is staging a 1.3% rebound this morning along with gains in both equities and industrial metals with an added touch of support from a softer USD on top.
What stands out the most to us this week is the collapse in the Dubai one to three months time-spread.
Dubai is medium sour crude. OPEC+ is in general medium sour crude production. Asian refineries are predominantly designed to process medium sour crude. So Dubai is the real measure of the balance between OPEC+ holding back or not versus Asian oil demand for consumption and stock building.
A sharp weakening of the front-end of the Dubai curve. The front-end of the Dubai crude curve has been holding out very solidly throughout this summer while the front-end of the Brent and WTI curves have been steadily softening. But the strength in the Dubai curve in our view was carrying the crude oil market in general. A source of strength in the crude oil market. The core of the strength.
The now finally sharp decline of the front-end of the Dubai crude curve is thus a strong shift. Weakness in the Dubai crude marker is weakness in the core of the oil market. The core which has helped to hold the oil market elevated.
Facts supports the weakening. Add in facts of Iraq lifting production from Kurdistan through Turkey. Saudi Arabia lifting production to 10 mb/d in September (normal production level) and lifting exports as well as domestic demand for oil for power for air con is fading along with summer heat. Add also in counter seasonal rise in US crude and product stocks last week. US oil stocks usually decline by 1.3 mb/week this time of year. Last week they instead rose 6.4 mb/week (+7.2 mb if including SPR). Total US commercial oil stocks are now only 2.1 mb below the 2015-19 seasonal average. US oil stocks normally decline from now to Christmas. If they instead continue to rise, then it will be strongly counter seasonal rise and will create a very strong bearish pressure on oil prices.
Will OPEC+ lift its voluntary quotas by zero, 137 kb/d, 500 kb/d or 1.5 mb/d? On Sunday of course OPEC+ will decide on how much to unwind of the remaining 1.5 mb/d of voluntary quotas for November. Will it be 137 kb/d yet again as for October? Will it be 500 kb/d as was talked about earlier this week? Or will it be a full unwind in one go of 1.5 mb/d? We think most likely now it will be at least 500 kb/d and possibly a full unwind. We discussed this in a not earlier this week: ”500 kb/d of voluntary quotas in October. But a full unwind of 1.5 mb/d”
The strength in the front-end of the Dubai curve held out through summer while Brent and WTI curve structures weakened steadily. That core strength helped to keep flat crude oil prices elevated close to the 70-line. Now also the Dubai curve has given in.

Brent crude oil forward curves

Total US commercial stocks now close to normal. Counter seasonal rise last week. Rest of year?

Total US crude and product stocks on a steady trend higher.


The Mid-East anchor dragging crude oil lower

Samtal om sällsynta jordartsmetaller, guld och silver

Brookfield köper bränsleceller för 5 miljarder USD av Bloom Energy för att driva AI-datacenter

Teck Resources kan förse Nordamerika och kanske hela G7 med all germanium som behövs

Leading Edge Materials är på rätt plats i rätt tid

Kinas elproduktion slog nytt rekord i augusti, vilket även kolkraft gjorde

Tyskland har så höga elpriser att företag inte har råd att använda elektricitet

OPEC+ missar produktionsmål, stöder oljepriserna

Ett samtal om guld, olja, fjärrvärme och förnybar energi
Brent crude ticks higher on tension, but market structure stays soft
-
 Nyheter4 veckor sedan
Kinas elproduktion slog nytt rekord i augusti, vilket även kolkraft gjorde
-
Nyheter4 veckor sedan
Tyskland har så höga elpriser att företag inte har råd att använda elektricitet
-
 Nyheter3 veckor sedan
OPEC+ missar produktionsmål, stöder oljepriserna
-
 Nyheter3 veckor sedan
Ett samtal om guld, olja, fjärrvärme och förnybar energi
-
Analys4 veckor sedan
Brent crude ticks higher on tension, but market structure stays soft
-
Analys3 veckor sedan
Are Ukraine’s attacks on Russian energy infrastructure working?
-

 Nyheter2 veckor sedan
Guld nära 4000 USD och silver 50 USD, därför kan de fortsätta stiga
-

 Nyheter3 veckor sedan
Guldpriset uppe på nya höjder, nu 3750 USD