Analys
US crude recovery could cover all OPEC cuts


If US production had only recovered slowly as long as the oil price stayed below $60/b, then it would easily have been in OPEC’s power to drive the oil price rather quickly back to $60/b. However, US shale oil rig count rose by 7 rigs per week in H2-17 when the WTI 15mth forward price averaged around $52/b in H2-16. When that part of the forward curve was pushed up to $55-56/b following OPEC’s decision to cut it lifted the weekly rig count additions to 9.2 rigs/week on average so far in 2017. Along with the latest sell-off the WTI 15mths price has now fallen back to $50.5/b. This can be interpreted as an effort by the market to push back the current acceleration in shale oil investments. If this price stays at this level of about $50/b then we won’t know the effect of this before some 6-8 weeks down the road which is the typical lag between price action to rig count reaction. Thus the growth in US shale oil rig count is likely to continue unabated all through April.
OPEC will meet on the 25th of May this year to discuss whether to continue its cuts or not. US crude oil production stood at 8.7 mb/d when OPEC decided to cut at its 30th November meeting in 2016. That was only 0.25 mb/b above the US crude production trough of 8.45 mb/d in July/August 2016. The general view then was clearly that US crude production would recover gradually. There would not be much acceleration unless the oil price moved up to $60/b. OPEC decided to cut 1.16 mb/d from its October production level which lead to a production target of 31.8 mb/d for H1-17. So far OPEC has cut 0.4 mb/d less than planned with an averaged Jan/Feb production of 32.2 mb/d. I.e. the organisation has cut some 0.8 mb/d versus its October 2016 level. Back in November a US crude production rebound was not even on the horizon and not much discussed. The US EIA’s monthly report only stretched out to the end of 2017 with a prediction that US crude production would hit 8.94 mb/d in Dec 2017 which was just 250 kb/d above the US crude production in November 2016.
Now it all looks different. If we look away from EIA’s projection of US hitting 9.6 mb/d in Feb 2018 and instead focus on the latest weekly production data of 9.1 mb/d and extend it with the growth trend so far this year then US production would hit close to 9.5 mb/d just when OPEC’s members meet on the 25th of May. US production would then have increased by close to 0.8 mb/d since OPEC decided to cut in November 2016. That is close to exactly what OPEC has cut in Jan and Feb. Thus if OPEC’s compliance to the decided cuts don’t rise from here then US crude oil production recovery could end up rising equaly much as OPEC ended up cutting. The previous oil minister in Saudi Arabia, Ali al-Naimi’s words that an OPEC cut would only yield a lower market share while not necessarily lift the oil price may start to ring in the back of the head of OPEC’s members. We don’t expect OPEC to extend its cuts into H2-17. We have this itching feeling that OPEC compliance to cuts may start to erode towards the end of H1-17. Especially if the expectation is that there will be no further cuts.
Speculative market repositioning helped to shift oil prices lower
The pullback in the oil price last two weeks was clearly a repositioning in speculative positions as holders of long positions started to be concerned about the increasingly visible strong US production recovery. Net long speculative positions in WTI reached close to 600 mb some 4 weeks ago but have now sold off back down to 500 mb. A more neutral level is however around 350 mb. Thus there is still risk for further bearish repositioning.
We still expect Brent crude at $57.5/b in Q2-17 before falling back to $52.5/b in Q4-17
We are still positive for crude oil prices into Q2-17 where we expect front month Brent to average $57.5/b. We expect to see inventories to start to draw any moment as OPEC’s elevated production in Nov and Dec now increasingly is assimilated. Global refineries are also now increasingly coming back on line thus starting to process crude oil again. As oil inventories continues to draw as it did all through H2-16 we expect the forward crude oil curves to flip fully into backwardation. This will then enable the Brent crude oil front month contract to move up to $57.5/b while still leaving the WTI 15mth contract at around $51-52/b. Our outlook for Q2-17 is however at risk if US crude oil production continues to grow at its current trend rate. We still expect Brent crude to head down to average $52.5/b in Q4-17 in order to cool US shale oil production growth.
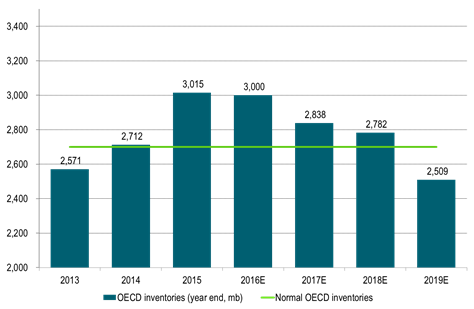
We expect OECD inventories to draw down 160 million barrels in 2017
The market was disappointed when it heard from IEA that OECD inventories rose by 48 mb in January. In perspective however, OECD inventories normally increase by some 30 mb from Dec to Jan. Thus the increase in inventories was only 18 mb more than normal. What is striking is that OECD’s inventories trended downwards all through H2-16 and ended down y/y for the first time in a long, long time in both December and January. And this was even without the help of OPEC cuts. We still expect the oil market to run a deficit of some 0.4 mb/d in 2017 thus resulting in a steady draw in inventories. Thus we have passed the OECD peak inventories and we are now heading downwards. The higher activation of US shale oil rigs than expected over the last two to three months has however impacted our projected supply/demand balance for 2018 leading to virtually no deficit in 2018 and thus very limited draws. Thus 2018 look likely to be a waiting year for the oil market with still plenty of oil in OECD inventories and with few pressure points.
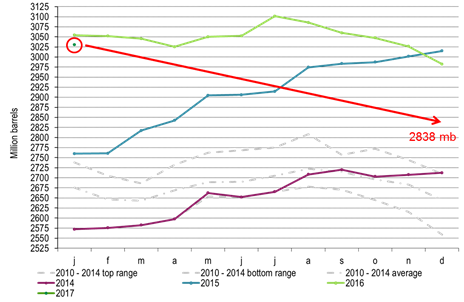
Ch1: OECD down y/y for the first time in a long time in Dec and Jan
We are past the peak OECD inventories. To draw down from here
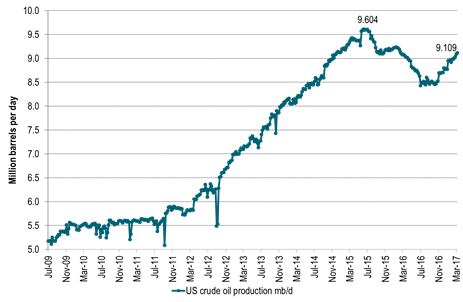
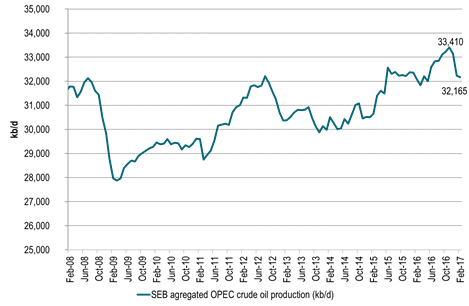
Ch2: Strong US production growth recovery is posing a problem for OPEC
OPEC cuts unlikely to continue in H2-17 as US production may reach 9.5 mb/d already in late May (trend extrapolation)
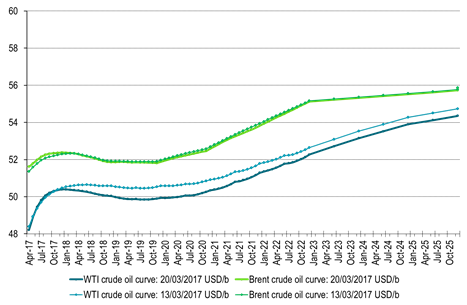
Ch3: Latest sell-off has increased the depth of front end crude curve contango
This contango and discount for spot crude prices versus longer dated contracts is just what OPEC wants to get away from
The 1-2 year forward WTI curve has shifted down to $50/b which would reduce the profitability for new shale oil investments
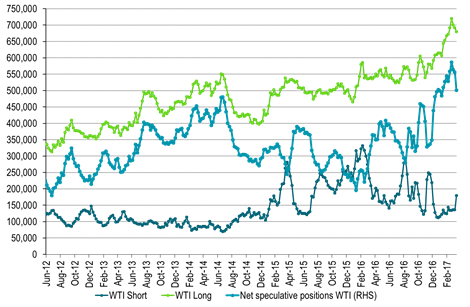
Ch4: Net long speculative WTI positions has pulled back but are still high
Now standing at 500,000 contracts or 500 million barrels.
Neutral level would be around 350 million barrels
Ch5: OPEC production at 32.16 mb/d in Feb and thus some 350 kb/d above its target.
Will OPEC compliance fall apart if it becomes increasingly clear that there will be no cuts in H2-17?
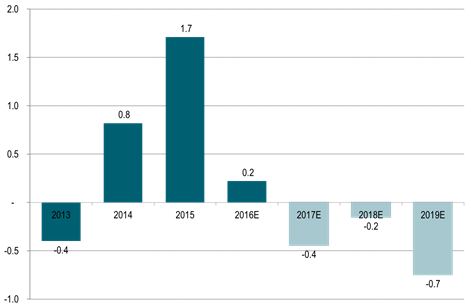
Ch6: We still expect a deficit the next three years despite strong US production growth
The balance assumes no OPEC cuts after H1-17
Ch7: Due to current high OECD inventories the global oil market is fine all through 2017 and 2018.
Not a lot of pressure points to be seen before 2019
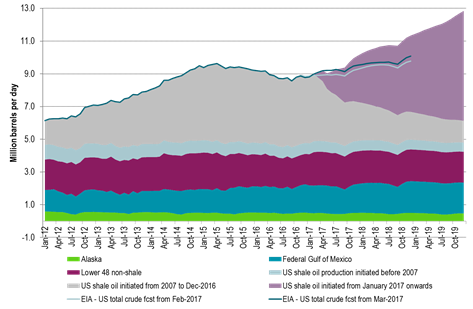
Ch8: And yes, we are bullish US crude oil production but even more than that is needed in 2019
Then it all boils down to “too little too late” or “too much too soon”.
The US EIA is lifting its prognosis every month all since last July.
We expect them to continue to do that going forward as well as the EIA prognosis is still way behind the curve in our view.
Kind regards
Bjarne Schieldrop
Chief analyst, Commodities
SEB Markets
Merchant Banking