

Analys
US crude oil 2018 production forecast by EIA still too low

 Price action – Higher on Nigeria strike, Fortis pipeline outage, lower oil rig count, softer USD and positive equities
Brent crude is gaining 0.9% this morning as it climbs to $63.8/b along with a 0.2% softer USD index and positive equity gains. A part of the positive oil price drive today is the Nigerian oil union declaring a strike as they protest against unfair labour practices thus posing a risk to Nigeria’s production of 1.7 mb/d. The Fortis pipeline carrying xxx kb/d is still off-line with the operator declares force majeure as it expects repairs of the hairline will take some 2-4 weeks. The key concern is that there might be a wider problem stretching along the whole pipeline. If the reason for the current crack is the higher sulphur content in the Buzzard crude flowing in the Fortis crude stream and sulphide corrosion as a consequence of this then the outage of the pipe could be much, much longer. The pipe carries some 450 kb/d and thus a major share of the physical supply into the Brent spot market. A decline of 2 US oil rigs last week adds some support on the margin.
Crude oil comment – US crude oil 2018 production forecast by EIA still too low
Later today we’ll have the monthly update from the US EIA on shale oil drilling productivity in the US. We expect the EIA to revise its productivity as well as its production higher. Their last productivity report had data points to Dec 2017. We expect the EIA to show that the strong production growth of on average 91 kb/d/mth from July to December this year stays intact at around 90 kb/d/mth also in January and also that well completions continued to rise also in November as they have done every month since January this year.
We do not think that the EIA update later today will necessarily hit the Brent crude oil price bearishly. More likely we expect the Brent to WTI price spread to widen further on the back of such news.
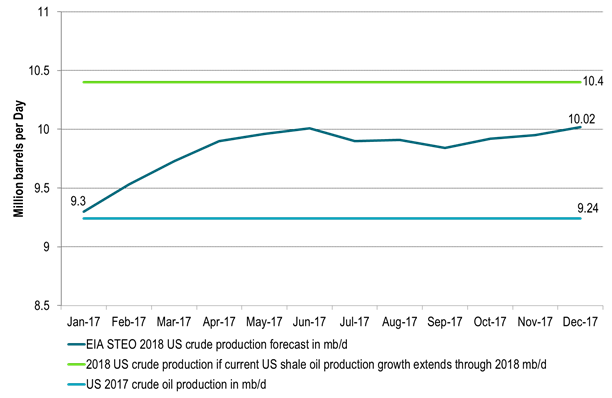
The US EIA last Tuesday adjusted its 2018 forecast for US crude oil production upwards from 9.95 mb/d to an average of 10.02 mb/d thus growing 0.78 mb/d y/y to 2018. The increase in forecast of 70 kb/d was the third upwards revision in three months. We still think that the US EIA is significantly behind the curve in terms of its projections for US crude oil production for 2018. As such we expect the US EIA to continue to revise its projection for 2018 higher in the months to come until it reaches at least an average crude oil production of around 10.4 mb/d for 2018.
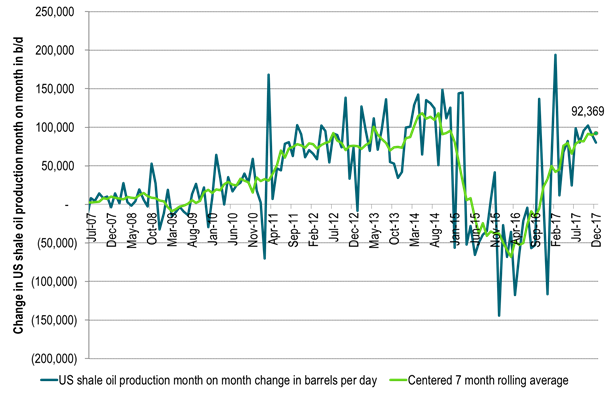
US shale oil production growth is currently running at some 90 kb/d/mth. That is the exit shale oil growth rate for 2017 while the average growth rate from July to December has been 91 kb/d/mth. The implied marginal, annualized production growth rate is thus currently running at 1.1 mb/d/yr. The US EIA is however assuming that US shale oil production will only grow by some 37 kb/d/mth in 2018. That is 40% lower than the current growth rate in shale oil production. From Dec-17 to Dec-18 the EIA projects that US lower 48 (ex GoM) will grow by only 440 kb/d. If we instead apply the current 90 kb/d/mth growth rate through 2018 then L48 ex GoM would grow by 1.1 mb/d from Dec-17 to Dec-18.
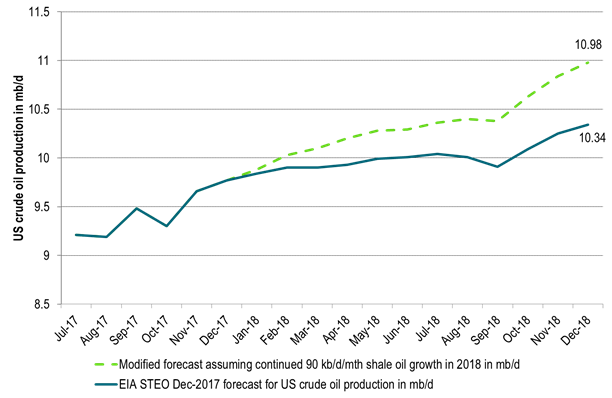
If we extrapolate the current shale oil production growth rate through 2018 it would lead US crude oil production to exit 2018 at 11 mb/d versus EIA’s forecast of 10.34 mb/d. If we include NGLs, Bio-fuels and refinery gains it would lift total US liquids production to close to 18 mb/d in December 2018 and drive total US liquids production growth to 1.7 mb/d y/y Dec-17 to Dec-18.
US shale oil well completions is still rising (+35 wells m/m in October), the drilled but uncompleted numbers of wells is still rising and oil prices have been on a constant trend upwards since mid-June . So if anything the current trend is for stronger US shale oil production growth month/month in the months ahead and not at all the sudden drop-off in shale oil production growth which the EIA predicts for 1Q18 where they expect a monthly average growth rate of only 23 kb/d/mth.
We think that one of the key reasons for why the US EIA has a too low production growth target for 2018 is due to the build-up in the DUC (Drilled but uncompleted wells) inventory which gives an impression of declining shale oil volume productivity. This decline in volume productivity is in our view not real. In our calculations we see US shale oil volume drilling productivity has continued to tick higher even though now mostly sideways. But at least we do not see productivity in decline as the official headline numbers indicate.
There is a lot of focus on a shift in investor focus from rewarding production growth and now instead demanding profits. This could possibly change shale oil producer behaviour and as such lead to softer US shale oil production growth than indicated above.
In our view such a shift should primarily hit drilling rather than completions as the shale oil companies have a huge stack of uncompleted wells which they can convert to oil and money in 2018. They can ease back on the drilling and continue to ramp up completions. Completions have been trailing drilling for a full year now. If shale oil companies pull back on investments then this should switch around in 2018 to a situation where drilling is lower than completions while spending on completions continues at a high level and drilling at a lower. Completions in 2018 could run some 20% above the Jan to Oct average completion level of 2017.
In terms of capex spending we had news last week that Keane Group, one of the largest pure-play providers of US shale completion services yesterday announced that they will order three new frac fleets on top of their existing 26. The order is a response to robust 2018 US shale oil investments announced latest weeks. Completions are the thing for 2018 which means more shale oil production.
Ch1: US shale oil production growth is exiting 2017 at a rate of about 90 kb/d/mth (1.1 mb/d on a marginal annualized rate)
It is now growing as strongly as it did through 2012 and 2013
Ch2: If US shale oil production grows in 2018 as it exits 2017 (~90 kb/d/mth) then total US crude production will grow by 1.1 mb/d y/y to 10.4 mb/d y/y
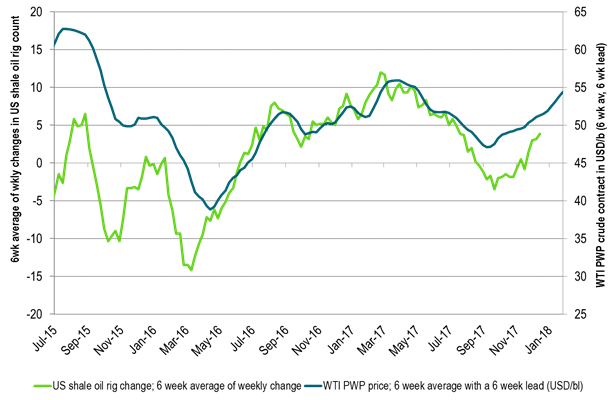
Ch3: The Production Weighting Price (PWP) of a new shale oil well with a 6 week lead has moved higher since Sep
If history is anything to go by then US shale oil action will increase in response. Drilling and or completions
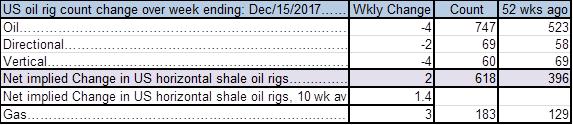
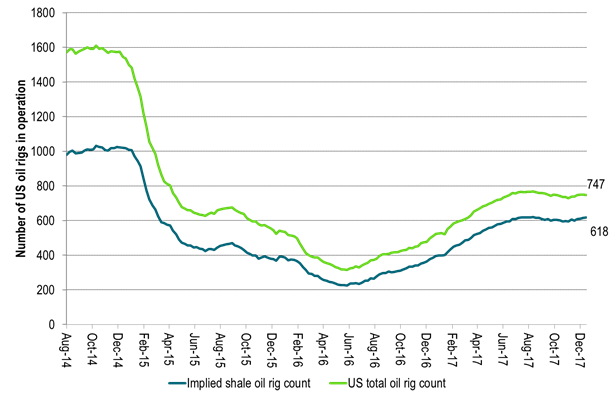
Ch4: US oil rig count moved down 4 last week but implied shale oil rigs increased by 2
US oil rig count is up by 22 over the last 5 weeks which is 17 rigs shy of the level in August
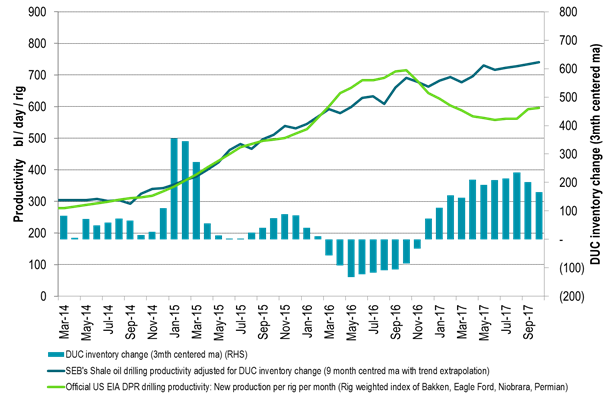
Ch5: The mirage of declining shale oil productivity created from the large build-up in DUCs (uncompleted wells)
The official US shale oil productivity was running higher than our estimate during the DUC draw down in 2016.
It is running way below our productivity estimate in 2017 during a huge build up in the DUC inventory during 2017.
As the DUC inventory eventually draws down the official productivity will again be running above our estimate
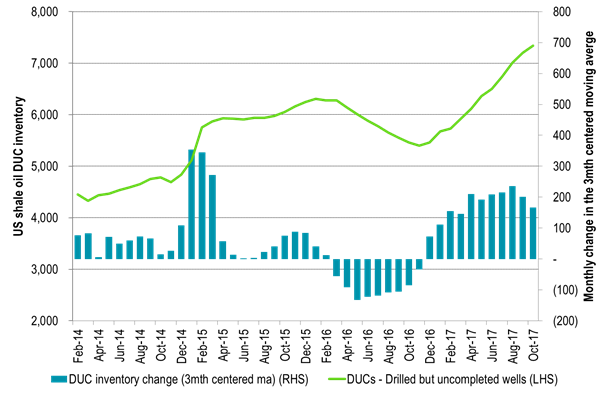
Ch6: A lot of uncompleted wells to complete in 2018!!
The DUC inventory was still BUILDING in October (the last data point)
So drilling new wells can decline a lot in 2018 while completions can increase some 20% y/y
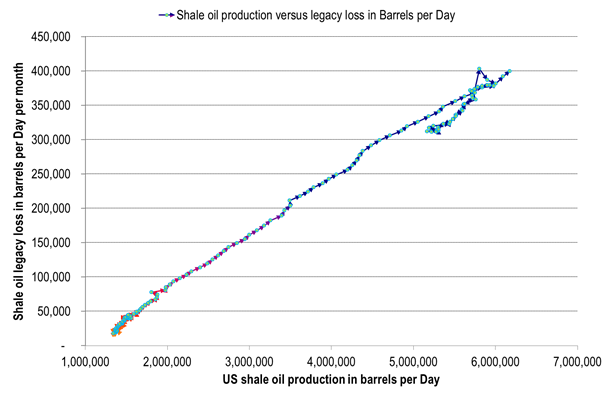
Ch7: No top-down sign that US shale oil resources are deteriorating as losses in existing production stays on scale to production level
No top-down sign as of yet of run-away losses in existing production versus production level
Ch8: US EIA crude oil production forecast likely to be lifted further up towards 10.4 mb/d
EIA lifting it forecast 3 mths in a row
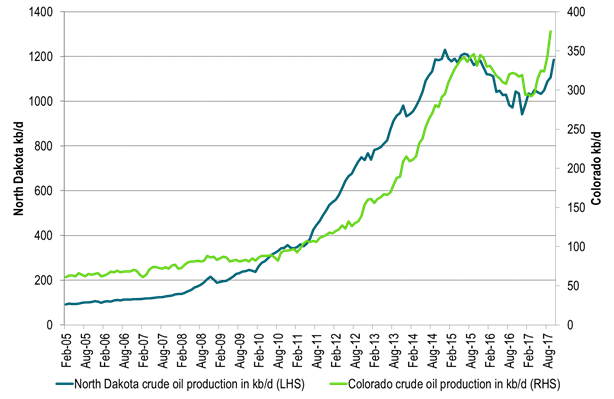
Ch9: Volume wise there are good shale oil days in both Colorado and Bakken North Dakota these days
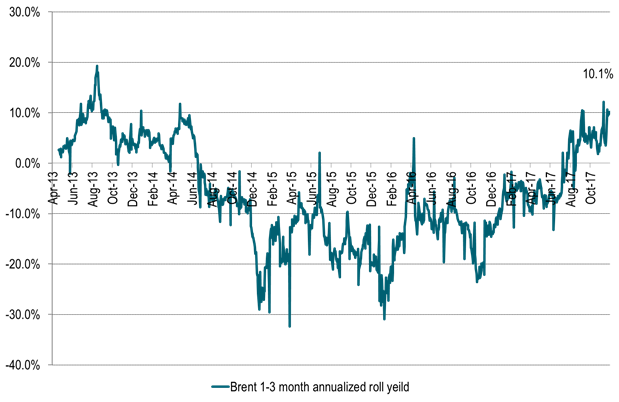
Ch10: Annualized 1-3 mth Brent backwardation fully funded roll-yield of 10% pa
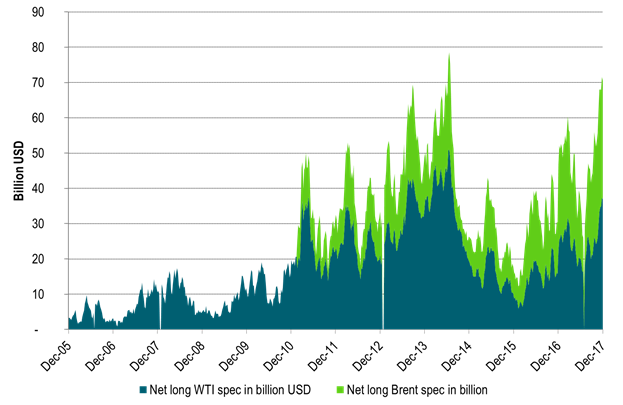
Ch11: The positive roll-yield in Brent continues to suck in more long spec into both Brent and WTI front end crude’
Kind regards
Bjarne Schieldrop
Chief analyst, Commodities
SEB Markets
Merchant Banking
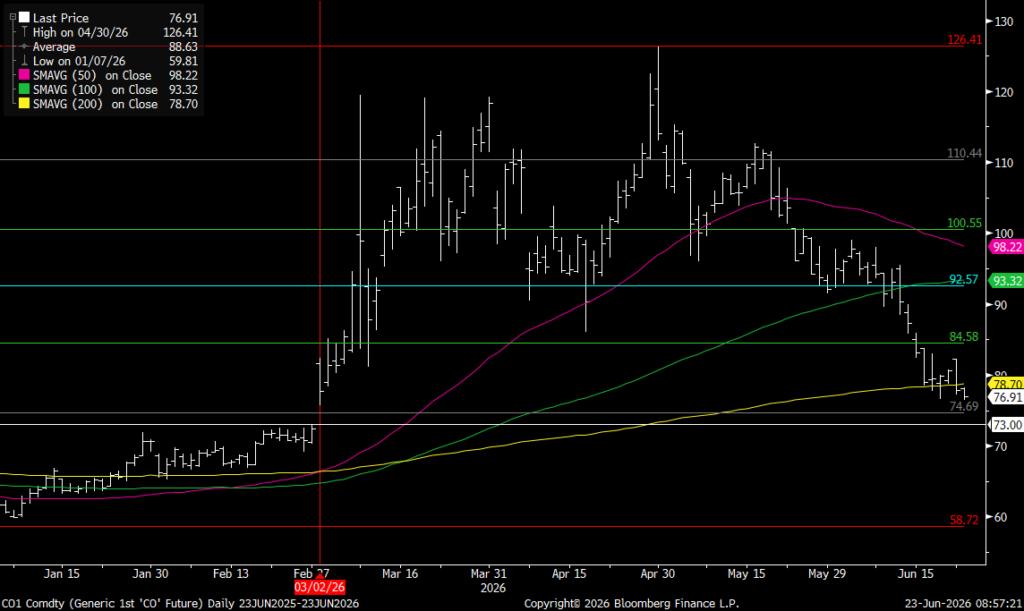
Brent M1 moving below the 200 dma of $78.7/b. Brent crude continued its move lower yesterday with a decline of 3.3% to $77.9/b. This morning it is adding another drop of 1.4% to $76.8/b. Israel bombing Lebanon during the weekend was a violence of the MoU and Iran was quick to declare the SoH closed again. But the willingness to move forward by both the US and Iran obviously trumped the bombing in Lebanon making the event more of a hiccup on the road of further negotiations.

The US has now waived sanctions against Iranian oil exports for two months allowing Iran to sell its oil all over the world, though sanctions instated in Europe will take more time to unwind. Oil from Iran, Russia as well as Venezuela can for the time being be sold across the world without any sharp discount due to sanctions. Chinese Tea-pot refineries will suffer as they previously could buy rebated crude while selling products at market prices.
Crude oil is no flowing out of the SoH with latest number close to 7 mb/d on a three day moving average. That is still well below the 14 mb/d of crude and 6 mb/d of products normally flowing out of the SoH. Latest estimate is that there is around 80 mb of crude on water inside the Persian Gulf and maybe another 80 mb of oil products on water as well. If crude is exiting the SoH at a rate of around 7 mb/d, then the 80 mb of crude would be depleted within 10-15 days and there after the flow would rely on new crude tankers entering, loading and then exiting the SoH to continue further flows. Given the uncertainties surrounding the status of the SoH with Iran stating that it was closed again as recent as this weekend, there is likely an asymmetry here where ships and oil stranded in the SoH for months are much more eager to exit than new ships are eager to enter.
For now Brent crude keeps falling like a rock with the front-end Brent contract now only trading at a premium of $7.6/b above the five year contract. Quickly heading towards parity. The Brent M1 contract has now broken below its 200 dma of $78.7/b and is closing in on the Fibo-level at $74.7/b. Below that there is not much more supporting levels to be found before $73/b which would close the gap from February 3.
Brent crude M1 technical levels
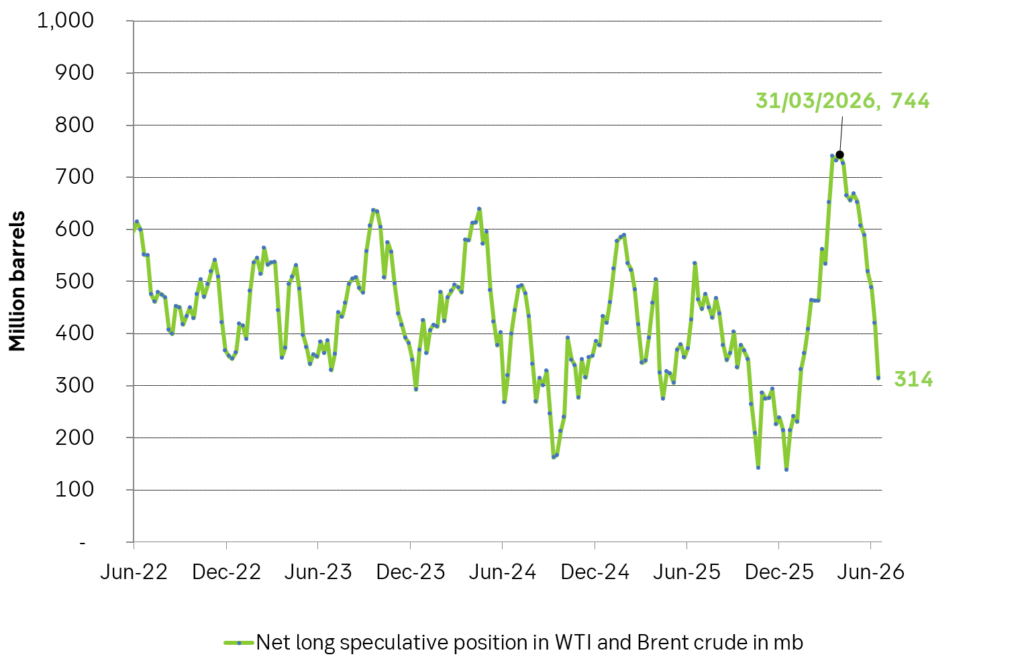
Net long speculative positions are also falling like a rock and as of Tuesday last week the net long positioning in Brent and WTI together summed to 314 million barrels and falling fast.
Will there be a rebound? A possible combination could be an exhaustion of the oil blob caught within the SoH within 1-2 weeks if exits continue at current rate while new ships entering are much more cautious, more Israeli bombardments in Lebanon as Netanyahu fights for re-election, a temporary closure of the SoH again while speculative short positions take cover buying back and covering their positions.
US and Israeli stands versus Iran could harden beyond elections so 2027 surplus is far from given. But Iran and the US are all in all moving towards a set of solutions with both clearly eager to reopen the SoH and keep it open. And that is what the market is pricing along with sharply falling prices. The ongoing discussions will likely take months and last beyond both the upcoming Israeli election (before 27 oct) and the US midterm elections on 3 Nov. Beyond those dates the stance by both Israel and the US may harden again versus Iran. But Iran knows that and is most likely preparing for such a hardening turn. Thus a surplus of oil and global oil stock rebuilding in 2027 (as now is mostly projected) is far from given.
Selling down on a ”deal”. Brent crude fell 6.2% last week with accelerated weakness towards the end of the week. Close of the week at $87.33/b and low of the week (and on Friday) of $85.8/b. Brent is falling another 4% this morning to $83.7/b on confirmation by Iran that a MoU text has been reached and that it will be signed on Friday this week.
So what is this ”deal” worth? Talk on the desk here this morning is that it is much like ”putting lipstick on a pig” where Trump has to sell this at home as a victory where ”the SoH has reopened”, the nuclear issue will be ironed out over the coming 60 days (or maybe 600 days?) and US consumers are getting a lower gasoline price and maybe US republicans survives the midterm elections.
The importance for Iran is that it emerges as the defacto winner of this war in the eyes of the non-US public world. That Iran now onwards is the ”ruler of the SoH” (combo of geography and new weapons systems like drones) or more softer: ”the guarantor of safe passage through the SoH”.
Iran doesn’t need nuclear weapons any more. Nuclear deterrence doesn’t work any more. Ukraine has made many attacks deep into Russia without being nuked in return. Plenty of Iranian ballistic rockets blasts over Israel but Iran wasn’t nuked in return.
There is no trust between the US and Iran. We don’t know all the details yet of the MoU. But what we do know is that there is no trust between the US and Iran what so ever. This is probably more like a descriptive text on how they can cooperate in a way where both sides keeps tactical leverage. Neither side makes irreversible concessions. Violations can be punished quickly. Cooperation produces immediate benefits.
This is a fragile structure. It can easily break down. There may be details which cannot be overcome. To be seen on Friday. The US has to show that it is willing put enough force behind managing and restraining Israel versus Hezbollah in Lebanon. We have seen that Netanyahu hasn’t listened all that much to Trump’s directives and wishes. This could be a major obstacle.
A gradual reopening is tactically preferable for Iran. A tactical leverage for Iran right now is that global oil stocks have been drawn down towards painful and increasingly dangerous levels with increasing risks for oil price spikes in mid-July to August. This together with US midterm elections on 3 November gives tactical leverage to Iran. Iran probably doesn’t want to fully give up on that leverage. A rapid, full reopening where global stocks are able to refill over the coming 60 days will significantly erode that leverage. If Iran reinstates a closure of the SoH after 60 days (if talks break down again), then the effect won’t be that impactful in terms of prices and the US midterm elections.
So a gradual and partial reopening where global markets gets the oil they need while they are unable to rebuild stocks could be a practical middle way for both parties. Trump can sell it as ”the SoH has reopened” and get affordable gasoline for US consumers. Iran can sell it as ”the SoH has fully reopened, but there is some friction” so flow is only 60-80% of normal.
Not much real demand destruction below $100/b. What we do know is that there is not much real price pain demand destruction for oil globally at an oil price below $100/b. A lot of demand-shock destruction. Fear. But demand should now come roaring back towards normal with fear for exceptionally high prices now is rapidly receding.
Sudden China demand destruction due to EVs? Bullocks. EV share of total Chinese carpool now around 13%. Share of new sales of EVs has reached 50%. This is a very gradual process. It doesn’t make oil demand fall like a rock over night. When EV new sales share reaches 100%, then the gasoline car pool will contract by some 5-10% per year. But that is only gasoline. Sudden reduction in Chinese oil demand is more about shock and risk.
Chinese crude oil imports will come roaring back. At what price? Today’s ”neutral” oil price is $70/b. That is the five year price which has steadily traded around the $70/b mark over the past 3-4 years. With still a risky picture one would think that China and the rest of the world will be big buyers of oil in the range of $70-85/b.
Global demand will likely snap back towards normal, forecasted demand and growth at such prices.
Physical reopening is a gradual process. The physical and practical reopening of the SoH will likely be gradual rather than sudden. And that probably suites Iran tactically as well.
Brent M1 price versus the Brent 5-yr (today’s ”normal” price)

Market is starting to take US/Iran headlines with a pinch of salt. Brent crude rose $2.8/b yesterday to an official close of $112.1/b. But after that it traded as low as $108.05/b before ending late night at around $109.7/b. Through the day it traded in a range of $106.87 – 112.72/b amid a flurry of news or rumors from Iran and the US. ”US temporary sanctions during negotiations” (falls alarm). ”We will bomb Iran” (not anyhow),… etc. While the market is still fluctuating to this kind of news flow, it is starting to take such headlines with a pinch of salt.
We’ll see. Maybe, maybe not. The Brent M1 contract is trading at $110.2/b this morning which very close to the average ticks through yesterday of $110.4/b.
Trump with bearish, verbal intervention whenever Brent trades above $110/b it seems. What seems to be a pattern is that Trump states something like ”very good negotiations going on with Iran”, ”New leaders in Iran are great,..”, ”Great progress in negotiations,…”, ”Deal in sight,..” etc whenever the Brent M1 contract trades above $110/b. An effort to cool the market. These hot air verbal interventions from Trump used to have a heavy bearish impact on prices, but they now seems to have less and less effect unless they are backed by reality.
As far as we can see there has been no real progress in the negotiations between the US and Iran with both sides still standing by their previous demands.
Iran is getting stronger while the cease fire lasts making a return to war for Trump yet harder. Iran is naturally in constant preparation for a return to war given Trump’s steady threats of bombing Iran again. Iran is naturally doing what ever is possible to prepare for a return to war. And every day the cease fire lasts it is better prepared. This naturally makes it more and more difficult and dangerous for the US to return to warring activity versus Iran as the consequences for energy infrastructure in the Persian Gulf will be more and more severe the longer the cease fire lasts. Israel seems to see it this way as well. That the war is not won and that current frozen state of a cease fire gives Iran opportunity to rebuild military and politically.
Global inventories are drawing down day by day. How much? In the meantime the Strait of Hormuz stays closed. There is varying measures and estimates of how much global inventories are drawing down. Our rough estimate, back of the envelope, is that global inventories are drawing down by at least some 10 mb/d or about 300 mb/d in a balance between loss of supply versus demand destruction. Other estimates we see are a monthly draw of 250-270 mb/d. The IEA only ’measured’ a draw in global observable stocks of 117 mb in April with oil on water rising 53 mb while on shore stocks fell 170 mb. But global stocks are hard to measure with large invisible, unmeasured stocks. As such a back of the envelope approach may be better.
Oil products is what the world is consuming. Oil product prices likely to rise while product stocks fall. Strategic Petroleum Reserves (SPR) are predominantly crude oil. Discharging oil from OECD SPR stocks, a sharp reduction in Chinese crude imports and a reduction in global refinery throughput of 6-7 mb/d has helped to keep crude oil markets satisfactorily supplied. But global inventories are drawing down none the less. And oil products is really what the world is consuming. So if global refinery throughput stays subdued, then demand will eventually have to match the supply of oil products. The likely path forward this summer is a steady draw down in jet fuel, diesel and gasoline. Higher prices for these. Then, if possible, higher refinery throughput and higher usage of crude in response to very profitable refinery margins. And lastly sharper draw in crude stocks and higher prices for these. But some 6 mb/d of oil products used to be exported through the Strait of Hormuz. And it may not be so easy to ramp up refinery activity across the world to compensate. Especially as Ukraine continues to damage Russian refineries as well as Russian crude production and export facilities.
Watch oil product stocks and prices as well as Brent calendar 2027. What to watch for this summer is thus oil product inventories falling and oil product premiums to crude rising. Another measure to watch is the Brent crude 2027 contract as it rises steadily day by day as the Strait of Hormuz stays closed and global oil inventories decline. The latter is close to the highest level since the start of the war and keeps rising.
The Brent M1 contract and the Brent 2027 prices and current price of jet fuel in Europe (ARA). All in USD/b

Our back of the envelope calculation of the global shortage created by the closure of the Strait of Hormuz. Note that 3.5 mb/d of discharge from SPR is also a draw. Note also that ’Forced demand loss’ of 2.5 mb/d is probably temporary and will fall back towards zero as logistics are sorted out leaving ’Price demand loss’ to do the job of balancing the market. Thus a shortfall of at least 9 mb/d created by the closure. More if SPR discharge is included and more if Forced demand loss recedes.


Brent falling like a rock with oil likely to flow from SoH until at least 3 November

Vattenfalls och Industrikrafts kärnkraftsbolag Videberg Kraft har valt Rolls-Royce SMR
Selling down on a ”deal”

Sommarväder skapar prisrally på elbörsen
Oil product price pain is set to rise as the Strait of Hormuz stays closed into summer
Sommarväder skapar prisrally på elbörsen
Vattenfalls och Industrikrafts kärnkraftsbolag Videberg Kraft har valt Rolls-Royce SMR
Selling down on a ”deal”
Brent falling like a rock with oil likely to flow from SoH until at least 3 November
-
Nyheter3 veckor sedan
Sommarväder skapar prisrally på elbörsen
-
 Nyheter1 vecka sedan
Vattenfalls och Industrikrafts kärnkraftsbolag Videberg Kraft har valt Rolls-Royce SMR
-
Analys1 vecka sedan
Selling down on a ”deal”
-
Analys6 timmar sedan
Brent falling like a rock with oil likely to flow from SoH until at least 3 November