

Analys
Trade war today and oil market balance tomorrow


Brent crude lost 7.2% and closed at $60.5/bl with also the three year contract loosing 4% with a close of $56.02/bl. Neither equities nor oil were satisfied with ”mid-cycle rate adjustment” cut by the Fed earlier in the week and were already on a weak footing. Yesterday’s announcement/tweet by Donald Trump that an additional $300 bn worth of trade with China would get a 10% import levy totally pulled the plug on oil.
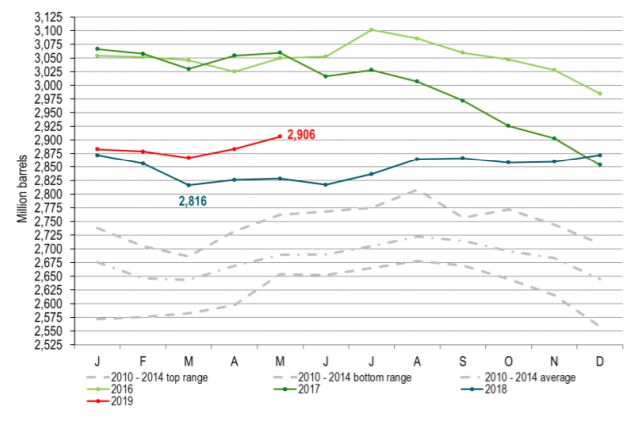
The thing is that the global oil market balance is not too bad right now and so far this year. IEA announced in its July Oil Market Report that OECD oil inventories had been rising during the first part of the year. It is true that the OECD inventories are up 34 m bl in May versus December last year but normally (2010 to 2014 average) they increase 45 m bl during this period. So if inventories are the proof of the pudding then the global oil market was pretty much in balance from Jan to May this year. Since then the US crude oil inventories have fallen sharply and the Brent crude oil forward curve is still in backwardation signalling a market which is on the tight side of the scale.

The sell-off yesterday is thus about concerns for the oil market balance for tomorrow, for next year and not so much for the current balance and the balance in 2H-19.
The forward Brent crude oil curve is still in backwardation, US crude inventories have been falling sharply since early June and continue to do so, US shale oil production growth is slowing quite sharply, European overall spot refining margin is close to the highest level over the past 2-3 years, OPEC+ is cutting and supply from Iran and Venezuela is just plunging.
Thus the bearish take on oil is not so much coming from the front end (spot) of the oil market. It is all about slowing global growth, slowing oil demand growth, US-China trade war, too little proactive stimulus from the US Fed and deep concerns for the oil market balance of tomorrow.
If we remember correctly Saudi Arabia commented earlier this summer that it might be difficult to cut yet deeper in 2020 than what they are doing now. So if the oil market is running a surplus in 2020 then the oil price and not OPEC+ will have to do the job of balancing the market.
If we look at where oil prices are trading on the forward curve it is very clear that the main job of the oil prices at the moment is about holding US shale oil production growth in check. The three year WTI price yesterday closed at $50.12/bl while the three year Brent crude oil contract closed at $56/bl. Thus the oil price right now is all about controlling US shale oil production growth.
Four new pipelines channelling oil out of the Permian will come on-line in 2H-19 and early 2020 with a total capacity of 2.3 m bl/d. What this mean is that local Permian oil prices will move much closer to US Gulf seaborne oil prices and Brent crude oil prices. Oil will be drained out of the Permian and allow Permian oil producers to ramp up production without crashing the local Permian oil price. The flow of oil from Permian to Cushing Oklahoma on the Sunrise pipeline will slow to a halt. US Cushing stocks will decline much more easily and the WTI Cushing price will also move closer to Brent crude.
So, again, will WTI move up to Brent or will Brent move down to WTI when the pipelines open up? The 670 Cactus II from Permian to Corpus Christi at the US Gulf opened for service on 1 August. Since one year ago the Brent June 2020 contract has declined by $10.2/bl while the comparable WTI contract has declined by only $7.5/bl and the spread between the two has declined from $8.5 to now $5.8/bl. So over the past year at least we see that it is the Brent contract which has moved down to the WTI price and not the WTI price which has moved up to the Brent price. The interim transportation cost on the Epic II pipeline has been lowered from $5/bl to only $2.5/bl and pipelines from Cushing to US Gulf are lowering tariffs in competition. In a slowing shale oil production growth situation coupled with a large increase in pipeline capacity we should expect to see a further strong convergence between the Brent crude oil price curve and the WTI price curve. In general the Brent prices should move down to the WTI prices but the initial reaction will be declining US crude oil inventories both in general and in Cushing Oklahoma. This will drive WTI prices higher initially and drive the WTI crude curve into full backwardation.
The only reconciliation we can envisage for an oil market where the current situation is tight, refinery margins are strong and IMO 2020 is coming on top coupled with deep rooted market concerns for the oil market balance for 2020 is very weak 2020 forward prices together with spiky and backwardated front end prices. So expect WTI curve into full backwardation (strong spot prices), weak 2020 prices and tighter Brent to WTI spreads with forward Brent prices moving down towards the WTI prices.
Ch1: Rising OECD inventories by IEA. But those rises are very close to normal seasonal trends. From Jan to March inventories usually drop by 32 m bl (2010 to 2014 average seasonal trend). This year they only dropped by 16 m bl. From March to May however they normally increase by 46 m bl while this year they only increased by 39 m bl. In total from Jan to May they normally increase by 14 m bl while this year they increased by 23 m bl. So yes OECD inventories increased by 9 m bl more than the seasonal trend from Jan to May. That is pretty close to noise as it gets. So if OECD inventories are anything to go by we’d say that the OECD-inventory implied supply/demand balance was pretty much in balance from Jan to May
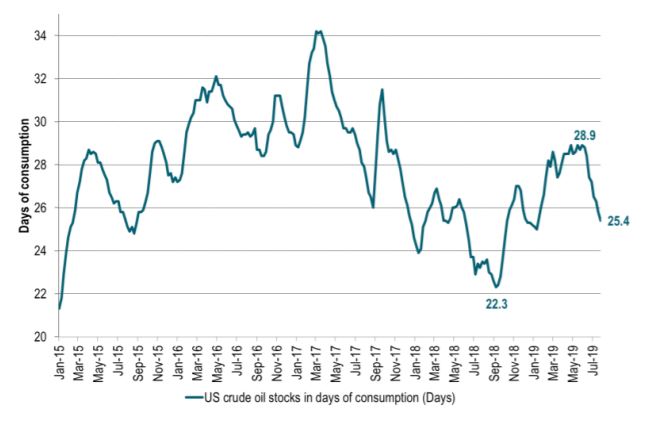
Ch2: US crude stocks have fallen sharply since early June. Here seen in days of consumption where it has fallen from 28.9 days to only 25.4 days in the latest data. We expect US crude inventories to fall further
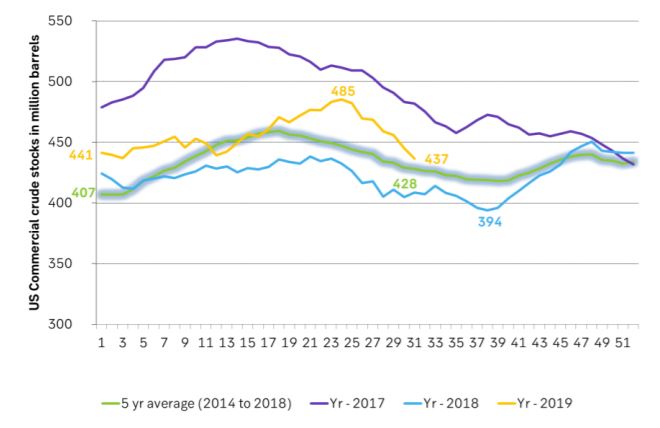
Ch3: US crude oil stocks in barrels have fallen sharply since early June and now only stands some 9 m bl above the 5 year average. Also if we look at total US crude, middle distillates and gasoline we see that these US inventories in total are only 9 m bl above normal (2014 – 2018).
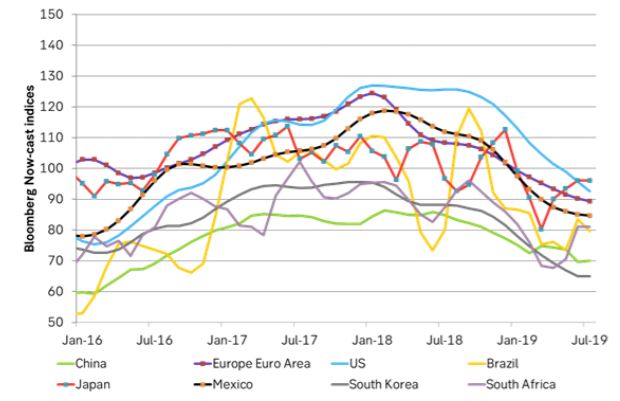
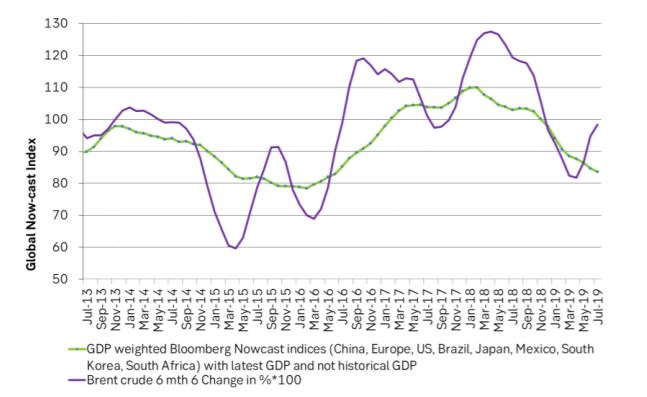
Ch4: What worries the market is this: Global economic growth and thus oil demand growth. Here depicted through the lense of Bloomberg’s calculated now-cast indices. What stands out here is that it is worse in the rest of the world than in the US but maybe more importantly that the US economy now is cooling faster than the rest of the world. Though this is a very qualitatively assesment from the graph. This week’s quarter percent US Fed rate cut is probably far too little to counter this cooling trend.
Ch5: Agregating Bloomberg’s individual country now-cast indices to one “global now-cast” index shows that the global economy is cooling and cooling and will soon be down to the trough in 2015/16. Graphing this global index versus the Brent crude 6m/6m change in prices we see that from a demand/macro view point Brent has moved counter to the cooling macro trend and a deteriorating global demand back-drop. It has risen on the back of OPEC+ supply cuts and Iran issues.
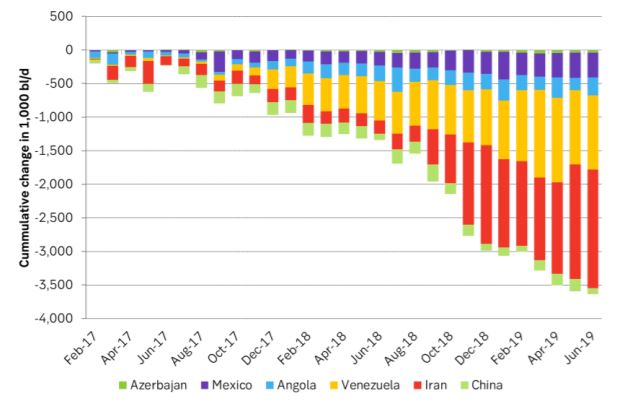
Ch6: Huge loss in supply from key producers since primo 2017 not enough to lift prices
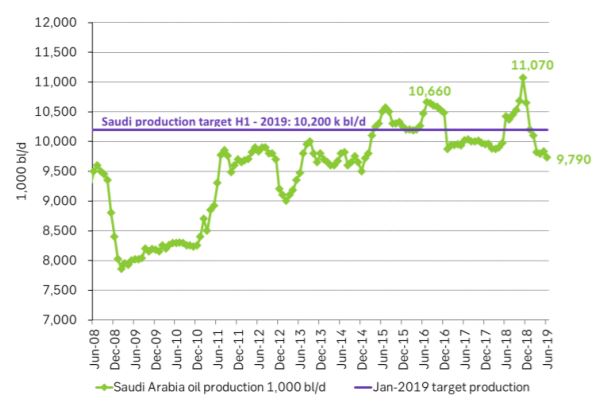
Ch7: Aggressive cuts by Saudi Arabia neither enough to lift prices. It is very hard to lift prices through production cuts amid a deteriorating global growth
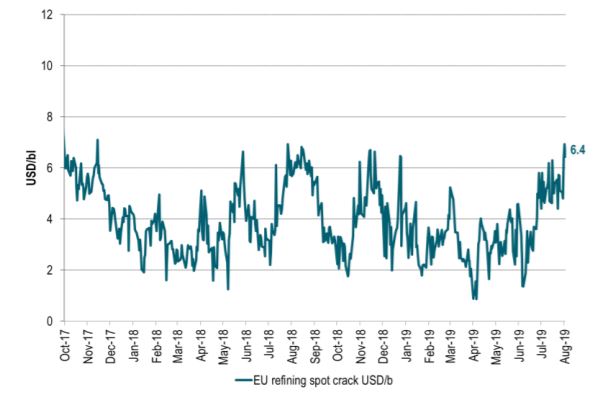
Ch8: European spot refining margins are very strong and close to the highest level over the last 2-3 years
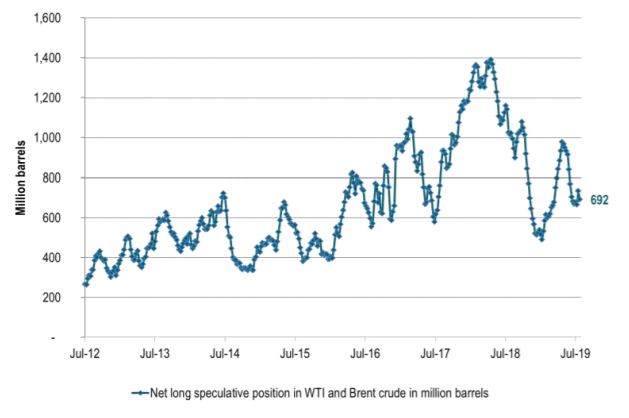
Ch9: Speculators are not feeling very bullish in the face of the deteriorating global macro picture
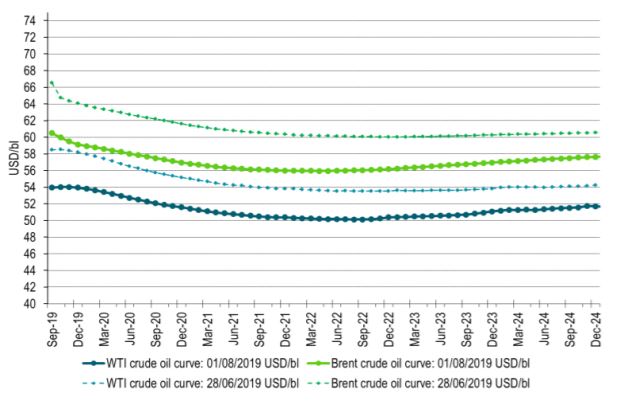
Ch10: Forward crude oil curves. Ydy close vs end of June. Brent down more than WTI. Brent is moving lower and closer to WTI.
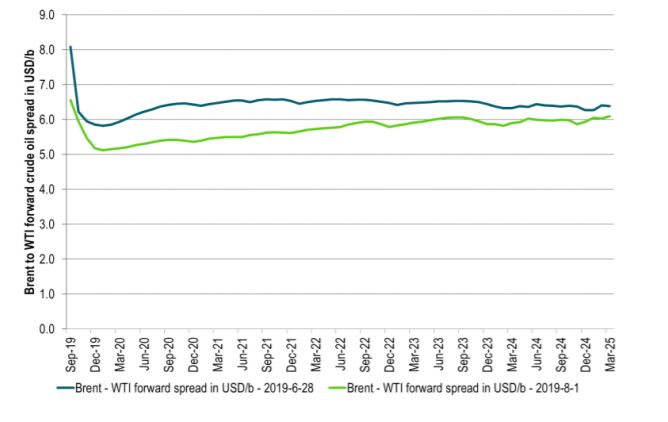
Ch11: Spreads between the forward crude oil curves have moved lower since late June
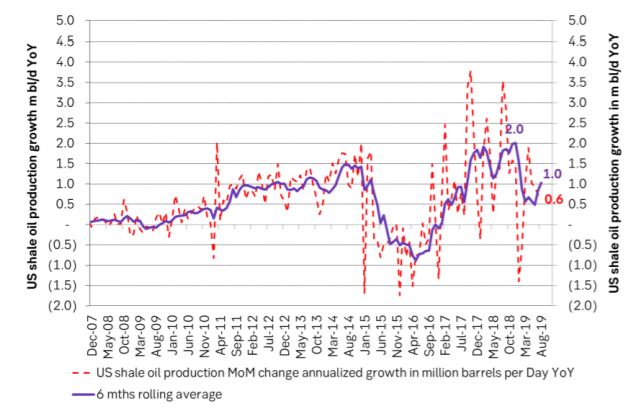
Ch12: US shale oil production growth has slowed to a growth rate of only 0.6 m bl/d on a marginal, annualized rate. Sharply down from around 1.5 – 2.0 m bl/d in 2017/18 period. Shale oil players are signalling further slowdown during the autumn. The shale oil well completion rate only needs to be lowered by some 100 to 200 wells per month in order to drive US shale oil production growth to close to zero
When it starts to move lower it moves rather quickly. Gaza, China, IEA. Brent crude is down 2.1% today to $62/b after having traded as high as $66.58/b last Thursday and above $70/b in late September. The sell-off follows the truce/peace in Gaze, a flareup in US-China trade and yet another bearish oil outlook from the IEA.

A lasting peace in Gaze could drive crude oil at sea to onshore stocks. A lasting peace in Gaza would probably calm down the Houthis and thus allow more normal shipments of crude oil to sail through the Suez Canal, the Red Sea and out through the Bab-el-Mandeb Strait. Crude oil at sea has risen from 48 mb in April to now 91 mb versus a pre-Covid normal of about 50-60 mb. The rise to 91 mb is probably the result of crude sailing around Africa to be shot to pieces by the Houthis. If sailings were to normalize through the Suez Canal, then it could free up some 40 mb in transit at sea moving onshore into stocks.
The US-China trade conflict is of course bearish for demand if it continues.
Bearish IEA yet again. Getting closer to 2026. Credibility rises. We expect OPEC to cut end of 2025. The bearish monthly report from the IEA is what it is, but the closer we get to 2026, the more likely the IEA is of being ball-park right in its outlook. In its monthly report today the IEA estimates that the need for crude oil from OPEC in 2026 will be 25.4 mb/d versus production by the group in September of 29.1 mb/d. The group thus needs to do some serious cutting at the end of 2025 if it wants to keep the market balanced and avoid inventories from skyrocketing. Given that IEA is correct that is. We do however expect OPEC to implement cuts to avoid a large increase in inventories in Q1-26. The group will probably revert to cuts either at its early December meeting when they discuss production for January or in early January when they discuss production for February. The oil price will likely head yet lower until the group reverts to cuts.
Dubai: The Mid-East anchor dragging crude oil lower. Surplus emerging in Mid-East pricing. Crude oil prices held surprisingly strong all through the summer. A sign and a key source of that strength came from the strength in the front-end backwardation of the Dubai crude oil curve. It held out strong from mid-June and all until late September with an average 1-3mth time-spread premium of $1.8/b from mid-June to end of September. The 1-3mth time-spreads for Brent and WTI however were in steady deterioration from late June while their flat prices probably were held up by the strength coming from the Persian Gulf. Then in late September the strength in the Dubai curve suddenly collapsed. Since the start of October it has been weaker than both the Brent and the WTI curves. The Dubai 1-3mth time-spread now only stands at $0.25/b. The Middle East is now exporting more as it is producing more and also consuming less following elevated summer crude burn for power (Aircon) etc.
The only bear-element missing is a sudden and solid rise in OECD stocks. The only thing that is missing for the bear-case everyone have been waiting for is a solid, visible rise in OECD stocks in general and US oil stocks specifically. So watch out for US API indications tomorrow and official US oil inventories on Thursday.
No sign of any kind of fire-sale of oil from Saudi Arabia yet. To what we can see, Saudi Arabia is not at all struggling to sell its oil. It only lowered its Official Selling Prices (OSPs) to Asia marginally for November. A surplus market + Saudi determination to sell its oil to the market would normally lead to a sharp lowering of Saudi OSPs to Asia. Not yet at least and not for November.
The 5yr contract close to fixed at $68/b. Of importance with respect to how far down oil can/will go. When the oil market moves into a surplus then the spot price starts to trade in a large discount to the 5yr contract. Typically $10-15/b below the 5yr contract on average in bear-years (2009, 2015, 2016, 2020). But the 5yr contract is usually pulled lower as well thus making this approach a moving target. But the 5yr contract price has now been rock solidly been pegged to $68/b since 2022. And in the 2022 bull-year (Brent spot average $99/b), the 5yr contract only went to $72/b on average. If we assume that the same goes for the downside and that 2026 is a bear-year then the 5yr goes to $64/b while the spot is trading at a $10-15/b discount to that. That would imply an average spot price next year of $49-54/b. But that is if OPEC doesn’t revert to cuts and instead keeps production flowing. We think OPEC(+) will trim/cut production as needed into 2026 to prevent a huge build-up in global oil stocks and a crash in prices. But for now we are still heading lower. Into the $50ies/b.
Some rebound but not much. Brent crude rebounded 1.5% yesterday to $65.47/b. This morning it is inching 0.2% up to $65.6/b. The lowest close last week was on Thursday at $64.11/b.
The curve structure is almost as week as it was before the weekend. The rebound we now have gotten post the message from OPEC+ over the weekend is to a large degree a rebound along the curve rather than much strengthening at the front-end of the curve. That part of the curve structure is almost as weak as it was last Thursday.
We are still on a weakening path. The message from OPEC+ over the weekend was we are still on a weakening path with rising supply from the group. It is just not as rapidly weakening as was feared ahead of the weekend when a quota hike of 500 kb/d/mth for November was discussed.
The Brent curve is on its way to full contango with Brent dipping into the $50ies/b. Thus the ongoing weakening we have had in the crude curve since the start of the year, and especially since early June, will continue until the Brent crude oil forward curve is in full contango along with visibly rising US and OECD oil inventories. The front-month Brent contract will then flip down towards the $60/b-line and below into the $50ies/b.
At what point will OPEC+ turn to cuts? The big question then becomes: When will OPEC+ turn around to make some cuts? At what (price) point will they choose to stabilize the market? Because for sure they will. Higher oil inventories, some more shedding of drilling rigs in US shale and Brent into the 50ies somewhere is probably where the group will step in.
There is nothing we have seen from the group so far which indicates that they will close their eyes, let the world drown in oil and the oil price crash to $40/b or below.
The message from OPEC+ is also about balance and stability. The world won’t drown in oil in 2026. The message from the group as far as we manage to interpret it is twofold: 1) Taking back market share which requires a lower price for non-OPEC+ to back off a bit, and 2) Oil market stability and balance. It is not just about 1. Thus fretting about how we are all going to drown in oil in 2026 is totally off the mark by just focusing on point 1.
When to buy cal 2026? Before Christmas when Brent hits $55/b and before OPEC+ holds its last meeting of the year which is likely to be in early December.
Brent crude oil prices have rebounded a bit along the forward curve. Not much strengthening in the structure of the curve. The front-end backwardation is not much stronger today than on its weakest level so far this year which was on Thursday last week.

The front-end backwardation fell to its weakest level so far this year on Thursday last week. A slight pickup yesterday and today, but still very close to the weakest year to date. More oil from OPEC+ in the coming months and softer demand and rising inventories. We are heading for yet softer levels.

Down to the lowest since early May. Brent crude has fallen sharply the latest four days. It closed at USD 64.11/b yesterday which is the lowest since early May. It is staging a 1.3% rebound this morning along with gains in both equities and industrial metals with an added touch of support from a softer USD on top.
What stands out the most to us this week is the collapse in the Dubai one to three months time-spread.
Dubai is medium sour crude. OPEC+ is in general medium sour crude production. Asian refineries are predominantly designed to process medium sour crude. So Dubai is the real measure of the balance between OPEC+ holding back or not versus Asian oil demand for consumption and stock building.
A sharp weakening of the front-end of the Dubai curve. The front-end of the Dubai crude curve has been holding out very solidly throughout this summer while the front-end of the Brent and WTI curves have been steadily softening. But the strength in the Dubai curve in our view was carrying the crude oil market in general. A source of strength in the crude oil market. The core of the strength.
The now finally sharp decline of the front-end of the Dubai crude curve is thus a strong shift. Weakness in the Dubai crude marker is weakness in the core of the oil market. The core which has helped to hold the oil market elevated.
Facts supports the weakening. Add in facts of Iraq lifting production from Kurdistan through Turkey. Saudi Arabia lifting production to 10 mb/d in September (normal production level) and lifting exports as well as domestic demand for oil for power for air con is fading along with summer heat. Add also in counter seasonal rise in US crude and product stocks last week. US oil stocks usually decline by 1.3 mb/week this time of year. Last week they instead rose 6.4 mb/week (+7.2 mb if including SPR). Total US commercial oil stocks are now only 2.1 mb below the 2015-19 seasonal average. US oil stocks normally decline from now to Christmas. If they instead continue to rise, then it will be strongly counter seasonal rise and will create a very strong bearish pressure on oil prices.
Will OPEC+ lift its voluntary quotas by zero, 137 kb/d, 500 kb/d or 1.5 mb/d? On Sunday of course OPEC+ will decide on how much to unwind of the remaining 1.5 mb/d of voluntary quotas for November. Will it be 137 kb/d yet again as for October? Will it be 500 kb/d as was talked about earlier this week? Or will it be a full unwind in one go of 1.5 mb/d? We think most likely now it will be at least 500 kb/d and possibly a full unwind. We discussed this in a not earlier this week: ”500 kb/d of voluntary quotas in October. But a full unwind of 1.5 mb/d”
The strength in the front-end of the Dubai curve held out through summer while Brent and WTI curve structures weakened steadily. That core strength helped to keep flat crude oil prices elevated close to the 70-line. Now also the Dubai curve has given in.

Brent crude oil forward curves

Total US commercial stocks now close to normal. Counter seasonal rise last week. Rest of year?

Total US crude and product stocks on a steady trend higher.


Guld och silver stiger hela tiden mot nya höjder
The Mid-East anchor dragging crude oil lower

Samtal om sällsynta jordartsmetaller, guld och silver

Brookfield köper bränsleceller för 5 miljarder USD av Bloom Energy för att driva AI-datacenter

Teck Resources kan förse Nordamerika och kanske hela G7 med all germanium som behövs

OPEC+ missar produktionsmål, stöder oljepriserna

Ett samtal om guld, olja, fjärrvärme och förnybar energi

Guld nära 4000 USD och silver 50 USD, därför kan de fortsätta stiga
Are Ukraine’s attacks on Russian energy infrastructure working?

Goldman Sachs höjer prognosen för guld, tror priset når 4900 USD
-
 Nyheter3 veckor sedan
OPEC+ missar produktionsmål, stöder oljepriserna
-
 Nyheter3 veckor sedan
Ett samtal om guld, olja, fjärrvärme och förnybar energi
-
 Nyheter2 veckor sedan
Guld nära 4000 USD och silver 50 USD, därför kan de fortsätta stiga
-
Analys3 veckor sedan
Are Ukraine’s attacks on Russian energy infrastructure working?
-
 Nyheter1 vecka sedan
Goldman Sachs höjer prognosen för guld, tror priset når 4900 USD
-

 Nyheter2 veckor sedan
Blykalla och amerikanska Oklo inleder ett samarbete
-

 Nyheter3 veckor sedan
Guldpriset uppe på nya höjder, nu 3750 USD
-
Nyheter2 veckor sedan
Ett samtal om guld, olja, koppar och stål