

Analys
Crude oil comment: The forward curve is pricing tightness today and surplus tomorrow

Brent crude ticks higher along with positive equity markets. Brent crude has been gradually ticking higher since its recent low close of USD 62.82/b on 8 April. Though 9 April was rather extreme with an intraday low of USD 58.4/b and a close the same day of USD 66.02/b. Brent is rising 1.4% this morning to USD 67.2/b along with higher equity markets in China and US equity futures (+1%). The daily fluctuations in Brent crude oil prices have been quite well aligned with fluctuations in equity prices which again are driven predominantly by the varying perceptions of how the US trade war with the world will progress and what the fallout will be.

Will Trump stay the course through economic pain or not? Will Donald Trump continue head-on, or will he pull back as pain emerges? It is clear that economic pain and damage will follow from what Donald Trump has done so far. That is already priced in. The big question though is whether he will stubbornly carry on or not. This looks like a ”game of chicken” where the question is who will blink first. Donald Trump or Xi Jinping? Will Donald Trump back off as US consumer-pain rockets and US economic activity falters or will he stay the course? Markets are highly conflicted on this as Trump has been extremely mercurial before and can suddenly change course. If he chooses to stay the course, without flinching, then obviously there is more downside to come. The current impression is that Trump is aiming for major changes and is willing to endure pain to achieve them.
Brent crude has taken direction from equity markets (here the US Russel 2000 index in orange) as it is a barometer of how bad the fallout from the tariffs will be on global growth and oil demand growth. The Russel 2000 is as of yesterday.

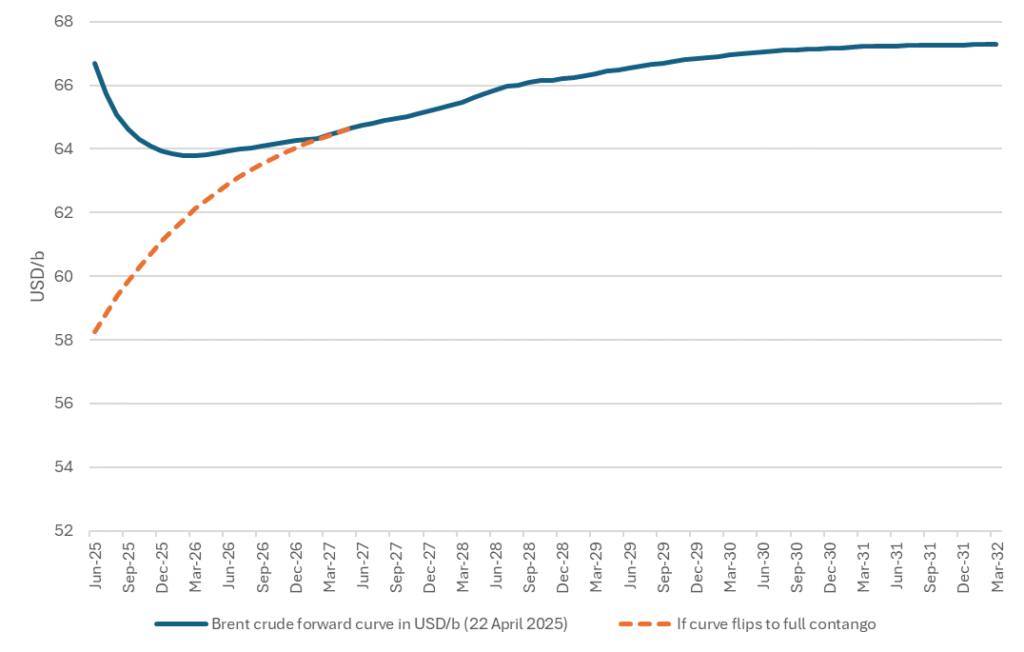
The Brent crude forward curve is pricing tightness and surplus at the same time. The Brent crude forward curve is currently pricing two things at the same time:
1) Supply/Demand is tight here and now (front-end backwardation)
2) But also, that surplus is coming (contango further out)
If the market is right, i.e. that surplus is coming, that Donald will continue head on with what he is doing, then the forward Brent curve will likely shift to full contango with the front-end of the Brent crude oil curve dipping into the 50ies. The big question is of course whether Donald Trump will carry head on without flinching or not. Staying the course through the coming economic pain.
Current Brent crude oil forward curve and how it could shift to full contango if the market shifts to surplus and stock building.

Last week’s oil price action distorted by rolling of the November contract last week. The December Brent crude oil contract rose $4.8/b, or 5% last week. Much of that gain was due to the roll-yield as the November contract rolled off as the M1 contract to be replaced by the Dec-26 contract. The backwardation between the Nov and the Dec contract averaged $6.5/b over the last three days before 1 October and the rolling of contract. The ”gain” over the week was thus not much of a gain at all. If we just look at the M1 contract it instead fell 2% Friday to Friday though that disguises the change in the underlying contract over the week. The Brent M1 contract closed the week at $102.25/b. The announcement of 100 mb of oil from G7 SPR helped to ease prices at the end of last week. Though that effect seems to have faded today.
More barrels from Strategic Petroleum Reserves or really barrels which were supposed to be released previously? Nonetheless, Trump seems to be content and is backing down from diesel export ban. Trump threatened the world, but especially Europe with a US diesel export ban unless Europe agreed to release diesel from strategic reserves. G7 last week decided to release 100 million barrels of oil from strategic reserves. But here the obscurity starts. How much of that will be diesel? ”Substantial release of diesel within 20 days” was the statement. If it happens late in this 20 day period, it would bring us very close to the US midterm elections which of course is what Trump is worried about here. IEA members promised to release 425 mb of oil from strategic reserves of which 125 mb was to be oil products. But a significant portion of that was never really released. The question is thus whether these ”new” 100 mb release will really be new or if the lion’s share of the ”new” 100 mb is really just part of the old 425 not yet fully released. Well, it looks like the promise, irrespectively what it really is, has averted a US diesel export ban for now. And it did also help to ease prices a bit at the end of last week. An effect which looks like it has mostly faded this Monday.
$140/b is the price of crude oil in Europe today. Back to the complete distortion of oil and product prices in time and geography. The Dated Brent ”spot” price averaged $123.3/b last week. But that is really the average Day_10 to Day_20 of the ”daily Dated Brent” forward curve. But since this curve is in very steep backwardation, the real prices for physical oil cargoes at the very front-end of this daily curve sits well above the average of this daily curve. The physical premiums for Oseberg and for Fortis crude takes this steep backwardation into account. The full price average for Oseberg and Fortis last week were thus $142.5/b and $140.2/b. That is way, way higher than both the Dated Brent ”spot” price last week and the average of the Brent futures price, the M1 contract, which averaged $103.2/b last week and is trading at $102.4/b
Extreme prompt tightness may fade or get much worse. The extreme prompt tightness and backwardation we see in the market today is a display of today’s prompt situation and not necessarily a guide for the future. The much more relaxed Brent M1 contract (today December) at $102.4/b is maybe a reflection of an oil market either betting or expecting that today’s problems will be resolved somehow over the coming three months. Or, that the current flow of oil out of the SoH at 17.5 mb/d (close to normal) will be sustained or even increase over time. But we don’t know exactly why the flow of crude, products and LNG out of the SoH has been able to sustain at around 17.5 mb/d since mid-September (it seems). Is it because shippers are better at managing the risk or more willing to take the risk of transiting? Is it because the US military assistance is better? Or is it because Iran is paid by exporters and is allowing exports out through the SoH? It seems plausible that Iran expects the US to attack again after the US midterm elections. If so, then Iran may engage with fresh attacks before that date. Physical crude in Europe today is $140/b, or 2x the ”normal” price of $70/b. But if tightness escalates further, then price of crude in Europe could go to 3x, 4x or even 5x the normal level. Let’s hope that the US is able to keep the SoH ”open” at a rate of 17.5 mb/d and that another 100 mb of oil from G7 helps to shield against that upside risk.
The global oil-stock cushion is getting ”scarily thin”. Looking at the Brent M1 Dec-26 contract, one gets the impression that risks may be fairly contained. Looking at physical spot prices in Europe however of around $140/b, the sense of stress rises substantially. The latter better reflects Amin Nasser, CEO of Saudi Aramco, when he recently said that the cushion capacity of global oil stocks are getting ”scarily thin”.
Some key questions helping to keep the Brent M1 price above $100/b: Will Iran initiate fresh attacks before the US midterm elections? Will the US attack Iran after the elections? Will the US be able to keep the SoH close to open at 17.5 mb/d? Will the Houthis re-attack the Saudi east-west pipeline and ships trying to traverse the Bab-el Mandeb Strait as the Saudi-backed Yemen government tries to retake areas along the Red Sea recently taken by the Houthis? How far will this have to go before China finally decides to step in as a peacemaker in ME negotiations?
ARA Crude oil, diesel and nat gas prices in USD/boe

Physical crude oil premiums for Fortis and Oseberg in the NSea in USD/b premium over the Dated Brent index

Spot crude oil prices at very high levels. The Brent 1M (November) contract yesterday traded between $103.76 – 108.83/b before settling the day at $105.28/b. This morning it is trading up 1.4% to $106.8/b. That is not much of a price given that the ME crisis has been ongoing since 28 February. The Dated Brent spot price however settled yesterday at $123.78/b and averaged $120.6/b last week. Even stronger were the individual North Sea spot crude prices where Johan Sverdrup crude averaged $144/b from 21 to 24 September. And Johan Castberg was said to have traded at a premium of $32/b to the Dated Brent price last week which potentially would have placed it closer to $150/b.
A steady trend higher since $70/b in early July. Crude oil prices have been on a steady trend upwards since they bottomed out at around $70/b in early July following the discharge of some 200 million barrels of crude, products and liquids from the Persian Gulf during a two week MoU window. from 20 June to 7 July when hostilities again resumed.
The oil market today is split apart in time, space and molecules. Financial crude oil prices for November delivery are trading at $106/b (Brent) and $93.3/b (US WTI) and $107/b (Oman). But spot crude oil prices are much higher at $120-150/b as described above. But consumers do not consume crude oil, they consume diesel and gasoline and other products. And diesel prices are closer to $200/b in ARA due to destruction of Russian refineries and locked-in refineries in the Persian Gulf. Oil markets are very stressed with respect to products, but not so stressed with respect to crude oil. But refineries are eager to pay up for crude deliveries right here and now so they can convert that crude to products and make a killing profit. They are not willing to pay up for November crude deliveries in the same way as uncertainties on the Middle East situation is so high. Exorbitantly expensive VLCC freight rates is also driving prices apart. VLCC freight rates are today running at 500,000 to 1,000,000 dollar a day rather than the normal 20,000 a day. This typically adds $10-20/b for crude oil between the point of origin and the point of delivery some 30-50 days out in time when the crude is delivered. This creates a lot of confusion of what really is the price of crude oil these days. Prices are very different in time and space.
Bonds and equity markets are starting to feel the heat. The Middle East crisis is starting to feed risk and pain into financial markets where the US 10-year rate is rising along with crude and product prices with equity market indices starting to pull back in response.
The risk is rising that the ”Trump war” in the Middle East may lead to the ”Trump recession”. A legacy Trump would not likely want to have. Feed-through to financial markets, rising risks for US financial and economic recession, rising risk to Trump’s legacy, declining US stocks of Patriot and THAAD rockets could be forcing mechanisms towards a resolution of the Middle East crisis.
A picture of the future Middle East order is starting to emerge. There seems to be a lot of discussions between different parties going on and a picture of a new Middle East order is starting to emerge. A post Middle East pax Americana order. Where the different countries in the Middle East are taking much more responsibility for the security order in the region. The US provides intelligence and sell weapons to the region but is reducing its military presence. Iran is recognized as a regional power, but not the dominant one and is part of the security order in some ways. Trump can say that he reshaped the Middle East order. Exports of oil restored. The region now paying for its own defense. US soldiers pulled out to a minimum. China part of the diplomatic solution and taking some responsibility for keeping Iran in check.
Time to some kind of ME resolution? Forcing mechanisms: Declining stocks of defensive US rockets + rising crude and product prices + rising economic and financial pain and rising risk to Trump’s legacy. A window of resolution could be November to January maybe. Markets will likely increasingly price in a resolution as the picture of the future security order in the Middle East emerges further.
Crude and diesel prices in USD/b

European M1 refinery margins at record high.

Dated Brent and Oman crude are showing the way higher. The Brent crude M1 contract (October) gained another 0.75% yesterday. It traded in a range of $95.97-95.06/b and closed at $97.0/b. This morning it gains another 1.4% to $98.4/b. The Dubai M1 contract which is settled in November is showing the way at $105/b while Dated Brent settled ydy at $106.8/b. Brent crude M1 is now well above both the 50dma, 100dma and 200dma and is heading towards the 61.8% Fibo level of $100.55/b with $110.44/b next in line technical level thereafter.
Tight oil product markets are helping to drive crude oil prices higher as well. The strong push upwards for the Dated Brent price with ydy price reaching $106.8/b. Behind that drive upwards it very tight oil product markets with balance of month diesel refining margins in ARA now close to $90/b and gasoil cracks have been reported to top $100/b for the first time ever. That means extreme profitability for refineries. In response refineries here, there and everywhere want to get their hands on physical crude as quickly as possible. Convert it to oil products and sell the products into the ultra-tight spot oil product markets. Especially the diesel segment (Jet, diesel, gasoil). The economic incentive is huge for refineries.
This drive by refineries to process more crude in response to high refining margins, usually kicks in at much lower levels. Thereby normally transferring tightness from the oil product market over to the crude oil market. That normal mechanism hasn’t really worked properly in this crisis so far since there hasn’t been all that much spare refining capacity left as Ukraine is constantly damaging Russian refineries while the semi-closure of the SoH has sharply reduced oil product exports.
Stronger Chinese crude oil imports but higher oil product exports as well. Chines crude imports rose 6.2% MoM in August to 9.21 mb/d. That was still 2.9 mb/d below the 2025 average of 12.1 mb/d. But China’s net oil product exports rose to 0.91 mb/d in August which is the highest level since February 2023. As a result, Chinese imports of crude and oil products was still 3.5 mb/d below the 2025 average versus 3.6 mb/d in July. That is a strengthening of net imports of only 0.1 mb/d. Not much change in total. But it shows that Chinese refineries, probably with the blessing of government, are importing more crude and re-export these as oil products. That helps to transfer oil product tightness to crude oil tightness. India is doing the same. In July it exported about 1.4 mb/d of oil products and the highest since September.
The Iran-Oman deal on the SoH will give China a forceful political option. The Iran-Oman agreement over how to operate the SoH is just days away from finalization says Iran. The IMO and the US is said to have been involved in the process. Once it is agreed and published, China will have the option to sail a Chinese flagged VLCC through the SoH according to the new, official regulation of the SoH, load oil at Kharg Island and take it back to China. That is a very forceful option for China.
Oil and the SoH will for sure be a hot topic when Trump and Xi Jinping meets in the US on 25 September. And China will have some forceful bargaining chips to play versus Donald Trump regarding the SoH and oil.
ARA balance of month refining margins at close to $90/b giving refineries strong incentives to run hard converting crude to products = stronger refinery crude oil demand

Dated Brent and Oman crude (settled outside of the Persian Gulf) are showing the way upwards

Chinese crude (crude) and net crude and oil product imports (red) versus the 2025 average. Net crude and oil product imports was 3.5 mb/d below the 2025 average in August and 3.6 mb/d below in July. Almost the same. Stronger crude imports but also higher oil product exports

Chinese oil product exports rose to 0.91 mb/d in August and highest since Feb 2023. (numbers in reverse)





Viscariagruvan får strategisk status av EU

Miljöpartiet i England slutar vara motståndare till kärnkraft
The price of crude oil in Europe today is $140/b

Kanada vill få fart på oljesanden igen
Oil prices are rising, but a picture of the future ME order may start to emerge

Priset på diesel når sin högsta nivå någonsin i USA

Brentolja med fysisk leverans i närtid kostar nu 120 USD per fat

År 2035 kan datacenter i USA förbruka mer naturgas än Japan och Tyskland tillsammans

Svenska gurkor växer flexibelt med tillgången på elektricitet

Varför det en gång så mäktiga OPEC förlorar inflytande
-
 Nyheter4 veckor sedan
Priset på diesel når sin högsta nivå någonsin i USA
-
 Nyheter4 veckor sedan
Brentolja med fysisk leverans i närtid kostar nu 120 USD per fat
-
 Nyheter3 veckor sedan
År 2035 kan datacenter i USA förbruka mer naturgas än Japan och Tyskland tillsammans
-
 Nyheter4 veckor sedan
Svenska gurkor växer flexibelt med tillgången på elektricitet
-
 Nyheter3 veckor sedan
Varför det en gång så mäktiga OPEC förlorar inflytande
-
 Nyheter1 vecka sedan
Kanada vill få fart på oljesanden igen
-
Analys2 veckor sedan
Oil prices are rising, but a picture of the future ME order may start to emerge
-
 Nyheter4 dagar sedan
Miljöpartiet i England slutar vara motståndare till kärnkraft