Analys
Trade war today and oil market balance tomorrow


Brent crude lost 7.2% and closed at $60.5/bl with also the three year contract loosing 4% with a close of $56.02/bl. Neither equities nor oil were satisfied with ”mid-cycle rate adjustment” cut by the Fed earlier in the week and were already on a weak footing. Yesterday’s announcement/tweet by Donald Trump that an additional $300 bn worth of trade with China would get a 10% import levy totally pulled the plug on oil.
The thing is that the global oil market balance is not too bad right now and so far this year. IEA announced in its July Oil Market Report that OECD oil inventories had been rising during the first part of the year. It is true that the OECD inventories are up 34 m bl in May versus December last year but normally (2010 to 2014 average) they increase 45 m bl during this period. So if inventories are the proof of the pudding then the global oil market was pretty much in balance from Jan to May this year. Since then the US crude oil inventories have fallen sharply and the Brent crude oil forward curve is still in backwardation signalling a market which is on the tight side of the scale.


The sell-off yesterday is thus about concerns for the oil market balance for tomorrow, for next year and not so much for the current balance and the balance in 2H-19.
The forward Brent crude oil curve is still in backwardation, US crude inventories have been falling sharply since early June and continue to do so, US shale oil production growth is slowing quite sharply, European overall spot refining margin is close to the highest level over the past 2-3 years, OPEC+ is cutting and supply from Iran and Venezuela is just plunging.
Thus the bearish take on oil is not so much coming from the front end (spot) of the oil market. It is all about slowing global growth, slowing oil demand growth, US-China trade war, too little proactive stimulus from the US Fed and deep concerns for the oil market balance of tomorrow.
If we remember correctly Saudi Arabia commented earlier this summer that it might be difficult to cut yet deeper in 2020 than what they are doing now. So if the oil market is running a surplus in 2020 then the oil price and not OPEC+ will have to do the job of balancing the market.
If we look at where oil prices are trading on the forward curve it is very clear that the main job of the oil prices at the moment is about holding US shale oil production growth in check. The three year WTI price yesterday closed at $50.12/bl while the three year Brent crude oil contract closed at $56/bl. Thus the oil price right now is all about controlling US shale oil production growth.
Four new pipelines channelling oil out of the Permian will come on-line in 2H-19 and early 2020 with a total capacity of 2.3 m bl/d. What this mean is that local Permian oil prices will move much closer to US Gulf seaborne oil prices and Brent crude oil prices. Oil will be drained out of the Permian and allow Permian oil producers to ramp up production without crashing the local Permian oil price. The flow of oil from Permian to Cushing Oklahoma on the Sunrise pipeline will slow to a halt. US Cushing stocks will decline much more easily and the WTI Cushing price will also move closer to Brent crude.
So, again, will WTI move up to Brent or will Brent move down to WTI when the pipelines open up? The 670 Cactus II from Permian to Corpus Christi at the US Gulf opened for service on 1 August. Since one year ago the Brent June 2020 contract has declined by $10.2/bl while the comparable WTI contract has declined by only $7.5/bl and the spread between the two has declined from $8.5 to now $5.8/bl. So over the past year at least we see that it is the Brent contract which has moved down to the WTI price and not the WTI price which has moved up to the Brent price. The interim transportation cost on the Epic II pipeline has been lowered from $5/bl to only $2.5/bl and pipelines from Cushing to US Gulf are lowering tariffs in competition. In a slowing shale oil production growth situation coupled with a large increase in pipeline capacity we should expect to see a further strong convergence between the Brent crude oil price curve and the WTI price curve. In general the Brent prices should move down to the WTI prices but the initial reaction will be declining US crude oil inventories both in general and in Cushing Oklahoma. This will drive WTI prices higher initially and drive the WTI crude curve into full backwardation.
The only reconciliation we can envisage for an oil market where the current situation is tight, refinery margins are strong and IMO 2020 is coming on top coupled with deep rooted market concerns for the oil market balance for 2020 is very weak 2020 forward prices together with spiky and backwardated front end prices. So expect WTI curve into full backwardation (strong spot prices), weak 2020 prices and tighter Brent to WTI spreads with forward Brent prices moving down towards the WTI prices.
Ch1: Rising OECD inventories by IEA. But those rises are very close to normal seasonal trends. From Jan to March inventories usually drop by 32 m bl (2010 to 2014 average seasonal trend). This year they only dropped by 16 m bl. From March to May however they normally increase by 46 m bl while this year they only increased by 39 m bl. In total from Jan to May they normally increase by 14 m bl while this year they increased by 23 m bl. So yes OECD inventories increased by 9 m bl more than the seasonal trend from Jan to May. That is pretty close to noise as it gets. So if OECD inventories are anything to go by we’d say that the OECD-inventory implied supply/demand balance was pretty much in balance from Jan to May

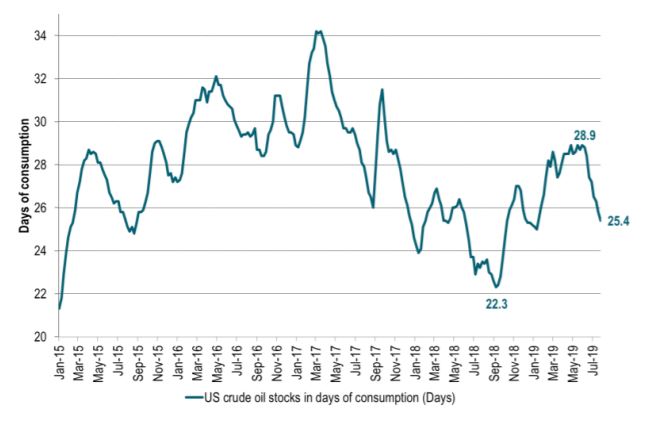
Ch2: US crude stocks have fallen sharply since early June. Here seen in days of consumption where it has fallen from 28.9 days to only 25.4 days in the latest data. We expect US crude inventories to fall further

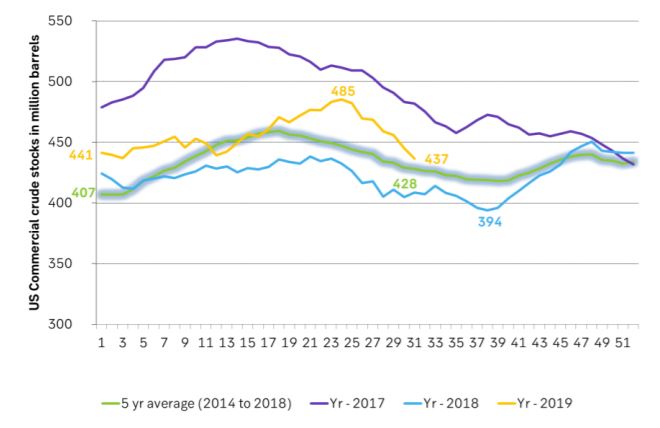
Ch3: US crude oil stocks in barrels have fallen sharply since early June and now only stands some 9 m bl above the 5 year average. Also if we look at total US crude, middle distillates and gasoline we see that these US inventories in total are only 9 m bl above normal (2014 – 2018).

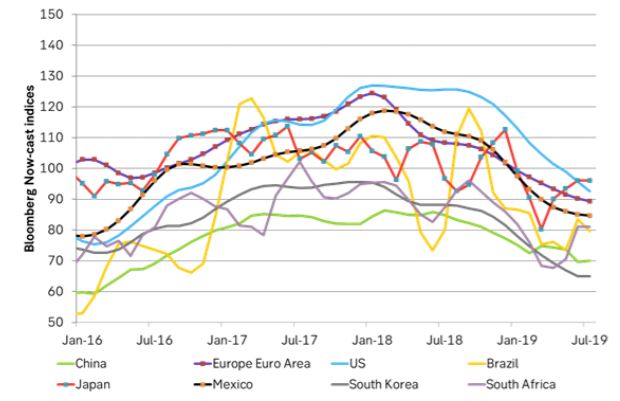
Ch4: What worries the market is this: Global economic growth and thus oil demand growth. Here depicted through the lense of Bloomberg’s calculated now-cast indices. What stands out here is that it is worse in the rest of the world than in the US but maybe more importantly that the US economy now is cooling faster than the rest of the world. Though this is a very qualitatively assesment from the graph. This week’s quarter percent US Fed rate cut is probably far too little to counter this cooling trend.

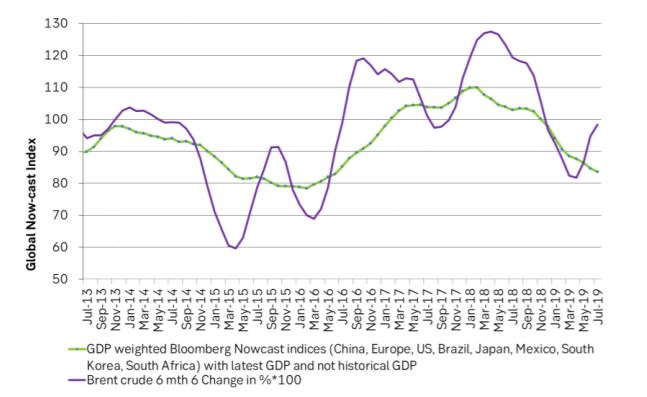
Ch5: Agregating Bloomberg’s individual country now-cast indices to one “global now-cast” index shows that the global economy is cooling and cooling and will soon be down to the trough in 2015/16. Graphing this global index versus the Brent crude 6m/6m change in prices we see that from a demand/macro view point Brent has moved counter to the cooling macro trend and a deteriorating global demand back-drop. It has risen on the back of OPEC+ supply cuts and Iran issues.

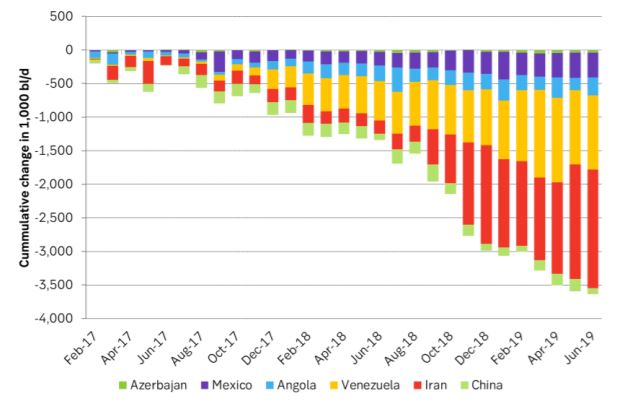
Ch6: Huge loss in supply from key producers since primo 2017 not enough to lift prices

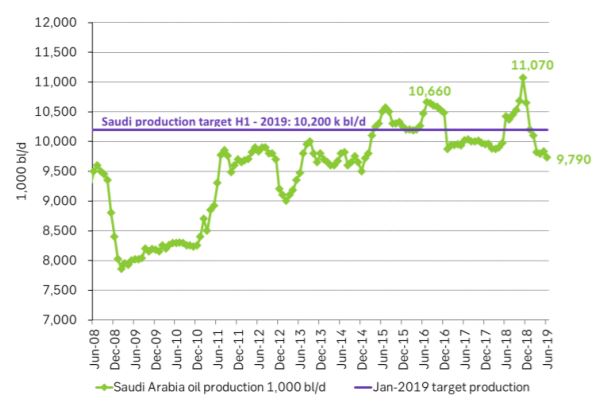
Ch7: Aggressive cuts by Saudi Arabia neither enough to lift prices. It is very hard to lift prices through production cuts amid a deteriorating global growth

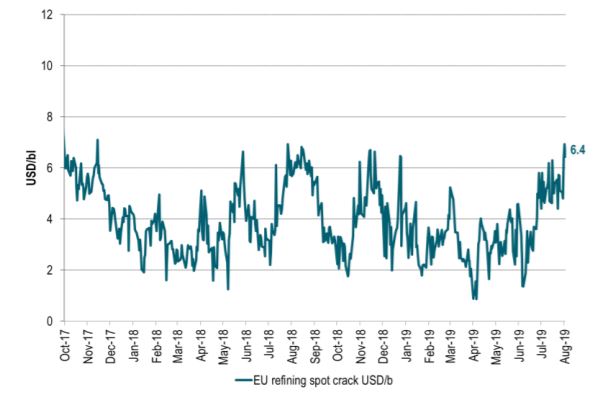
Ch8: European spot refining margins are very strong and close to the highest level over the last 2-3 years

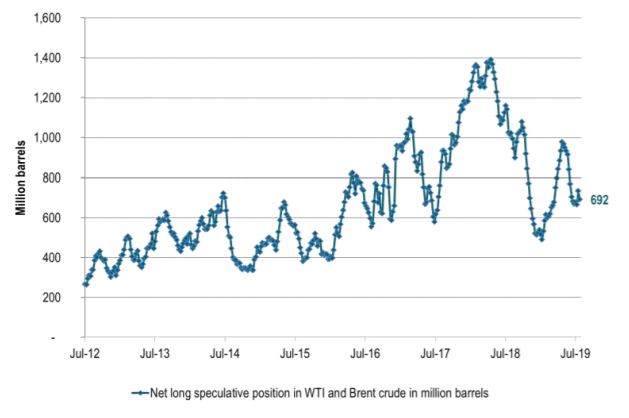
Ch9: Speculators are not feeling very bullish in the face of the deteriorating global macro picture

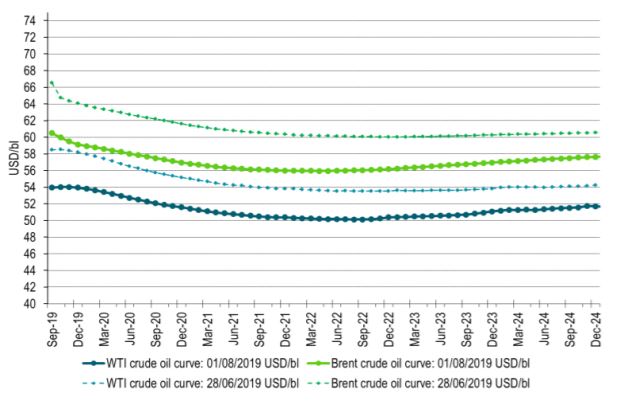
Ch10: Forward crude oil curves. Ydy close vs end of June. Brent down more than WTI. Brent is moving lower and closer to WTI.

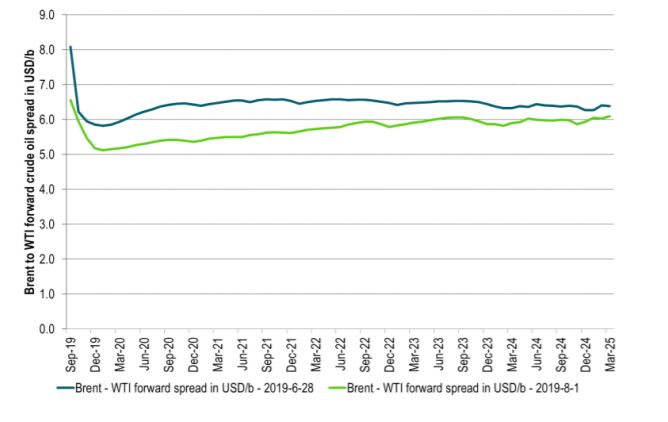
Ch11: Spreads between the forward crude oil curves have moved lower since late June

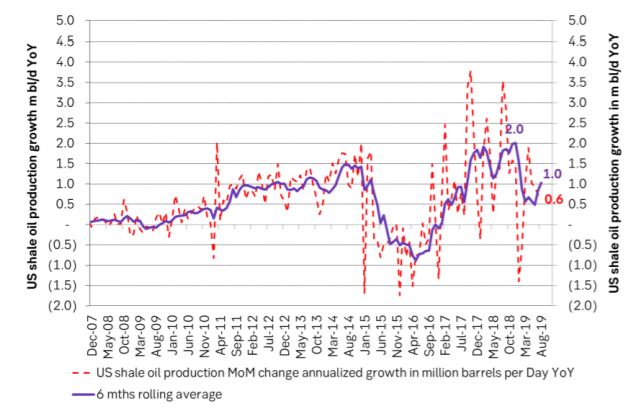
Ch12: US shale oil production growth has slowed to a growth rate of only 0.6 m bl/d on a marginal, annualized rate. Sharply down from around 1.5 – 2.0 m bl/d in 2017/18 period. Shale oil players are signalling further slowdown during the autumn. The shale oil well completion rate only needs to be lowered by some 100 to 200 wells per month in order to drive US shale oil production growth to close to zero