

Analys
The Permian pipes are coming and it is no small potato


Between 2.2 m bl/d to 2.5 m bl/d of new pipeline capacity from the Permian basin to the US Gulf will be put into operation in a flash of just three quarters (Q3-2019 to Q1-2020). Effective capacity is probably about 1.7 m bl/d to 2.0 m bl/d assuming an 80% utilization rate. The Cactus II (670 k bl/d) from the Permian Basin to the USGC is coming online already the 1st of August. I.e. in only 23 days.
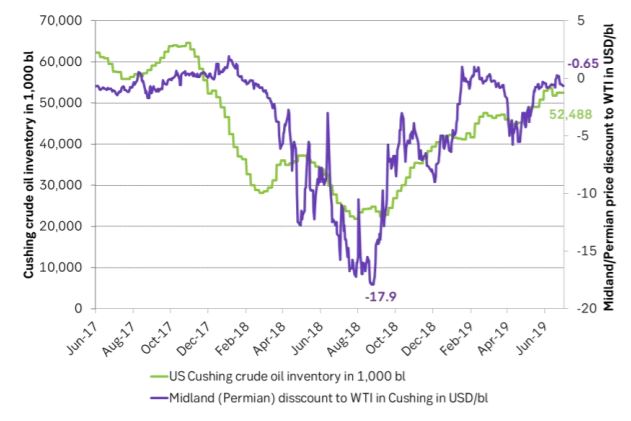
Changes to Texas pipelines had a huge impact on oil prices just one year ago. The Basin/Sunrise pipeline from Midland/Permian to Wichita falls and Cushing Oklahoma then expanded its capacity by a full 500 k bl/d to a total 800 k bl/d. This relieved bulging inventories at depressed prices in the Permian to flow into then very low inventories in Cushing Oklahoma where the WTI is priced. Cushing Oklahoma crude stocks rose strongly, the WTI price crashed, the Brent price crashed and the Midland/Permian price spread to WTI moved from minus $17.9/bl to only minus $0.7/bl today. That is last year’s price action seen from a pipeline perspective.
Now we are set for a much larger change to pipelines in the Permian and it will happen in just three quarters and start already in 23 days.

There has been a significant dislocation between Brent crude oil prices and WTI prices in 2019. The WTI crude curve has been in front end contango while the Brent curve has been in full backwardation and in period exceptionally strong front end backwardation. The two crude curves have told completely different stories. Global Brent market: Too little oil. Local US WTI Cushing Oklahoma market: Too much oil.
When the Cactus II from Wink in Texas (Permian Basin) to Corpus Christi at the USGC (670 k bl/d) comes into operation on 1 August it will release some 4 m barrels from the Permian to the USGC each week (assuming 80% utilization). This will relieve the pressure on other pipelines in Texas. It will for example be much less need to send crude oil from Permian via the Basin/Sunrise pipeline to Cushing Oklahoma. I.e. less crude will flow into Cushing crude stocks from the Permian. It will thus become easier to drain the currently elevated Cushing crude stocks via pipelines to the USGC.
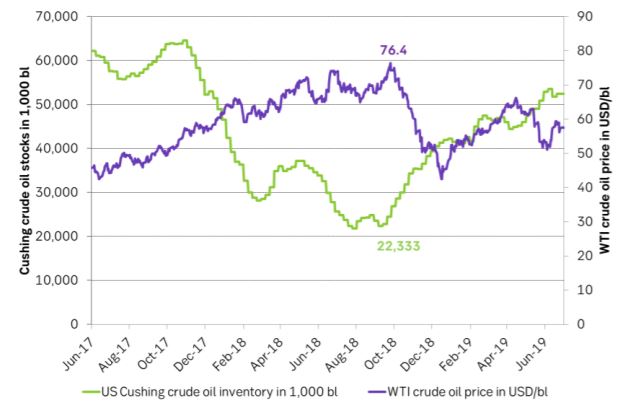
US Cushing crude oil stocks today stands at 52.5 m barrels versus only 22.3 m barrels on the 20th of September last year when the WTI price spiked at $76.4/bl. Cushing is today probably receiving a full flow of crude oil from the Permian Basin via the Basin/Sunrise 800 k bl/d pipeline. At 80% utilization that equals about 4.5 m barrels per week.
This flow of oil from the Permian into Cushing Oklahoma will likely fall partially silent starting 1 August and over the coming three quarters it will definitely fall silent and stop pumping crude oil into Cushing Oklahoma. As the three new pipelines (Cactus II (670 k bl/d), Epic crude (600 – 900 k bl/d) and the Grey Oak (900 k bl/d)) all come online over the next three quarters we might even see that Basin/Sunrise could change direction and help drain Cushing stocks via the Permian to the USGC.
But just halting the flow of oil of about 4.5 m barrels per week from the Permian to Cushing via the Basin/Sunrise pipeline could lead to a decline in Cushing Oklahoma crude oil stocks of 20 m barrels in just one month. That would drag Cushing stocks from 52.3 m barrels today to only 32 m barrels over the course of August alone.
Bullish for WTI and Bearish for Brent. A $2/bl spread is very probable in our view. Needless to say this is bullish for the WTI crude oil curve structure as well as the WTI crude oil flat price. It is also bearish for the Brent crude oil price and crude oil curve structure. The Brent and WTI crude oil price spread will tighten further and the shape of the two crude curves will converge further. Tightness in the global market place will be partially relieved while the WTI market will tighten up significantly.
Will the WTI price move up to Brent or will Brent move down to the WTI price? Global oil producers have enjoyed the luxury of getting a $7.8/bl premium over the WTI price since the start of 2018. The general assumption has been that Brent crude oil will trade in the $60-70/bl range while WTI will trade in the $50-60/bl range. And further that when the new Permian pipelines comes online the next three quarters it will shift the WTI price up towards the global benchmark Brent crude. Or will they maybe meet in the middle or will the Brent crude oil price marker move down to WTI.
We think that the initial action will be a strengthening of the WTI price. The WTI price has over the past 4 years firmly established a price to US inventory relationship. So as US inventories move lower as a result of Permian pipes coming online it will push the WTI price higher on the basis of this established price/inventory relationship.
The Brent crude oil price and curve structure will move towards the WTI curve. The Brent crude curve could move a little lower towards WTI. But a bullish sentiment hitting the WTI price on the back of declining US Cushing crude stocks could even smitten over to the Brent crude oil price and actually lift both the benchmarks. WTI the most and Brent a little.
Our view is that an overweight of global oil investors are hugely focused on the WTI price. Firstly because a large part of them are located in the U.S. Secondly because U.S. oil data are of high quality and published at a high frequency.
It gives a sense of control and that you know what you are doing when you trade WTI on the basis of data you can really trust and see on a high frequency. In other words many oil investors treat the WTI benchmark as THE global benchmark and as a reflection of the global market.
So when US crude inventories decline both in total and locally in Cushing Oklahoma it is taken by investors as a sign of a tightening global oil market even if it in this case is only a shift of oil out of the US and into the global market due to new pipelines coming online from the Permian to the USGC.
Global growth is cooling and oil demand growth along with it but it will likely be countered by an IMO-boost. The global oil market is currently weighted down by continuously deteriorating global growth indicators in combination with still strongly growing US crude oil production. Restraint from OPEC+ and losses of supply from Iran and Venezuela as well as the Russian Druzhba pipeline is helping to prevent oil prices from heading lower and trail the deteriorating global economic growth picture. But elevated US oil inventories and a weak global economic backdrop is preventing oil prices from moving higher.
Global middle distillate demand will likely rise sharply in Q4-19 and H1-20 due to the new IMO 2020 regulations which requires global shipping to consume low sulphur bunker oil. Refineries will have to run hard to meet the added mid-dist demand. We expect this to counter the cooling global growth picture.
H2-19 could see a mix of sharply declining Cushing crude oil stocks and strongly rising mid-dist demand. This could be a very bullish set-up for crude oil prices. Pushing WTI higher on the basis of Cushing crude inventory declines and pulling Brent crude higher on the back of bullish WTI sentiment and strong global mid-dist demand from the shipping side.
Down the road it could be a bit different. WTI would need to move back down to control US shale oil supply growth while Brent crude would follow lower as there would be very little pipeline capacity strains to keep the two benchmarks apart. I.e. we could see WTI back to $55-60/bl and Brent crude only a couple of USD above.
That is of course if we assume that US investors continues to bankroll under-water US shale oil production growth. If US investors demand profits and a positive cash flow from US shale oil producers then WTI would need to move higher in order to keep U.S. shale oil production growing robustly.
More pipelines are coming in 2021. In addition to the 2.2 to 2.5 m bl/d of new pipeline capacity coming online the next three quarters there will be an additional 1.4 to 1.8 m bl/d of pipeline capacity coming online in 2021: The Wink (Permian) to Webster (Houston) 1000 bl/d pipeline and the Seahorse – Tallgrass from Cushing Oklahoma to Louisiana.
What it means is that 1) The Brent to WTI price spread will be narrow over the coming years. 2) That US shale oil producers will receive a crude oil price close to the global price level and the global oil price will stimulate US shale oil production directly without a $7-10/bl discount and 3) That rising U.S. crude oil production will flow freely into the global market place and challenge OPEC+ production in all markets.
US production boom so far has meant declining US oil imports. The effect on OPEC and other non-US producers has been a redirection of oil supply away from the US and instead towards growing demand in Asia. I.e the first phase of the US oil production boom has not been so painful for non-OPEC producers as it primarily has meant a redirection of oil exports.
The next leg of the US oil production boom means US oil exports will challenge non-US producers in the global market. It may be much more difficult for non-US producers to swallow that growing US oil exports challenge them head to head in the global market place. Either stealing all demand growth or even pushing them aside. OPEC+ can probably accept to see their exports at a fixed volume level loosing percentage global market share but with no loss of volumes in absolute terms. But accepting declining volumes in absolute terms is probably a definitely no-go for OPEC+.
This means that US production growth going forward will not be allowed by OPEC+ to grow by more than global demand growth minus production declines (like we have seen in Mexico, China,..).
Ch1: Cushing crude oil stocks were very low one year ago and crude oil was locked up in the Permian basin leading to a very large discount for WTI Midland (Permian) versus WTI Cushing. Then the Basin/Sunrise pipeline expanded capacity by 500 k bl/d to a total of 800 k bl/d in Q4-18. It released oil from Permian to Cushing. Helped to drive Cushing stocks strictly higher and the spread between WTI Midland and WTI Cushing shrank from minus $17.9/bl about in September 2018 to now only minus $0.7/bl
Ch2: As the Cushing crude stocks rose sharply from late September last year the WTI crude oil price totally tanked and dragged the Brent crude oil price lower along with it.
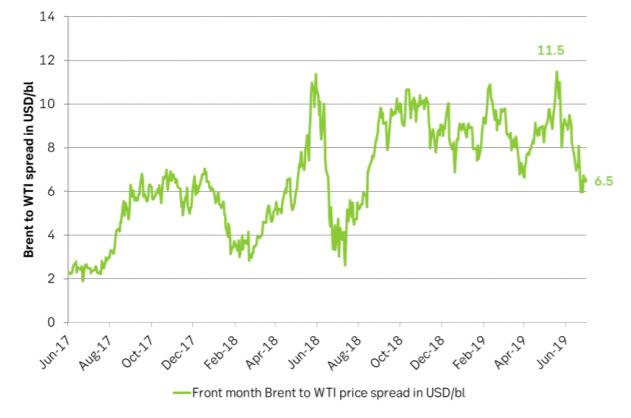
Ch3: The Brent-WTI price spread has moved from a high of $11.5/bl in May last year to now only $5.6/bl. Going forward there will be less and less pipeline constraints and the two grades will move much closer together.
Market is starting to take US/Iran headlines with a pinch of salt. Brent crude rose $2.8/b yesterday to an official close of $112.1/b. But after that it traded as low as $108.05/b before ending late night at around $109.7/b. Through the day it traded in a range of $106.87 – 112.72/b amid a flurry of news or rumors from Iran and the US. ”US temporary sanctions during negotiations” (falls alarm). ”We will bomb Iran” (not anyhow),… etc. While the market is still fluctuating to this kind of news flow, it is starting to take such headlines with a pinch of salt.

We’ll see. Maybe, maybe not. The Brent M1 contract is trading at $110.2/b this morning which very close to the average ticks through yesterday of $110.4/b.
Trump with bearish, verbal intervention whenever Brent trades above $110/b it seems. What seems to be a pattern is that Trump states something like ”very good negotiations going on with Iran”, ”New leaders in Iran are great,..”, ”Great progress in negotiations,…”, ”Deal in sight,..” etc whenever the Brent M1 contract trades above $110/b. An effort to cool the market. These hot air verbal interventions from Trump used to have a heavy bearish impact on prices, but they now seems to have less and less effect unless they are backed by reality.
As far as we can see there has been no real progress in the negotiations between the US and Iran with both sides still standing by their previous demands.
Iran is getting stronger while the cease fire lasts making a return to war for Trump yet harder. Iran is naturally in constant preparation for a return to war given Trump’s steady threats of bombing Iran again. Iran is naturally doing what ever is possible to prepare for a return to war. And every day the cease fire lasts it is better prepared. This naturally makes it more and more difficult and dangerous for the US to return to warring activity versus Iran as the consequences for energy infrastructure in the Persian Gulf will be more and more severe the longer the cease fire lasts. Israel seems to see it this way as well. That the war is not won and that current frozen state of a cease fire gives Iran opportunity to rebuild military and politically.
Global inventories are drawing down day by day. How much? In the meantime the Strait of Hormuz stays closed. There is varying measures and estimates of how much global inventories are drawing down. Our rough estimate, back of the envelope, is that global inventories are drawing down by at least some 10 mb/d or about 300 mb/d in a balance between loss of supply versus demand destruction. Other estimates we see are a monthly draw of 250-270 mb/d. The IEA only ’measured’ a draw in global observable stocks of 117 mb in April with oil on water rising 53 mb while on shore stocks fell 170 mb. But global stocks are hard to measure with large invisible, unmeasured stocks. As such a back of the envelope approach may be better.
Oil products is what the world is consuming. Oil product prices likely to rise while product stocks fall. Strategic Petroleum Reserves (SPR) are predominantly crude oil. Discharging oil from OECD SPR stocks, a sharp reduction in Chinese crude imports and a reduction in global refinery throughput of 6-7 mb/d has helped to keep crude oil markets satisfactorily supplied. But global inventories are drawing down none the less. And oil products is really what the world is consuming. So if global refinery throughput stays subdued, then demand will eventually have to match the supply of oil products. The likely path forward this summer is a steady draw down in jet fuel, diesel and gasoline. Higher prices for these. Then, if possible, higher refinery throughput and higher usage of crude in response to very profitable refinery margins. And lastly sharper draw in crude stocks and higher prices for these. But some 6 mb/d of oil products used to be exported through the Strait of Hormuz. And it may not be so easy to ramp up refinery activity across the world to compensate. Especially as Ukraine continues to damage Russian refineries as well as Russian crude production and export facilities.
Watch oil product stocks and prices as well as Brent calendar 2027. What to watch for this summer is thus oil product inventories falling and oil product premiums to crude rising. Another measure to watch is the Brent crude 2027 contract as it rises steadily day by day as the Strait of Hormuz stays closed and global oil inventories decline. The latter is close to the highest level since the start of the war and keeps rising.
The Brent M1 contract and the Brent 2027 prices and current price of jet fuel in Europe (ARA). All in USD/b

Our back of the envelope calculation of the global shortage created by the closure of the Strait of Hormuz. Note that 3.5 mb/d of discharge from SPR is also a draw. Note also that ’Forced demand loss’ of 2.5 mb/d is probably temporary and will fall back towards zero as logistics are sorted out leaving ’Price demand loss’ to do the job of balancing the market. Thus a shortfall of at least 9 mb/d created by the closure. More if SPR discharge is included and more if Forced demand loss recedes.

Brent is climbing higher. Front-month is at USD 106.3/bl this morning, close to a weekly high and a USD 9/bl jump from Mondays open. This is the move we flagged as a risk earlier in the week: the market shifting from ”a deal is around the corner” to ”this is going to take longer than we thought”.

Analyst Commodities, SEB
During April, rest-of-year Brent remained remarkably stable around USD 90/bl. A stability which rested on one single assumption: the SoH reopens around 1 May. That assumption is now slowly falling apart.
As we highlighted yesterday: every week of delay beyond 1 May adds (theoretically) ish USD 5/bl to the rest-of-year average, as global inventories draw 100 million barrels per week. i.e., a mid-May reopening implies rest-of-year Brent closer to USD 100/bl, and anything pushing into June or July takes us meaningfully higher.
What’s changed in the last 48 hours:
#1: The US military has formally warned that clearing suspected sea mines from SoH could take up to six months. That is a completely different timescale from what the financial market is pricing. Even a political deal tomorrow does not immediately reopen the strait.
#2: Trump has shifted his tone from urgency to ”strategic patience”. In yesterday’s press conference: ”Don’t rush me… I want a great deal.” The market is reading this as a president no longer feeling pressured by timelines, with the naval blockade running in the background.
#3: So far, the military activity is escalating, not de-escalating. Axios reports Iran is laying more mines in SoH. The US 3rd carrier strike group (USS George H.W. Bush) is arriving with two countermine vessels. Trump yesterday ordered the US Navy to destroy any Iranian boats caught laying mines. While CNN reports that the Pentagon is actively drawing up plans to strike Iranian SoH capabilities and individual Iranian military leaders if the ceasefire collapses. i.e., NOT a attitude consistent with an imminent deal!
Spot crude and product prices eased off the early-April highs on a combination of system rerouting and deal optimism. Both now weakening. Goldman estimates April Gulf output is reduced by 14.5 mbl/d, or 57% of pre-war supply, a number that keeps getting worse the longer this drags on.
Demand-side adaptation is ongoing: S. Korea has cut its Middle East crude dependence from 69% to 56% by pulling more from the Americas and Africa, and Japan is kicking off a second round of SPR releases from 1 May. But SPRs are finite.
Ref. to the negotiations, we should not bet on speed. The current Iranian leadership is dominated by genuine hardliners willing to absorb economic pain and run the clock to extract concessions. That is not a setup for a rapid resolution. US/Israeli media briefings keep framing the delay as ”internal Iranian divisions”, the reality is more complicated and points toward weeks and months, not days.
Our point is that the complexity is large, and higher prices have only just started (given a scenario where the negotiations drag out in time). The market spent April leaning on the USD 90/bl rest-of-year assumption; that case is diminishing by the hour. If ”early May reopening” is replaced by ”June, July or later” over the next week or two, both crude and products have meaningful room to reprice higher from here. There is a high risk being short energy and betting on any immediate political resolution(!).
Down on Friday. Up on Monday. The Brent June crude oil contract traded down 5.1% last week to a close of $90.38/b. It reached a high of $103.87/b last Monday and a low of $86.09/b on Friday as Iran announced that the Strait of Hormuz was fully open for transit. That quickly changed over the weekend as the US upheld its blockade of Iranian oil exports while Iran naturally responded by closing the SoH again. The US blew a hole in the engine room of the Iranian ship TOUSKA and took custody of the ship on Sunday. Brent crude is up 5.6% this morning to $95.4/b.
The cease-fire is expiring tomorrow. The US has said it will send a delegation for a second round of negotiations in Islamabad in Pakistan. But Iran has for now rejected a second round of talks as it views US demands as unrealistic and excessive while the US is also blocking the Strait of Hormuz.
While Brent is up 5% this morning, the financial market is still very optimistic that progress will be made. That talks will continue and that the SoH will fully open by the start of May which is consistent with a rest-of-year average Brent crude oil price of around $90/b with the market now trading that balance at around $88/b.
Financial optimism vs. physical deterioration. We have a divergence where the financial market is trading negotiations, improvements and resolution while at the same time the physical market is deteriorating day by day. Physical oil flows remain constrained by disrupted flows, longer voyage times and elevated freight and insurance costs.
Financial markets are betting that a US/Iranian resolution will save us in time from violent shortages down the road. But every day that the SoH remains closed is bringing us closer to a potentially very painful point of shortages and much higher prices.
The US blockade is also a weapon of leverage against its European and Asian allies. When Iran closed the SoH it held the world economy as a hostage against the US. The US blockade of the SoH is of course blocking Iranian oil exports. But it is also an action of disruption directed towards Europe and Asia. The US has called for the rest of the world to engaged in the war with Iran: ”If you want oil from the Persian Gulf, then go and get it”. A risk is that the US plays brinkmanship with the global oil market directed towards its European and Asian allies and maybe even towards China to force them to engage and take part. Maybe unthinkable. But unthinkable has become the norm with Trump in the White House.


Oil product price pain is set to rise as the Strait of Hormuz stays closed into summer

Solkraften pressar elpriserna dagtid

Michel Gubel ger sin syn på oljemarknaden


