

Analys
The crude oil market in June – Less of a crowded place


Saudi Arabia today reduced its official selling prices (OSPs) to Asia in June and crude oil prices are bouncing 6-9% on the back of that news. It signals that Saudi Arabia sees the June crude oil market as less of a crowded place and that it will be easier for the producer to place its desired volumes into the market. In a slight parallel to this we think that it is unlikely to be a wall of surplus oil banging on the door of Cushing Oklahoma in June of a comparable magnitude of May. There is probably a limited risk for a repetition of the crash to -$40/bl for the WTI June contract when it rolls off in only 9 trading days on May 19.

Crude oil prices have today been trading a little higher and a little lower until they jumped up 6-9% as Saudi Arabia increased its official selling prices for June versus other benchmarks. Higher official selling prices (OSPs) signals that Saudi Arabia no longer is seeking to push oil into the market at almost any price.
We all know that Saudi Arabia is cutting production down to 8.5 m bl/d but what this is saying is that Saudi sees the June crude oil market as less of a crowded place than before. It will need to work less hard to get oil out the door in June in the amounts it desires.
The WTI May contract crashed oil prices on April 20th. Then prices fumbled around for a week or so before a rally kick-started at the very end of April on the back of emerging signs of demand recovery, cuts by OPEC+ and declines by non-OPEC+ producers. On Tuesday the Brent front-month contract closed above $30/bl for the first time since 13th April before taking a little breather yesterday.
It is now only 9 trading days left until the WTI June contract rolls off and expires on May 19. Attention is again coming back to what happened on April 20 when the WTI May contract expired and traded down to -$40/bl before closing at -$37/bl. The market is concerned that we might get the same kind of end-of-contract disturbances for the June contract as we got for the May contract.
If so, it is highly unlikely that we would see -$40/bl again since the market now is prepared and knows such an event might happen. It is still possible that the WTI June contract could come under intense selling pressure over the coming 9 trading days as long positions move to exit.
The special thing about the WTI contract is of course that it is based and priced in-land in Cushing Oklahoma in the US. It is land-locked with flows in and out of the storage hub going by pipelines. If inventories in Cushing are full and pipes out of Cushing are full then prices can crash.
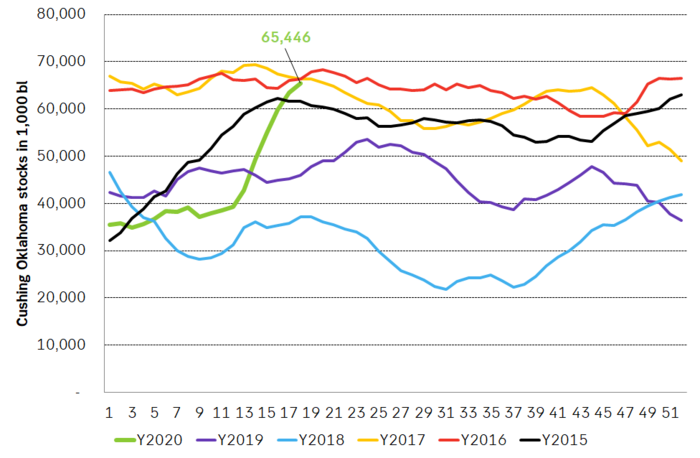
Inventories in Cushing Oklahoma have been on a continuous rise for 9 weeks. Inventories there have risen 28 m bl over this period and as of last week they stood at 65.5 m bl which is slightly below the total capacity of 76.1 m bl and on par with levels in 2016 and early 2017. Last week inventories rose by 2.1 m bl in the hub. In all practical terms the hub is now more or less full.
The number of open positions in the WTI June contract yesterday stood at 239 m bl with a comparable amount of long versus short positions. If the 239 m bl long-side of this equation decides to take these contracts to delivery in June the holders of these contracts will actually receive physical volumes in the Cushing Oklahoma physical location.
When the WTI May contract crashed to -$40/bl on April 20 there was an open position of 109 m bl at the start of the trading day. There were basically no buyers for the long positions who wanted and needed to exit since inventories were more or less fully booked for May with nowhere to take physical delivery.
At the moment we see that Cushing inventories are close to full and still rising though the growth rate in inventories is slowing since we are moving towards total capacity.
The WTI June contract however is about June and not about May. The question is thus what are the storage needs in June? How are the bookings in June? Will surplus oil just continue to flush into Cushing also in June with all pipes in and out of the hub clogged by surplus? Probably not.
Delivered oil products in the US last week stood at 25% below last year which is equal to a decline of close to 5 m bl/d. This is terribly bad, but still better than a YoY decline of 6 m bl/d in mid-April.
But demand in the US is on its way back and demand will by June most definitely be better than it is now. Maybe down only 2-3 m bl/d YoY (which is still exceptionally weak).
Supply in the US and Canada is however declining rapidly and is expected to be down by 3.5 to 4.5 m bl/d versus pre-Corona levels already in the Month of May. It turns out that shutting down a shale oil well is easy, quick and is not damaging to the overall production of the well when it is opened at a later stage.
So, if US demand is back up to within 2-3 m bl/d versus normal in June and supply in the US and Canada is down by 3.5 to 4.5 m bl/d already in May, then there shouldn’t be a massive wall of oil banging on the door of Cushing Oklahoma to get in in June as was the case in May. As such bookings for Cushing Oklahoma inventory in June should be much less strained in June than in May even if we still see rising inventories there right now.
This lowers the risk significantly for a price crash repetition on the 19th of May when the June contract rolls off comparable to what happened to the WTI May contract on the 20th of April.
US Cushing Oklahoma oil inventories rose another 2.1 m bl/d last week to 65.5 m bl which is on par with levels from 2016 and 2017 and only about 10 m bl below max storage capacity of 76.1 m bl. Inventories are in all practical terms full.
When it starts to move lower it moves rather quickly. Gaza, China, IEA. Brent crude is down 2.1% today to $62/b after having traded as high as $66.58/b last Thursday and above $70/b in late September. The sell-off follows the truce/peace in Gaze, a flareup in US-China trade and yet another bearish oil outlook from the IEA.

A lasting peace in Gaze could drive crude oil at sea to onshore stocks. A lasting peace in Gaza would probably calm down the Houthis and thus allow more normal shipments of crude oil to sail through the Suez Canal, the Red Sea and out through the Bab-el-Mandeb Strait. Crude oil at sea has risen from 48 mb in April to now 91 mb versus a pre-Covid normal of about 50-60 mb. The rise to 91 mb is probably the result of crude sailing around Africa to be shot to pieces by the Houthis. If sailings were to normalize through the Suez Canal, then it could free up some 40 mb in transit at sea moving onshore into stocks.
The US-China trade conflict is of course bearish for demand if it continues.
Bearish IEA yet again. Getting closer to 2026. Credibility rises. We expect OPEC to cut end of 2025. The bearish monthly report from the IEA is what it is, but the closer we get to 2026, the more likely the IEA is of being ball-park right in its outlook. In its monthly report today the IEA estimates that the need for crude oil from OPEC in 2026 will be 25.4 mb/d versus production by the group in September of 29.1 mb/d. The group thus needs to do some serious cutting at the end of 2025 if it wants to keep the market balanced and avoid inventories from skyrocketing. Given that IEA is correct that is. We do however expect OPEC to implement cuts to avoid a large increase in inventories in Q1-26. The group will probably revert to cuts either at its early December meeting when they discuss production for January or in early January when they discuss production for February. The oil price will likely head yet lower until the group reverts to cuts.
Dubai: The Mid-East anchor dragging crude oil lower. Surplus emerging in Mid-East pricing. Crude oil prices held surprisingly strong all through the summer. A sign and a key source of that strength came from the strength in the front-end backwardation of the Dubai crude oil curve. It held out strong from mid-June and all until late September with an average 1-3mth time-spread premium of $1.8/b from mid-June to end of September. The 1-3mth time-spreads for Brent and WTI however were in steady deterioration from late June while their flat prices probably were held up by the strength coming from the Persian Gulf. Then in late September the strength in the Dubai curve suddenly collapsed. Since the start of October it has been weaker than both the Brent and the WTI curves. The Dubai 1-3mth time-spread now only stands at $0.25/b. The Middle East is now exporting more as it is producing more and also consuming less following elevated summer crude burn for power (Aircon) etc.
The only bear-element missing is a sudden and solid rise in OECD stocks. The only thing that is missing for the bear-case everyone have been waiting for is a solid, visible rise in OECD stocks in general and US oil stocks specifically. So watch out for US API indications tomorrow and official US oil inventories on Thursday.
No sign of any kind of fire-sale of oil from Saudi Arabia yet. To what we can see, Saudi Arabia is not at all struggling to sell its oil. It only lowered its Official Selling Prices (OSPs) to Asia marginally for November. A surplus market + Saudi determination to sell its oil to the market would normally lead to a sharp lowering of Saudi OSPs to Asia. Not yet at least and not for November.
The 5yr contract close to fixed at $68/b. Of importance with respect to how far down oil can/will go. When the oil market moves into a surplus then the spot price starts to trade in a large discount to the 5yr contract. Typically $10-15/b below the 5yr contract on average in bear-years (2009, 2015, 2016, 2020). But the 5yr contract is usually pulled lower as well thus making this approach a moving target. But the 5yr contract price has now been rock solidly been pegged to $68/b since 2022. And in the 2022 bull-year (Brent spot average $99/b), the 5yr contract only went to $72/b on average. If we assume that the same goes for the downside and that 2026 is a bear-year then the 5yr goes to $64/b while the spot is trading at a $10-15/b discount to that. That would imply an average spot price next year of $49-54/b. But that is if OPEC doesn’t revert to cuts and instead keeps production flowing. We think OPEC(+) will trim/cut production as needed into 2026 to prevent a huge build-up in global oil stocks and a crash in prices. But for now we are still heading lower. Into the $50ies/b.
Some rebound but not much. Brent crude rebounded 1.5% yesterday to $65.47/b. This morning it is inching 0.2% up to $65.6/b. The lowest close last week was on Thursday at $64.11/b.
The curve structure is almost as week as it was before the weekend. The rebound we now have gotten post the message from OPEC+ over the weekend is to a large degree a rebound along the curve rather than much strengthening at the front-end of the curve. That part of the curve structure is almost as weak as it was last Thursday.
We are still on a weakening path. The message from OPEC+ over the weekend was we are still on a weakening path with rising supply from the group. It is just not as rapidly weakening as was feared ahead of the weekend when a quota hike of 500 kb/d/mth for November was discussed.
The Brent curve is on its way to full contango with Brent dipping into the $50ies/b. Thus the ongoing weakening we have had in the crude curve since the start of the year, and especially since early June, will continue until the Brent crude oil forward curve is in full contango along with visibly rising US and OECD oil inventories. The front-month Brent contract will then flip down towards the $60/b-line and below into the $50ies/b.
At what point will OPEC+ turn to cuts? The big question then becomes: When will OPEC+ turn around to make some cuts? At what (price) point will they choose to stabilize the market? Because for sure they will. Higher oil inventories, some more shedding of drilling rigs in US shale and Brent into the 50ies somewhere is probably where the group will step in.
There is nothing we have seen from the group so far which indicates that they will close their eyes, let the world drown in oil and the oil price crash to $40/b or below.
The message from OPEC+ is also about balance and stability. The world won’t drown in oil in 2026. The message from the group as far as we manage to interpret it is twofold: 1) Taking back market share which requires a lower price for non-OPEC+ to back off a bit, and 2) Oil market stability and balance. It is not just about 1. Thus fretting about how we are all going to drown in oil in 2026 is totally off the mark by just focusing on point 1.
When to buy cal 2026? Before Christmas when Brent hits $55/b and before OPEC+ holds its last meeting of the year which is likely to be in early December.
Brent crude oil prices have rebounded a bit along the forward curve. Not much strengthening in the structure of the curve. The front-end backwardation is not much stronger today than on its weakest level so far this year which was on Thursday last week.

The front-end backwardation fell to its weakest level so far this year on Thursday last week. A slight pickup yesterday and today, but still very close to the weakest year to date. More oil from OPEC+ in the coming months and softer demand and rising inventories. We are heading for yet softer levels.

Down to the lowest since early May. Brent crude has fallen sharply the latest four days. It closed at USD 64.11/b yesterday which is the lowest since early May. It is staging a 1.3% rebound this morning along with gains in both equities and industrial metals with an added touch of support from a softer USD on top.
What stands out the most to us this week is the collapse in the Dubai one to three months time-spread.
Dubai is medium sour crude. OPEC+ is in general medium sour crude production. Asian refineries are predominantly designed to process medium sour crude. So Dubai is the real measure of the balance between OPEC+ holding back or not versus Asian oil demand for consumption and stock building.
A sharp weakening of the front-end of the Dubai curve. The front-end of the Dubai crude curve has been holding out very solidly throughout this summer while the front-end of the Brent and WTI curves have been steadily softening. But the strength in the Dubai curve in our view was carrying the crude oil market in general. A source of strength in the crude oil market. The core of the strength.
The now finally sharp decline of the front-end of the Dubai crude curve is thus a strong shift. Weakness in the Dubai crude marker is weakness in the core of the oil market. The core which has helped to hold the oil market elevated.
Facts supports the weakening. Add in facts of Iraq lifting production from Kurdistan through Turkey. Saudi Arabia lifting production to 10 mb/d in September (normal production level) and lifting exports as well as domestic demand for oil for power for air con is fading along with summer heat. Add also in counter seasonal rise in US crude and product stocks last week. US oil stocks usually decline by 1.3 mb/week this time of year. Last week they instead rose 6.4 mb/week (+7.2 mb if including SPR). Total US commercial oil stocks are now only 2.1 mb below the 2015-19 seasonal average. US oil stocks normally decline from now to Christmas. If they instead continue to rise, then it will be strongly counter seasonal rise and will create a very strong bearish pressure on oil prices.
Will OPEC+ lift its voluntary quotas by zero, 137 kb/d, 500 kb/d or 1.5 mb/d? On Sunday of course OPEC+ will decide on how much to unwind of the remaining 1.5 mb/d of voluntary quotas for November. Will it be 137 kb/d yet again as for October? Will it be 500 kb/d as was talked about earlier this week? Or will it be a full unwind in one go of 1.5 mb/d? We think most likely now it will be at least 500 kb/d and possibly a full unwind. We discussed this in a not earlier this week: ”500 kb/d of voluntary quotas in October. But a full unwind of 1.5 mb/d”
The strength in the front-end of the Dubai curve held out through summer while Brent and WTI curve structures weakened steadily. That core strength helped to keep flat crude oil prices elevated close to the 70-line. Now also the Dubai curve has given in.

Brent crude oil forward curves

Total US commercial stocks now close to normal. Counter seasonal rise last week. Rest of year?

Total US crude and product stocks on a steady trend higher.


Guld och silver stiger hela tiden mot nya höjder
The Mid-East anchor dragging crude oil lower

Samtal om sällsynta jordartsmetaller, guld och silver

Brookfield köper bränsleceller för 5 miljarder USD av Bloom Energy för att driva AI-datacenter

Teck Resources kan förse Nordamerika och kanske hela G7 med all germanium som behövs

OPEC+ missar produktionsmål, stöder oljepriserna

Ett samtal om guld, olja, fjärrvärme och förnybar energi

Guld nära 4000 USD och silver 50 USD, därför kan de fortsätta stiga
Are Ukraine’s attacks on Russian energy infrastructure working?

Goldman Sachs höjer prognosen för guld, tror priset når 4900 USD
-
 Nyheter3 veckor sedan
OPEC+ missar produktionsmål, stöder oljepriserna
-
 Nyheter3 veckor sedan
Ett samtal om guld, olja, fjärrvärme och förnybar energi
-
 Nyheter2 veckor sedan
Guld nära 4000 USD och silver 50 USD, därför kan de fortsätta stiga
-
Analys3 veckor sedan
Are Ukraine’s attacks on Russian energy infrastructure working?
-
 Nyheter1 vecka sedan
Goldman Sachs höjer prognosen för guld, tror priset når 4900 USD
-

 Nyheter2 veckor sedan
Blykalla och amerikanska Oklo inleder ett samarbete
-

 Nyheter3 veckor sedan
Guldpriset uppe på nya höjder, nu 3750 USD
-
Nyheter2 veckor sedan
Ett samtal om guld, olja, koppar och stål