

Analys
Shale producers ramp up production as pipes to Gulf opens


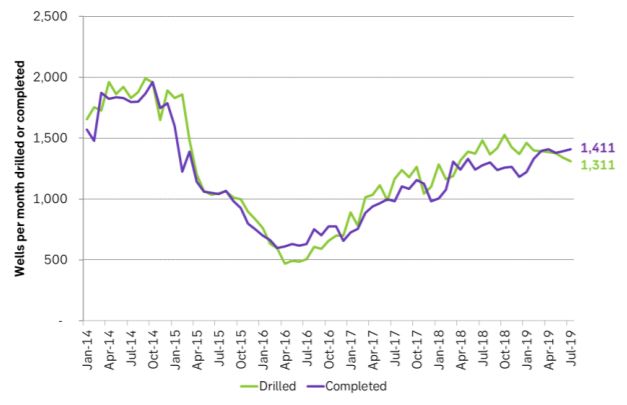
Yesterday’s report on US shale oil drilling from the EIA was mostly depressing reading for global oil producers. It showed that the completion of wells rose to 1411 wells in July (+19 MoM) and the highest nominal level since early 2015. As a result the marginal, annualized US shale oil production growth rate rose to a projected 1.0 m bl/d in September which was up from a growth rate of 0.6 m bl/d.
Shale oil producers drilled fewer wells (down 31 to 1311 wells) which is consistent with the ongoing decline in drilling rigs which have declined by 124 rigs to 764 oil rigs since November last year. With a productivity of about 1.5 drilled wells per drilling rig in operation this means that close to 200 fewer wells are being drilled today.

Instead producers are focusing on completing wells. Drilling less and completing more meant that the number of drilled but uncompleted wells declined by 100 wells to 8,108. The DUC inventory is still 2,850 wells higher than the low point in late 2016. This means that producers can continue to throw out drilling rigs while still maintaining or increasing the number of wells completed per month and thus increase production.
The hope has been that the declining drilling rig count which now has been ongoing for 9 months with investors rioting against producers losing money demanding spending discipline, positive cash flow and profits would now start to materialize into a declining rate of well completions as well. This would naturally lead to softer production growth or even production decline.
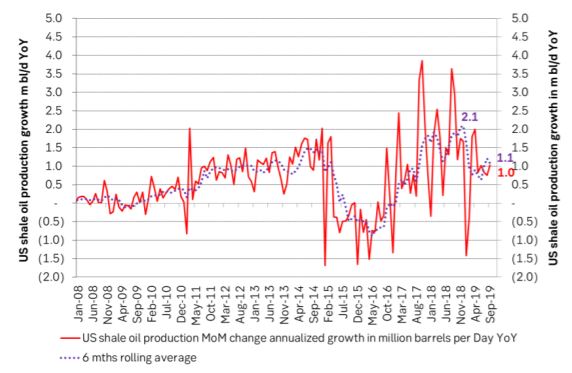
In the previous report the estimated marginal, annualized production growth rate was only 0.6 m bl/d. We estimated then that it would only take a reduction in monthly well completions of 109 wells in order to drive US shale oil production to zero growth. I.e. it would not take much to drive growth to zero. Well completions per month would only have to decline from 1383 in June to 1274 and voila US shale oil production growth would have halted to zero. That did not happen. Instead the well completion rose to 1411 in July thus driving estimated the marginal, annualized production growth rate to 1.0 m bl/d in September.
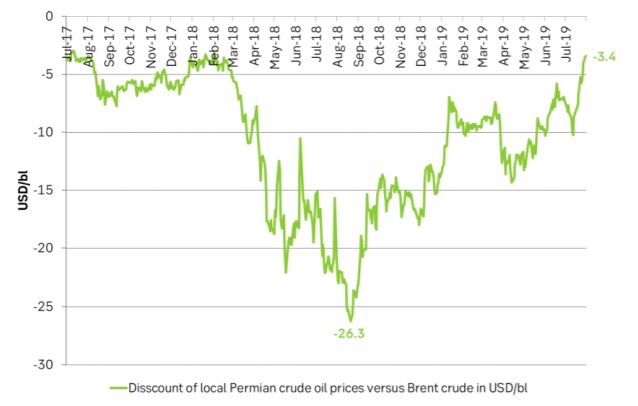
Last year we witnessed that the local, Permian (Midland) crude oil price traded at a discount of as much as $26/bl below the Brent crude oil price as production was locked in both Permian and Cushing. So far this year the discount has mostly been varying between -$15/bl and -$5/bl. The writing on the wall for Permian shale oil producers has been that if they accelerated completions and production they would just kill the local price and the marginal value of production.
Now however transportation capacity out of the Permian is rapidly opening up to the US Gulf. The Cactus II (670 k bl/d) from the Permian to Corpus Christi (US Gulf) opened in early August and much more is coming later this year and early next year. As a result the local Permian crude oil price is now only -$3.4/bl below the Brent crude oil price. And even more important is that Permian producers now know that they can ramp up well completions and production without killing the local crude oil price.
Permian producers are moving from an obvious price setter position locally in the Permian to a perceived global oil price taker. Though in fact they will in the end also be the price setter in the global market place if they just ramp up well completions and production.
Our fear as well as OPEC’s fear and global oil producers fear is that Permian shale oil producers now will focus intensely on well completions. They have 3,999 drilled but uncompleted wells to draw down and they can now accelerate production without the risk of killing the local oil price. Well completions are after all equal to production and production is money in the pocket while drilling in itself is only spending.
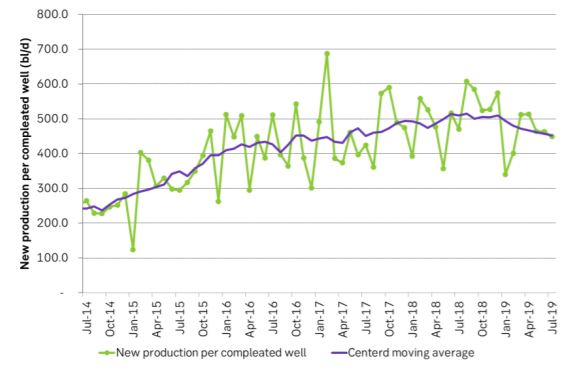
There were a few positive elements in yesterday’s numbers seen from the eyes of global oil producers. Increased well completion was basically a Permian thing with completions on average declining elsewhere. Productivity of new wells continued to decline. This is counter to the headline productivity numbers from the US EIA. EIA is calculating drilling rig productivity and not well productivity. In addition they are not adjusting for a build or a draw in the DUC inventory. When the number of DUCs is increasing they under estimate drilling productivity and when the number of DUCs is declining they over estimate drilling productivity. They do not specify well productivity though which is declining in our numbers.
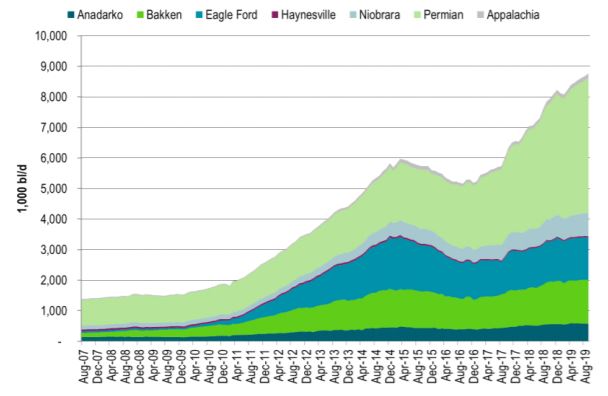
Ch1: The local Permian crude oil price discount to Brent crude has rapidly evaporated as the Cactus II from Permian to Corpus Christi has opened up. Now Permian producers can ramp up well completions without the risk of killing the local oil price.
Ch2: Drilling continued to decline but well completions rose to the highest nominal rate since early 2015. When drilling has declined long enough it is clear that well completions will have to decline as well. With a large DUC inventory we do however seem to be far from that point in time yet. The US DUC inventory stood at 8,108 in July, up 2,850 since late 2016.
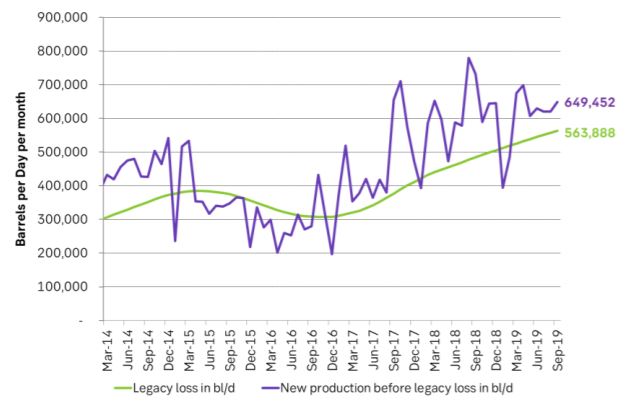
Ch3: This is driving estimated new production in September up and away from losses in existing production. Thus marginal annualized production growth accelerated to 1.0 m bl/d in September.
Ch4: Marginal, annualized shale oil production growth rose to an estimated 1.0 m bl/d per year. Clearly down from the extremely strong production growth last year of up to 2 m bl/d growth rate. But still up versus last months report of a rate of 0.6 m bl/d per year with hopes then that the rate would decline further.
Ch5: Overall well productivity continued to deteriorate with latest 7 data points all below the average of the previous 7 points. This could be a function of the DUC inventory draw down. When the inventory rose producers took every 10th well and put it into the DUC inventory. It is logical that producers threw the 10% least promissing wells into the DUC inventory. This then led to an overestimation of the well productivity. Now that the DUC inventory is drawing down producers will have a 20% share of less performing wells. Thus further DUC inventory draw should lead to further overall well productivity.
Ch6: US shale oil production growth has slowed. Could it accelerate again now that pipes out of the Permian are opening up?
Rebounding along with most markets. But concerns over solidity of Gaza peace may also contribute. Brent crude fell 0.8% yesterday to $61.91/b and its lowest close since May this year. This morning it is bouncing up 0.9% to $62.5/b along with a softer USD amid positive sentiment with both equities and industrial metals moving higher. Concerns that the peace in Gaza may be less solid than what one might hope for also yields some support to Brent. Bets on tech stocks are rebounding, defying fears of trade war. Money moving back into markets. Gold continues upwards its strong trend and a softer dollar helps it higher today as well.

US crude & products probably rose 5.6 mb last week (API) versus a normal seasonal decline of 2.4 mb. The US API last night partial and thus indicative data for US oil inventories. Their data indicates that US crude stocks rose 7.4 mb last week, gasoline stocks rose 3.0 mb while Distillate stocks fell 4.8 mb. Altogether an increase in commercial crude and product stocks of 5.6 mb. Commercial US crude and product stocks normally decline by 2.4 mb this time of year. So seasonally adjusted the US inventories rose 8 mb last week according to the indicative numbers by the API. That is a lot. Also, the counter seasonal trend of rising stocks versus normally declining stocks this time of year looks on a solid pace of continuation. If the API is correct then total US crude and product stocks would stand 41 mb higher than one year ago and 6 mb higher than the 2015-19 average. And if we combine this with our knowledge of a sharp increase in production and exports by OPEC(+) and a large increase in oil at sea, then the current trend in US oil inventories looks set to continue. So higher stocks and lower crude oil prices until OPEC(+) switch to cuts. Actual US oil inventory data today at 18:00 CET.
US commercial crude and product stocks rising to 1293 mb in week 41 if last nights indicative numbers from API are correct.

Crude oil soon coming to a port near you. OPEC has lifted production sharply higher this autumn. At the same time demand for oil in the Middle-East has fallen as we have moved out of summer heat and crude oil burn for power for air-conditioning. The Middle-East oil producers have thus been able to lift exports higher on both accounts. Crude oil and condensates on water has shot up by 177 mb since mid-August. This oil is now on its way to ports around the world. And when they arrive, it will likely help to lift stocks onshore higher. That is probably when we will lose the last bit of front-end backwardation the the crude oil curves. That will help to drive the front-month Brent crude oil price down to the $60/b line and revisit the high $50ies/b. Then the eyes will be all back on OPEC+ when they meet in early November and then again in early December.
Crude oil and condensates at sea have moved straight up by 177 mb since mid-August as OPEC(+) has produced more, consumed less and exported more.

When it starts to move lower it moves rather quickly. Gaza, China, IEA. Brent crude is down 2.1% today to $62/b after having traded as high as $66.58/b last Thursday and above $70/b in late September. The sell-off follows the truce/peace in Gaze, a flareup in US-China trade and yet another bearish oil outlook from the IEA.
A lasting peace in Gaze could drive crude oil at sea to onshore stocks. A lasting peace in Gaza would probably calm down the Houthis and thus allow more normal shipments of crude oil to sail through the Suez Canal, the Red Sea and out through the Bab-el-Mandeb Strait. Crude oil at sea has risen from 48 mb in April to now 91 mb versus a pre-Covid normal of about 50-60 mb. The rise to 91 mb is probably the result of crude sailing around Africa to be shot to pieces by the Houthis. If sailings were to normalize through the Suez Canal, then it could free up some 40 mb in transit at sea moving onshore into stocks.
The US-China trade conflict is of course bearish for demand if it continues.
Bearish IEA yet again. Getting closer to 2026. Credibility rises. We expect OPEC to cut end of 2025. The bearish monthly report from the IEA is what it is, but the closer we get to 2026, the more likely the IEA is of being ball-park right in its outlook. In its monthly report today the IEA estimates that the need for crude oil from OPEC in 2026 will be 25.4 mb/d versus production by the group in September of 29.1 mb/d. The group thus needs to do some serious cutting at the end of 2025 if it wants to keep the market balanced and avoid inventories from skyrocketing. Given that IEA is correct that is. We do however expect OPEC to implement cuts to avoid a large increase in inventories in Q1-26. The group will probably revert to cuts either at its early December meeting when they discuss production for January or in early January when they discuss production for February. The oil price will likely head yet lower until the group reverts to cuts.
Dubai: The Mid-East anchor dragging crude oil lower. Surplus emerging in Mid-East pricing. Crude oil prices held surprisingly strong all through the summer. A sign and a key source of that strength came from the strength in the front-end backwardation of the Dubai crude oil curve. It held out strong from mid-June and all until late September with an average 1-3mth time-spread premium of $1.8/b from mid-June to end of September. The 1-3mth time-spreads for Brent and WTI however were in steady deterioration from late June while their flat prices probably were held up by the strength coming from the Persian Gulf. Then in late September the strength in the Dubai curve suddenly collapsed. Since the start of October it has been weaker than both the Brent and the WTI curves. The Dubai 1-3mth time-spread now only stands at $0.25/b. The Middle East is now exporting more as it is producing more and also consuming less following elevated summer crude burn for power (Aircon) etc.
The only bear-element missing is a sudden and solid rise in OECD stocks. The only thing that is missing for the bear-case everyone have been waiting for is a solid, visible rise in OECD stocks in general and US oil stocks specifically. So watch out for US API indications tomorrow and official US oil inventories on Thursday.
No sign of any kind of fire-sale of oil from Saudi Arabia yet. To what we can see, Saudi Arabia is not at all struggling to sell its oil. It only lowered its Official Selling Prices (OSPs) to Asia marginally for November. A surplus market + Saudi determination to sell its oil to the market would normally lead to a sharp lowering of Saudi OSPs to Asia. Not yet at least and not for November.
The 5yr contract close to fixed at $68/b. Of importance with respect to how far down oil can/will go. When the oil market moves into a surplus then the spot price starts to trade in a large discount to the 5yr contract. Typically $10-15/b below the 5yr contract on average in bear-years (2009, 2015, 2016, 2020). But the 5yr contract is usually pulled lower as well thus making this approach a moving target. But the 5yr contract price has now been rock solidly been pegged to $68/b since 2022. And in the 2022 bull-year (Brent spot average $99/b), the 5yr contract only went to $72/b on average. If we assume that the same goes for the downside and that 2026 is a bear-year then the 5yr goes to $64/b while the spot is trading at a $10-15/b discount to that. That would imply an average spot price next year of $49-54/b. But that is if OPEC doesn’t revert to cuts and instead keeps production flowing. We think OPEC(+) will trim/cut production as needed into 2026 to prevent a huge build-up in global oil stocks and a crash in prices. But for now we are still heading lower. Into the $50ies/b.
Some rebound but not much. Brent crude rebounded 1.5% yesterday to $65.47/b. This morning it is inching 0.2% up to $65.6/b. The lowest close last week was on Thursday at $64.11/b.
The curve structure is almost as week as it was before the weekend. The rebound we now have gotten post the message from OPEC+ over the weekend is to a large degree a rebound along the curve rather than much strengthening at the front-end of the curve. That part of the curve structure is almost as weak as it was last Thursday.
We are still on a weakening path. The message from OPEC+ over the weekend was we are still on a weakening path with rising supply from the group. It is just not as rapidly weakening as was feared ahead of the weekend when a quota hike of 500 kb/d/mth for November was discussed.
The Brent curve is on its way to full contango with Brent dipping into the $50ies/b. Thus the ongoing weakening we have had in the crude curve since the start of the year, and especially since early June, will continue until the Brent crude oil forward curve is in full contango along with visibly rising US and OECD oil inventories. The front-month Brent contract will then flip down towards the $60/b-line and below into the $50ies/b.
At what point will OPEC+ turn to cuts? The big question then becomes: When will OPEC+ turn around to make some cuts? At what (price) point will they choose to stabilize the market? Because for sure they will. Higher oil inventories, some more shedding of drilling rigs in US shale and Brent into the 50ies somewhere is probably where the group will step in.
There is nothing we have seen from the group so far which indicates that they will close their eyes, let the world drown in oil and the oil price crash to $40/b or below.
The message from OPEC+ is also about balance and stability. The world won’t drown in oil in 2026. The message from the group as far as we manage to interpret it is twofold: 1) Taking back market share which requires a lower price for non-OPEC+ to back off a bit, and 2) Oil market stability and balance. It is not just about 1. Thus fretting about how we are all going to drown in oil in 2026 is totally off the mark by just focusing on point 1.
When to buy cal 2026? Before Christmas when Brent hits $55/b and before OPEC+ holds its last meeting of the year which is likely to be in early December.
Brent crude oil prices have rebounded a bit along the forward curve. Not much strengthening in the structure of the curve. The front-end backwardation is not much stronger today than on its weakest level so far this year which was on Thursday last week.

The front-end backwardation fell to its weakest level so far this year on Thursday last week. A slight pickup yesterday and today, but still very close to the weakest year to date. More oil from OPEC+ in the coming months and softer demand and rising inventories. We are heading for yet softer levels.


Vad guldets uppgång egentligen betyder för världen

Spotpriset på guld över 4300 USD och silver över 54 USD
Crude oil soon coming to a port near you

Guld och silver stiger hela tiden mot nya höjder
The Mid-East anchor dragging crude oil lower

OPEC+ missar produktionsmål, stöder oljepriserna

Ett samtal om guld, olja, fjärrvärme och förnybar energi

Goldman Sachs höjer prognosen för guld, tror priset når 4900 USD
Guld nära 4000 USD och silver 50 USD, därför kan de fortsätta stiga
Are Ukraine’s attacks on Russian energy infrastructure working?
-
 Nyheter3 veckor sedan
OPEC+ missar produktionsmål, stöder oljepriserna
-
 Nyheter4 veckor sedan
Ett samtal om guld, olja, fjärrvärme och förnybar energi
-
 Nyheter2 veckor sedan
Goldman Sachs höjer prognosen för guld, tror priset når 4900 USD
-
 Nyheter2 veckor sedan
Guld nära 4000 USD och silver 50 USD, därför kan de fortsätta stiga
-
Analys4 veckor sedan
Are Ukraine’s attacks on Russian energy infrastructure working?
-

 Nyheter3 veckor sedan
Blykalla och amerikanska Oklo inleder ett samarbete
-

 Nyheter4 veckor sedan
Guldpriset uppe på nya höjder, nu 3750 USD
-
Nyheter3 veckor sedan
Ett samtal om guld, olja, koppar och stål