

Analys
Shale oil denial once again?

 Price action – Dollar headwinds driving speculators to take money off the table
Equities across the board rebounded 0.7% ydy following the recent North Korea driven sell-off. The USD Index however gained 0.4% on the day which helped to drive all commodity indices lower with the overall Blbrg commodity index down 0.7% with energy losing the most. Brent crude sold down 2.6% closing at $50.73/b while the longer dated Brent Dec 2020 contract only lost 1% closing at $52.62/b.
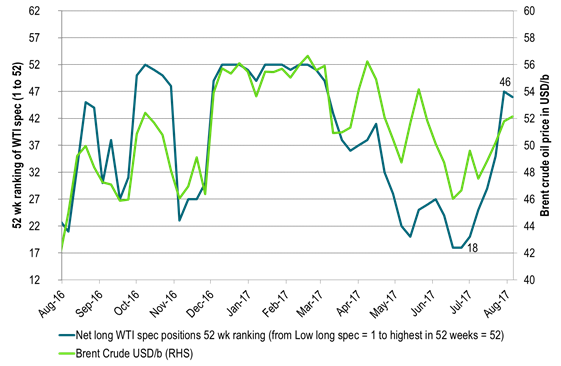
Since a Brent crude oil price low of $44.35/b in June 21st net long speculative WTI positions have moved in only one direction – up. Since then the number of net long speculative WTI contracts have increased by 156,000 contracts (+42%) or 156 mb. As of Tuesday last week the number of net long speculative WTI contracts stood at 532,000 contracts which was the 7th highest speculative position over the past 52 weeks. Except for the release of the US EIA’s monthly Drilling Productivity report there was little in the news that warranted the 2.6% sell-off in Brent crude oil prices other than speculators taking money off the table following 7 consecutive weeks of rising long bets.
Crude oil comment – Shale oil denial once again?
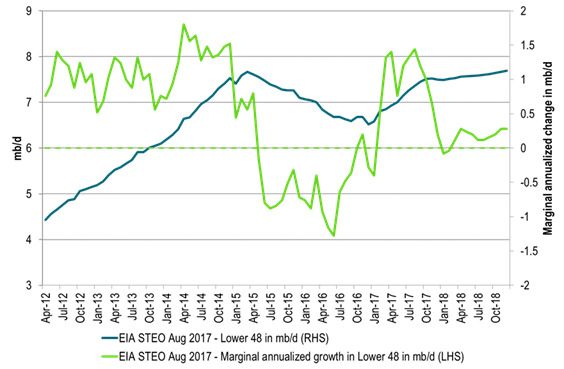
What puzzles us a lot is graph 2 below. It shows the US EIA’s projection of US crude oil production coming out of Lower 48 states (i.e. ex Gulf of Mexico and Alaska). Thus it basically constitutes US shale oil production even though it includes a million or two of US crude production which is not shale oil as well.
What the the US EIA STEO August report projects is that from January to September the marginal, annualized Lower 48 crude oil production growth has averaged 1.25 mb/d. That we buy into. Then however, from October 2017 onwards their projected growth rate then suddenly collapse to a marginal annualized growth rate of only +0.2 mb/d all to the end of 2018 (on average).
When the US shale oil production was booming from 2011 to 2015 the story was always that yes, production is growing strongly now, but next year it will taper off. The tapering off never happened before the oil price collapsed and all breaks were on. During 2012, 2013 and 2014 the US shale oil production grew relentlessly at an annual pace of 1 mb/d.
Thus even if the market is fully aware of US shale oil these days. Fully aware that rigs are rising and productivity is rising. The story still looks a bit the same in terms of what the US EIA currently is projecting in its August STEO report. Yes, shale oil is growing at a strong marginal, annual pace now, but from October onwards it is all going to slow sharply. Thus shale oil awareness is definitely there but is it again too pesimistic in terms of volumes delivered down the road just as was the case consistently from 2012 to 2014/15. Still some kind of shale oil denial in a way in terms of production down the road.
Yesterday the US EIA released its drilling productivity report (DPR) and its DUC’s report (Drilled wells and uncompleted wells). First out the reports stated a projection that US shale oil production will increase by 117 kb/d mth/mth to September. That equals a marginal, annualized pace of 1.4 mb/d per year. The puzzle is that the EIA projects that this strong growth rate is going to suddenly fall back in October onwards.
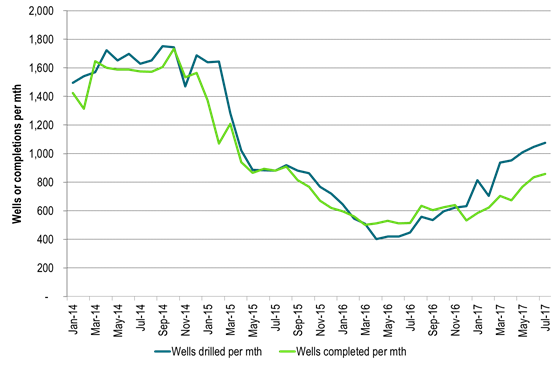
What was further revealed was that the number of completed wells per month continued to rise by 25 wells mth/mth to 859 wells in July. Completions were however still trailing way behind the number of wells drilled by more than 200 wells. Wells drilled reached 1075 wells in July which also was an increase mth/mth by 28 wells. Thus completions are rising but are still solidly trailing behind drilling of wells.
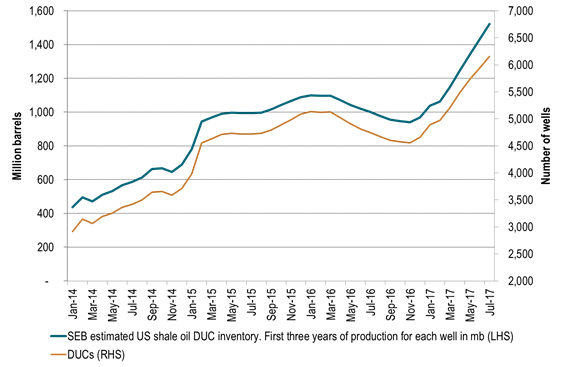
For US shale oil production to slow down we first need to see a halt in the number of drilling rigs being added into operation. Only 2 implied shale oil rigs were added last week, but the number is still rising marginally rather than falling. But yes, that part is slowing down. The next step then is to see that completions manage to catch up with drilling. I.e. completions needs to move from a July level of 859 wells completed to at least 1075 wells drilled. Then the last step is that completions start to draw down the now very high DUC inventory which has seen an increase of 1595 wells since November 2016 now standing at 6154 wells.
So during the unavoidable (some time in the future) draw down period of DUCs we need to see that completions move above drilled wells per month in order to draw down the DUC inventory. I.e. the number of wells completed should move above 1075 wells per month unless of course the number of drilling rigs declines. A lower oil price or reduced access to capital is typically the driving forces which would lead to a reduction in drilling rigs. Captial spending and profitability is definitely at the top end of the agenda these days in the shale oil space.
In terms of the DUC inventory build up. In perspective the 1595 wells added since November last year equates to some 5-600 million barrels of additional producible oil within a three year time frame. That is if we assume 350,000 barrels of oil from each well during the first three years of production on average for all wells.
In this perspective it is difficult to understand the US EIA’s projection that US L48 crude oil production growth is going to slow sharply from October onwards. Drilling rigs are still rising (although slowly) and completions still has a lot of catching up to do just to get up to speed with drilling and then some to draw down the DUC inventory.
Not surprisingly we are bullish for US crude oil production for 2018 where we expect US crude oil production to increase y/y by 1.5 mb/d rather than the US EIA’s y/y projecting that US crude oil will only increase 0.6 mb/d y/y to 2018.
OPEC will have a lont on its hands in 2018 and will likely need to manage supply all through to the end of 2018 rather than to end of Q1-17.
(Data for drilling and completions etc in this report were for the regions Anadarko, Bakken, Eagle Ford, Niobrara and Permian and are from the US EIA.)
Ch1 – Net long specs in WTI reached the 7th highest in a year last Tuesday
A strong, long rise in net long spec since the price low in late June
Sideways price action during most of August with no success to the upside when Brent hit $53.64/b.
Then dollar headwinds and North Korea risk aversion. Both pushing specs to take money off the table
Oil prices in graph are averaged over weeks ending Tuesday. Same as specs reporting
Ch2 – US EIA STEO August report projects a sharp slowdown in marginal growth in US L48 crude oil production from October onwards
How is that possible when drilling rig count is still rising and completions are still working hard catching up rising as well.
Ch3 – Completions of shale wells rising as they try to catch up to drilled wells per month which is also rising (US EIA August DUC report)
Today’s level looks unimpressive versus 2014 levels. But they need to be adjusted with productivity improvements
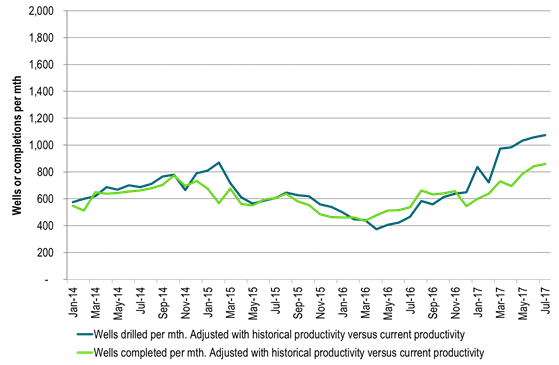
Ch3 – Productivity adjusted – Completions of shale wells rising as they try to catch up to drilled wells per month which is also rising (US EIA August DUC report)
If we productivity adjust the historical data of number of wells drilled and completed with productivity then:
a) Number of drilled wells today per month is 40% higher then the previous peak in September 2014
b) Number of completed wells is 11% higher than the previous peak in October 2014
If completions catches up to current drilling then completions will run 40% higher than the previous peak in October 2014 in productivity adjusted terms.
Ch 4 – Strong rise in DUC (uncompleted wells) inventory since November last year
Equating it to oil it has increased close to 600 mb since Nov last year in terms of oil from first three years of production each well
Kind regards
Bjarne Schieldrop
Chief analyst, Commodities
SEB Markets
Merchant Banking
Some rebound but not much. Brent crude rebounded 1.5% yesterday to $65.47/b. This morning it is inching 0.2% up to $65.6/b. The lowest close last week was on Thursday at $64.11/b.

The curve structure is almost as week as it was before the weekend. The rebound we now have gotten post the message from OPEC+ over the weekend is to a large degree a rebound along the curve rather than much strengthening at the front-end of the curve. That part of the curve structure is almost as weak as it was last Thursday.
We are still on a weakening path. The message from OPEC+ over the weekend was we are still on a weakening path with rising supply from the group. It is just not as rapidly weakening as was feared ahead of the weekend when a quota hike of 500 kb/d/mth for November was discussed.
The Brent curve is on its way to full contango with Brent dipping into the $50ies/b. Thus the ongoing weakening we have had in the crude curve since the start of the year, and especially since early June, will continue until the Brent crude oil forward curve is in full contango along with visibly rising US and OECD oil inventories. The front-month Brent contract will then flip down towards the $60/b-line and below into the $50ies/b.
At what point will OPEC+ turn to cuts? The big question then becomes: When will OPEC+ turn around to make some cuts? At what (price) point will they choose to stabilize the market? Because for sure they will. Higher oil inventories, some more shedding of drilling rigs in US shale and Brent into the 50ies somewhere is probably where the group will step in.
There is nothing we have seen from the group so far which indicates that they will close their eyes, let the world drown in oil and the oil price crash to $40/b or below.
The message from OPEC+ is also about balance and stability. The world won’t drown in oil in 2026. The message from the group as far as we manage to interpret it is twofold: 1) Taking back market share which requires a lower price for non-OPEC+ to back off a bit, and 2) Oil market stability and balance. It is not just about 1. Thus fretting about how we are all going to drown in oil in 2026 is totally off the mark by just focusing on point 1.
When to buy cal 2026? Before Christmas when Brent hits $55/b and before OPEC+ holds its last meeting of the year which is likely to be in early December.
Brent crude oil prices have rebounded a bit along the forward curve. Not much strengthening in the structure of the curve. The front-end backwardation is not much stronger today than on its weakest level so far this year which was on Thursday last week.

The front-end backwardation fell to its weakest level so far this year on Thursday last week. A slight pickup yesterday and today, but still very close to the weakest year to date. More oil from OPEC+ in the coming months and softer demand and rising inventories. We are heading for yet softer levels.

Down to the lowest since early May. Brent crude has fallen sharply the latest four days. It closed at USD 64.11/b yesterday which is the lowest since early May. It is staging a 1.3% rebound this morning along with gains in both equities and industrial metals with an added touch of support from a softer USD on top.
What stands out the most to us this week is the collapse in the Dubai one to three months time-spread.
Dubai is medium sour crude. OPEC+ is in general medium sour crude production. Asian refineries are predominantly designed to process medium sour crude. So Dubai is the real measure of the balance between OPEC+ holding back or not versus Asian oil demand for consumption and stock building.
A sharp weakening of the front-end of the Dubai curve. The front-end of the Dubai crude curve has been holding out very solidly throughout this summer while the front-end of the Brent and WTI curves have been steadily softening. But the strength in the Dubai curve in our view was carrying the crude oil market in general. A source of strength in the crude oil market. The core of the strength.
The now finally sharp decline of the front-end of the Dubai crude curve is thus a strong shift. Weakness in the Dubai crude marker is weakness in the core of the oil market. The core which has helped to hold the oil market elevated.
Facts supports the weakening. Add in facts of Iraq lifting production from Kurdistan through Turkey. Saudi Arabia lifting production to 10 mb/d in September (normal production level) and lifting exports as well as domestic demand for oil for power for air con is fading along with summer heat. Add also in counter seasonal rise in US crude and product stocks last week. US oil stocks usually decline by 1.3 mb/week this time of year. Last week they instead rose 6.4 mb/week (+7.2 mb if including SPR). Total US commercial oil stocks are now only 2.1 mb below the 2015-19 seasonal average. US oil stocks normally decline from now to Christmas. If they instead continue to rise, then it will be strongly counter seasonal rise and will create a very strong bearish pressure on oil prices.
Will OPEC+ lift its voluntary quotas by zero, 137 kb/d, 500 kb/d or 1.5 mb/d? On Sunday of course OPEC+ will decide on how much to unwind of the remaining 1.5 mb/d of voluntary quotas for November. Will it be 137 kb/d yet again as for October? Will it be 500 kb/d as was talked about earlier this week? Or will it be a full unwind in one go of 1.5 mb/d? We think most likely now it will be at least 500 kb/d and possibly a full unwind. We discussed this in a not earlier this week: ”500 kb/d of voluntary quotas in October. But a full unwind of 1.5 mb/d”
The strength in the front-end of the Dubai curve held out through summer while Brent and WTI curve structures weakened steadily. That core strength helped to keep flat crude oil prices elevated close to the 70-line. Now also the Dubai curve has given in.

Brent crude oil forward curves

Total US commercial stocks now close to normal. Counter seasonal rise last week. Rest of year?

Total US crude and product stocks on a steady trend higher.

Analys
OPEC+ will likely unwind 500 kb/d of voluntary quotas in October. But a full unwind of 1.5 mb/d in one go could be in the cards
Down to mid-60ies as Iraq lifts production while Saudi may be tired of voluntary cut frugality. The Brent December contract dropped 1.6% yesterday to USD 66.03/b. This morning it is down another 0.3% to USD 65.8/b. The drop in the price came on the back of the combined news that Iraq has resumed 190 kb/d of production in Kurdistan with exports through Turkey while OPEC+ delegates send signals that the group will unwind the remaining 1.65 mb/d (less the 137 kb/d in October) of voluntary cuts at a pace of 500 kb/d per month pace.
Signals of accelerated unwind and Iraqi increase may be connected. Russia, Kazakhstan and Iraq were main offenders versus the voluntary quotas they had agreed to follow. Russia had a production ’debt’ (cumulative overproduction versus quota) of close to 90 mb in March this year while Kazakhstan had a ’debt’ of about 60 mb and the same for Iraq. This apparently made Saudi Arabia angry this spring. Why should Saudi Arabia hold back if the other voluntary cutters were just freeriding? Thus the sudden rapid unwinding of voluntary cuts. That is at least one angle of explanations for the accelerated unwinding.
If the offenders with production debts then refrained from lifting production as the voluntary cuts were rapidly unwinded, then they could ’pay back’ their ’debts’ as they would under-produce versus the new and steadily higher quotas.
Forget about Kazakhstan. Its production was just too far above the quotas with no hope that the country would hold back production due to cross-ownership of oil assets by international oil companies. But Russia and Iraq should be able to do it.
Iraqi cumulative overproduction versus quotas could reach 85-90 mb in October. Iraq has however steadily continued to overproduce by 3-5 mb per month. In July its new and gradually higher quota came close to equal with a cumulative overproduction of only 0.6 mb that month. In August again however its production had an overshoot of 100 kb/d or 3.1 mb for the month. Its cumulative production debt had then risen to close to 80 mb. We don’t know for September yet. But looking at October we now know that its production will likely average close to 4.5 mb/d due to the revival of 190 kb/d of production in Kurdistan. Its quota however will only be 4.24 mb/d. Its overproduction in October will thus likely be around 250 kb/d above its quota with its production debt rising another 7-8 mb to a total of close to 90 mb.
Again, why should Saudi Arabia be frugal while Iraq is freeriding. Better to get rid of the voluntary quotas as quickly as possible and then start all over with clean sheets.
Unwinding the remaining 1.513 mb/d in one go in October? If OPEC+ unwinds the remaining 1.513 mb/d of voluntary cuts in one big go in October, then Iraq’s quota will be around 4.4 mb/d for October versus its likely production of close to 4.5 mb/d for the coming month..
OPEC+ should thus unwind the remaining 1.513 mb/d (1.65 – 0.137 mb/d) in one go for October in order for the quota of Iraq to be able to keep track with Iraq’s actual production increase.
October 5 will show how it plays out. But a quota unwind of at least 500 kb/d for Oct seems likely. An overall increase of at least 500 kb/d in the voluntary quota for October looks likely. But it could be the whole 1.513 mb/d in one go. If the increase in the quota is ’only’ 500 kb/d then Iraqi cumulative production will still rise by 5.7 mb to a total of 85 mb in October.
Iraqi production debt versus quotas will likely rise by 5.7 mb in October if OPEC+ only lifts the overall quota by 500 kb/d in October. Here assuming historical production debt did not rise in September. That Iraq lifts its production by 190 kb/d in October to 4.47 mb/d (August level + 190 kb/d) and that OPEC+ unwinds 500 kb/d of the remining quotas in October when they decide on this on 5 October.


Teck Resources kan förse Nordamerika och kanske hela G7 med all germanium som behövs

Leading Edge Materials är på rätt plats i rätt tid

Oljepriset faller efter ny handelskonflikt mellan USA och Kina

Christian Kopfer kommenterar guld, koppar, olja och stål, samt några råvarubolag

Silver spränger den magiska gränsen, kostar nu över 50 USD per uns

Kinas elproduktion slog nytt rekord i augusti, vilket även kolkraft gjorde

Tyskland har så höga elpriser att företag inte har råd att använda elektricitet

Det stigande guldpriset en utmaning för smyckesköpare

OPEC+ missar produktionsmål, stöder oljepriserna

Ett samtal om guld, olja, fjärrvärme och förnybar energi
-
 Nyheter4 veckor sedan
Kinas elproduktion slog nytt rekord i augusti, vilket även kolkraft gjorde
-
Nyheter4 veckor sedan
Tyskland har så höga elpriser att företag inte har råd att använda elektricitet
-
 Nyheter4 veckor sedan
Det stigande guldpriset en utmaning för smyckesköpare
-
 Nyheter2 veckor sedan
OPEC+ missar produktionsmål, stöder oljepriserna
-
 Nyheter3 veckor sedan
Ett samtal om guld, olja, fjärrvärme och förnybar energi
-
Analys4 veckor sedan
Brent crude ticks higher on tension, but market structure stays soft
-
Analys3 veckor sedan
Are Ukraine’s attacks on Russian energy infrastructure working?
-

 Nyheter1 vecka sedan
Guld nära 4000 USD och silver 50 USD, därför kan de fortsätta stiga