

Analys
SEB – Råvarukommentarer vecka 30

Sammanfattning av rekommendationer
Råvara – Rekommendation
Råolja – Köp OLJA S
Guld – Köp BULL GULD X4 S
Silver – Ingen rekommendation
Koppar – Köp KOPPAR S
Zink – Ingen rekommendation
Kaffe – Köp KAFFE S
Socker – Möjligen köp av SHORT SOCKE A S
Vete – Köp VETE S
Majs – Köp MAJS S
Sojabönor – Köp SOJABO S
Inledning
Den senaste månaden har majspriset stigit med 26%. Chicagovetet har gått upp med 25% och kostar nu återigen, för alla löptider, mer än Matif:s kvarnvete. Matif-vetet har ”bara” stigit med 18%. Sojabönorna med 14%. Vi fortsätter att ha en vy om högre priser på vete, maltkorn, majs, och sojabönor.
Vi har i princip köprekommendation på alla metaller, med tanke på stimulanser i Kina och att investeringar som vanligt sker under andra halvåret. Ett eventuellt QE3 kan också hjälpa till.
Europas problem är hotet mot väntade prisuppgångar.
Tekniskt börjar metallerna förlora momentum nedåt och ser ut att bottna ur från nedåtgående trender till sidledes. Produktionskostnaden ligger på de här nivåerna på metaller, utom för koppar. Det gör att det finns ett ”fundamentalt golv” för metallpriserna på nuvarande nivåer.
Brent tycker vi att man bör köpa på ”dippar” under 100 dollar.
Råolja – Brent
Den senaste månaden har priset på brentolja stigit upp från 90 dollar. Nu ligger priset över 100 dollar per fat. Orosmolnet är krisen i EU. Vad skulle hända om krisen förvärrades? Det är trots allt tämligen troligt, trots att ECB-chefen Mario Draghi idag drog i med brösttoner och försäkrade att ECB har oändligt stöd bland EU:s ledande politiker att lösa vilket problem som helst. Frågan är om en akut kris skulle leda till samma tvärnit i oljeefterfrågan som Lehman-krisen gjorde. Sedan 2005 producerade då OPEC så mycket de kunde, men när oljepriset i spåren efter Lehmankrisen fallit ner till 40 dollar lyckades Saudierna begränsa produktionen så att utbudet kunde dämpas och åstadkomma en effekt på priset.
Idag är beredskapen större än då. OPEC och saudierna har 2008 i gott minne. ECB likaså, liksom alla vi andra. Vi tror därför inte att ett prisfall på olja kan bli lika allvarligt, om en kris liknande Lehman-konkursen skulle inträffa. I och för sig är ett konkursande land inte lika stort som när en bank går omkull. Det är naturligtvis mycket större. Så det återstår att se vad som händer.
Just nu ligger priset på Brent för spotleverans över 100 dollar per fat och snittet hittills i år är 112.2 dollar per fat. Detta trots en svag tillväxt i USA och i Kina och i eurozonen. Samtidigt producerar Saudiarabien i närheten av det mesta de gjort på 30 år. Balansen i den globala oljemarknaden är stram med begränsad reservkapacitet. Risken kvarstår för produktionsbortfall i mellanöstern och vi går nu in i säsongsmässigt högre konsumtion. Detta borde tala för ett högre oljepris. Och oljepriset hade naturligtvis varit högre om inte EU hade så massiva problem. När vi fick positiva nyheter idag i form av Draghis kommentarer, reagerade oljepriset med att stiga. På nedsidan har vi Saudiarabiens prismål om 100 dollar per fat.
Ytterligare positiva faktorer är, som nämnt i inledningen, möjligheten för en kommande QE3 i USA, att Kinas stimulansåtgärder biter på den reala ekonomin och tillväxten, att jobless claims i USA igår förvånade på den positiva sidan.
Nedan ser vi kursdiagrammet på spotkontraktet på Brent. 90 – 100 dollar tycks Brent vara köpvärt. Samtidigt finns ett kortsiktigt tekniskt motstånd på ca 110 dollar.
 den 26 juli 2012")
Råvarucertifikat får sin avkastning inte endast från stigande priser, utan också på att över tiden tillgodogöra sig rabatter på terminer i förhållande till spot. Vi ser i diagrammet nedan att terminer är billigare än spot på Brent. Genom att över tiden köpa billigt och sälja till spot (dyrt), samlar man på sig vinster. Råvarucertifikat gör just detta genom sin konstruktion. De hämtar sin avkastning från terminskontrakt, som ”rullas” in i längre kontrakt när tiden gjort att det gamla kontraktet är nära förfall. Att köpa t ex OLJA S, ochsitta på det, kan därför ge ganska hög avkastning, även om priset på råolja väntar med att stiga.

Guld
Att priset på guld rört sig sidledes och något nedåt i ett år, har varit en prövning för många guldinvesterare. Tekniska analytiker har också noterat att glidande medelvärden signalerar ”sälj”, som vi ser i diagrammet nedan. Det börjar dra ihop sig för guldpriset att lämna sin sidledes rörelse. Tekniskt stöd finns strax under dagens nivåer. Jag har markerat nivån med en linje som binder ihop bottennoteringarna det senaste året. Vi har också sjunkande motståndsnivåer.
Men vi kan faktiskt se en liten positiv signal. De senaste dagarna har priset brutit ett litet motstånd. Priset i dollar ligger i skrivande stund i 1616 dollar och det är över ett kortsiktigt motstånd. Detta kan vara början på ett mer betydande brott uppåt.

Den som är lite modig kan försöka sig på att köpa ett certifikat med hög hävstång och hög förlustrisk om priset vänder ner. Ett sådant är BULL GULD X4 S. Det ger 4 gångers utväxling på prisuppgångar (och till nackdel om priset istället faller).
Silver
Liksom guld uppvisar silver samma konsolideringsmönster det senaste året. Sin vana trogen är detta mycket häftigare för silver än för guld. Stödet på ca 26 dollar per uns är tydligt i silvermarknaden. Jag har ritat in nivån i diagrammet nedan. Motståndet från toppen under våren 2011 är också tydligt. När marknaden når en sådan här punkt, där priset trängs mellan stöd och motstånd brukar endera köpare eller säljare vinna, vilket då avgör om priset ska upp eller ner. Det återstår att se – och då vara snabb att ta position i LONG eller SHORT SILVER S, vilket det nu än visar sig bli.

Koppar
Prisfallet på koppar har förlorat momentum och tycks bottna ut när nedåttrenden försvagas. Tekniskt finns det stöd strax under dagens nivåer. Det bör finnas potential för högre pris på koppar.

Bara att äga råvarucertifikat på koppar gör att man tjänar pengar, även om priset på koppar står still. Anledningen till detta är att kopparmarknaden är i backwardation, som vi ser i nedanstående diagram. När det är backwardation köper man terminer billigare än spot. Den rabatten blir en vinst över tiden. Koppar är en råvara som konsekvent över tiden ofta för att inte säga, nästan alltid, handlats med rabatt på terminerna. Trots att prisuppgången på t ex guld har varit så stor, har ändå en råvarucertifikatinvestering i koppar gett imponerande avkastning.

I nedanstående diagram ser vi kopparpriset och lagren i antal ton i LME:s lagerhus. Vi ser att lagrene har fallit sedan mitten av 2011. Konsumtionen är alltså större än produktionen. Det är ingen mekanisk sanning, men allt annat lika ”borde” sjunkande lager i vart fall ge stöd åt priset.

Vi rekommenderar köp av koppar, via ett råvarucertifikat utan hävstång och då är KOPPAR S ett sådant som skulle kunna placeras i.
Zink
Zinkpriset ligger på bottennivåer i det prisintervall som etablerats sedan 2009. Produktionskostnaden för zink ligger på dessa nivåer. I råvarumarknaden brukar man kalla detta för råvarans ”fundamentala golv”. Vi ser därför inte några stora kursfallsrisker i zink.

Zinkterminer handlas till skillnad från koppar och råolja i contango, dvs terminer är dyrare än spot. Det innebär att den som placerar i råvarucertifikat förlorar pengar, även om priset står still. Man skulle kunna se det som priset för att kursfallsrisken är begränsad av produktionskostnaden.

Lagren på LME har stigande på zink. Zink används mycket i byggindustrin (i stället för målarfärg på stål). När det är något av fastighetskris i stora delar av Europa är det inte förvånande att zinkmarknaden är under press.

Vi är positiva till zink, men inte lika mycket så som för koppar.
Kaffe
Priset på Arabica, som handlas i New York, har brutit sin nedåtgående trend, efter att ha varit nere på 150 cent per pund. 150 cent var toppnoteringen från slutet av 2009 och var därför för många en naturlig nivå att lägga in köpordrar på.

Det råder contango i terminsmarknaden för arabica-kaffe, som ser i nedanstående diagram.

Vi tycker att man kan börja köpa på sig certifikat på kaffe, på rekyler. Den rekyl vi har haft de senaste dagarna kan t ex vara ett sådant tillfälle. Om man inte önskar ta så hög risk kan råvarucertifikatet KAFFE S vara ett bra val.
Här väljer vi att klippa veckans utgåva SEBs nyhetsbrev Veckans Råvarukommentarer, då återstående innehåll även fanns i gårdagens SEB Jordbruksprodukter.
[box]SEB Veckobrev Veckans råvarukommentar är producerat av SEB Merchant Banking och publiceras i samarbete och med tillstånd på Råvarumarknaden.se[/box]
Disclaimer
The information in this document has been compiled by SEB Merchant Banking, a division within Skandinaviska Enskilda Banken AB (publ) (“SEB”).
Opinions contained in this report represent the bank’s present opinion only and are subject to change without notice. All information contained in this report has been compiled in good faith from sources believed to be reliable. However, no representation or warranty, expressed or implied, is made with respect to the completeness or accuracy of its contents and the information is not to be relied upon as authoritative. Anyone considering taking actions based upon the content of this document is urged to base his or her investment decisions upon such investigations as he or she deems necessary. This document is being provided as information only, and no specific actions are being solicited as a result of it; to the extent permitted by law, no liability whatsoever is accepted for any direct or consequential loss arising from use of this document or its contents.
About SEB
SEB is a public company incorporated in Stockholm, Sweden, with limited liability. It is a participant at major Nordic and other European Regulated Markets and Multilateral Trading Facilities (as well as some non-European equivalent markets) for trading in financial instruments, such as markets operated by NASDAQ OMX, NYSE Euronext, London Stock Exchange, Deutsche Börse, Swiss Exchanges, Turquoise and Chi-X. SEB is authorized and regulated by Finansinspektionen in Sweden; it is authorized and subject to limited regulation by the Financial Services Authority for the conduct of designated investment business in the UK, and is subject to the provisions of relevant regulators in all other jurisdictions where SEB conducts operations. SEB Merchant Banking. All rights reserved.
Analys
OPEC+ will likely unwind 500 kb/d of voluntary quotas in October. But a full unwind of 1.5 mb/d in one go could be in the cards

Down to mid-60ies as Iraq lifts production while Saudi may be tired of voluntary cut frugality. The Brent December contract dropped 1.6% yesterday to USD 66.03/b. This morning it is down another 0.3% to USD 65.8/b. The drop in the price came on the back of the combined news that Iraq has resumed 190 kb/d of production in Kurdistan with exports through Turkey while OPEC+ delegates send signals that the group will unwind the remaining 1.65 mb/d (less the 137 kb/d in October) of voluntary cuts at a pace of 500 kb/d per month pace.

Signals of accelerated unwind and Iraqi increase may be connected. Russia, Kazakhstan and Iraq were main offenders versus the voluntary quotas they had agreed to follow. Russia had a production ’debt’ (cumulative overproduction versus quota) of close to 90 mb in March this year while Kazakhstan had a ’debt’ of about 60 mb and the same for Iraq. This apparently made Saudi Arabia angry this spring. Why should Saudi Arabia hold back if the other voluntary cutters were just freeriding? Thus the sudden rapid unwinding of voluntary cuts. That is at least one angle of explanations for the accelerated unwinding.
If the offenders with production debts then refrained from lifting production as the voluntary cuts were rapidly unwinded, then they could ’pay back’ their ’debts’ as they would under-produce versus the new and steadily higher quotas.
Forget about Kazakhstan. Its production was just too far above the quotas with no hope that the country would hold back production due to cross-ownership of oil assets by international oil companies. But Russia and Iraq should be able to do it.
Iraqi cumulative overproduction versus quotas could reach 85-90 mb in October. Iraq has however steadily continued to overproduce by 3-5 mb per month. In July its new and gradually higher quota came close to equal with a cumulative overproduction of only 0.6 mb that month. In August again however its production had an overshoot of 100 kb/d or 3.1 mb for the month. Its cumulative production debt had then risen to close to 80 mb. We don’t know for September yet. But looking at October we now know that its production will likely average close to 4.5 mb/d due to the revival of 190 kb/d of production in Kurdistan. Its quota however will only be 4.24 mb/d. Its overproduction in October will thus likely be around 250 kb/d above its quota with its production debt rising another 7-8 mb to a total of close to 90 mb.
Again, why should Saudi Arabia be frugal while Iraq is freeriding. Better to get rid of the voluntary quotas as quickly as possible and then start all over with clean sheets.
Unwinding the remaining 1.513 mb/d in one go in October? If OPEC+ unwinds the remaining 1.513 mb/d of voluntary cuts in one big go in October, then Iraq’s quota will be around 4.4 mb/d for October versus its likely production of close to 4.5 mb/d for the coming month..
OPEC+ should thus unwind the remaining 1.513 mb/d (1.65 – 0.137 mb/d) in one go for October in order for the quota of Iraq to be able to keep track with Iraq’s actual production increase.
October 5 will show how it plays out. But a quota unwind of at least 500 kb/d for Oct seems likely. An overall increase of at least 500 kb/d in the voluntary quota for October looks likely. But it could be the whole 1.513 mb/d in one go. If the increase in the quota is ’only’ 500 kb/d then Iraqi cumulative production will still rise by 5.7 mb to a total of 85 mb in October.
Iraqi production debt versus quotas will likely rise by 5.7 mb in October if OPEC+ only lifts the overall quota by 500 kb/d in October. Here assuming historical production debt did not rise in September. That Iraq lifts its production by 190 kb/d in October to 4.47 mb/d (August level + 190 kb/d) and that OPEC+ unwinds 500 kb/d of the remining quotas in October when they decide on this on 5 October.

U.S. commercial crude inventories posted a marginal draw last week, falling by 0.6 million barrels to 414.8 million barrels. Inventories remain 4% below the five-year seasonal average, but the draw is far smaller than last week’s massive 9.3-million-barrel decline. Higher crude imports (+803,000 bl d WoW) and steady refinery runs (93% utilization) helped keep the crude balance relatively neutral.

Yet another drawdown indicates commercial crude inventories continue to trend below the 2015–2022 seasonal norm (~440 million barrels), though at 414.8 million barrels, levels are now almost exactly in line with both the 2023 and 2024 trajectory, suggesting stable YoY conditions (see page 3 attached).
Gasoline inventories dropped by 1.1 million barrels and are now 2% below the five-year average. The decline was broad-based, with both finished gasoline and blending components falling, indicating lower output and resilient end-user demand as we enter the shoulder season post-summer (see page 6 attached).
On the diesel side, distillate inventories declined by 1.7 million barrels, snapping a two-week streak of strong builds. At 125 million barrels, diesel inventories are once again 8% below the five-year average and trending near the low end of the historical range.
In total, commercial petroleum inventories (excl. SPR) slipped by 0.5 million barrels on the week to ish 1,281.5 million barrels. While essentially flat, this ends a two-week streak of meaningful builds, reflecting a return to a slightly tighter situation.
On the demand side, the DOE’s ‘products supplied’ metric (see page 6 attached), a proxy for implied consumption, softened slightly. Total demand for crude oil over the past four weeks averaged 20.5 million barrels per day, up just 0.9% YoY.
Summing up: This week’s report shows a re-tightening in diesel supply and modest draws across the board, while demand growth is beginning to flatten. Inventories remain structurally low, but the tone is less bullish than in recent weeks.


Brent crude rose 1.6% yesterday. After trading in a range of USD 66.1 – 68.09/b it settled at USD 67.63/b. A level which we are well accustomed to see Brent crude flipping around since late August. This morning it is trading 0.5% higher at USD 68/b. The market was expecting an increase of 230 kb/d in Iraqi crude exports from Kurdistan through Turkey to the Cheyhan port but that has so far failed to materialize. This probably helped to drive Brent crude higher yesterday. Indications last evening that US crude oil inventories likely fell 3.8 mb last week (indicative numbers by API) probably also added some strength to Brent crude late in the session. The market continues to await the much heralded global surplus materializing as rising crude and product inventories in OECD countries in general and the US specifically.
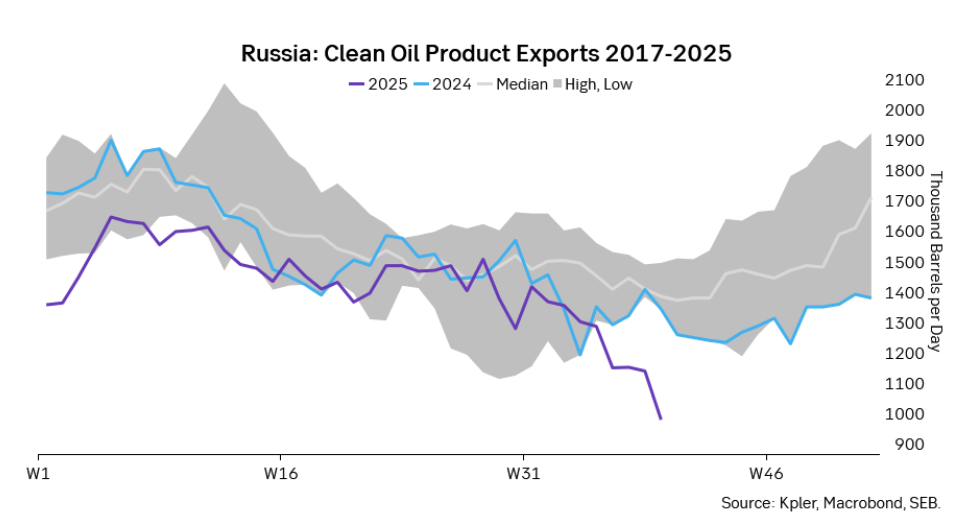
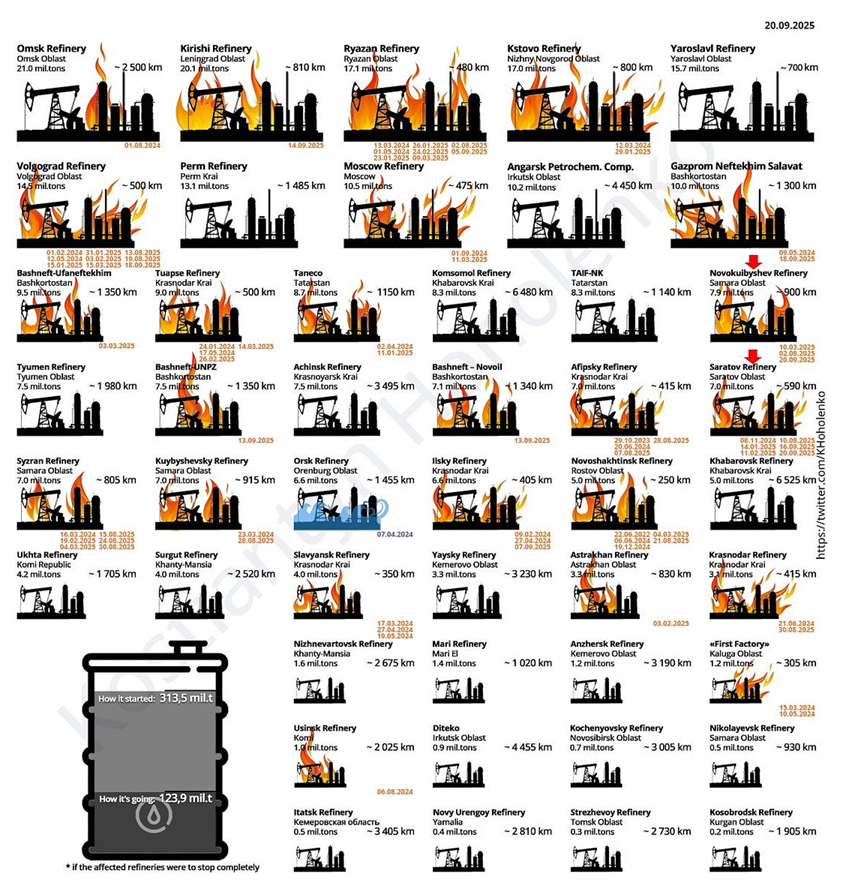
The oil market is starting to focus increasingly on the successful Ukrainian attacks on Russian oil infrastructure. Especially the attacks on Russian refineries. Refineries are highly complex and much harder to repair than simple crude oil facilities like export pipelines, ports and hubs. It can take months and months to repair complex refineries. It is thus mainly Russian oil products which will be hurt by this. First oil product exports will go down, thereafter Russia will have to ration oil product consumption domestically. Russian crude exports may not be hurt as much. Its crude exports could actually go up as its capacity to process crude goes down. SEB’s Emerging Market strategist Erik Meyersson wrote about the Ukrainian campaign this morning: ”Are Ukraine’s attacks on Russian energy infrastructure working?”. Phillips P O’Brian published an interesting not on this as well yesterday: ”An Update On The Ukrainian Campaign Against Russian Refineries”. It is a pay-for article, but it is well worth reading. Amongst other things it highlights the strategic focus of Ukraine towards Russia’s energy infrastructure. A Ukrainian on the matter also put out a visual representation of the attacks on twitter. We have not verified the data representation. It needs to be interpreted with caution in terms of magnitude of impact and current outage.
Complex Russian oil refineries are sitting ducks in the new, modern long-range drone war. Ukraine is building a range of new weapons as well according to O’Brian. The problem with attacks on Russian refineries is thus on the rise. This will likely be an escalating problem for Russia. And oil products around the world may rise versus the crude oil price while the crude oil price itself may not rise all that much due to this.
Russian clean oil product exports as presented by SEB’s Erik Meyersson in his note this morning.
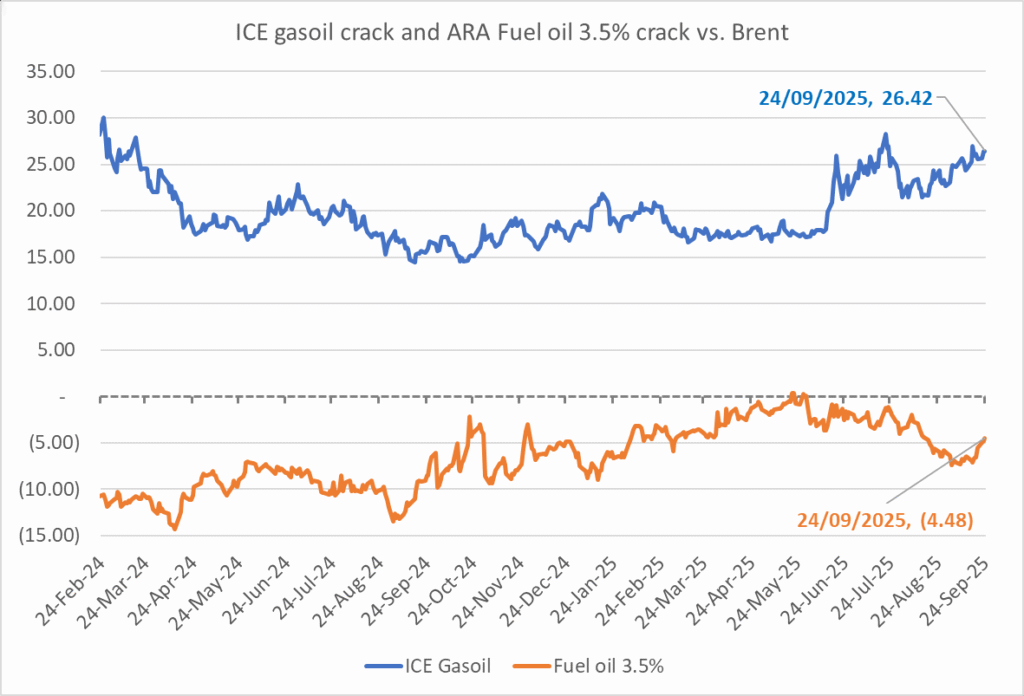
The ICE Gasoil crack and the 3.5% fuel oil crack has been strengthening. The 3.5% crack should have weakened along with rising exports of sour crude from OPEC+, but it hasn’t. Rather it has moved higher instead. The higher cracks could in part be due to the Ukrainian attacks on Russian oil refineries.
Ukrainian inhabitants graphical representation of Ukrainian attacks on Russian oil refineries on Twitter. Highlighting date of attacks, size of refineries and distance from Ukraine. We have not verified the detailed information. And you cannot derive the amount of outage as a consequence of this.

OPEC+ will likely unwind 500 kb/d of voluntary quotas in October. But a full unwind of 1.5 mb/d in one go could be in the cards

Blykalla och amerikanska Oklo inleder ett samarbete

Fortsatt stabilt elpris – men dubbelt så dyrt som i fjol

Ett samtal om guld, olja, koppar och stål

Mixat oktoberväder påverkar elpriset

Eurobattery Minerals satsar på kritiska metaller för Europas självförsörjning

Mahvie Minerals i en guldtrend

Guldpriset kan närma sig 5000 USD om centralbankens oberoende skadas

OPEC signalerar att de inte bryr sig om oljepriset faller kommande månader

Aktier i guldbolag laggar priset på guld
-
 Nyheter4 veckor sedan
Eurobattery Minerals satsar på kritiska metaller för Europas självförsörjning
-
 Nyheter3 veckor sedan
Mahvie Minerals i en guldtrend
-
 Nyheter4 veckor sedan
Guldpriset kan närma sig 5000 USD om centralbankens oberoende skadas
-
 Nyheter4 veckor sedan
OPEC signalerar att de inte bryr sig om oljepriset faller kommande månader
-
 Nyheter3 veckor sedan
Aktier i guldbolag laggar priset på guld
-
Analys3 veckor sedan
Volatile but going nowhere. Brent crude circles USD 66 as market weighs surplus vs risk
-

 Nyheter2 veckor sedan
Kinas elproduktion slog nytt rekord i augusti, vilket även kolkraft gjorde
-
 Nyheter2 veckor sedan
Tyskland har så höga elpriser att företag inte har råd att använda elektricitet