

Analys
SEB – Råvarukommentarer vecka 10 2012

Sammanfattning: Föregående vecka
 Brett råvaruindex: -0,57 %
UBS Bloomberg CMCI TR Index- Energi: -2,33 %
UBS Bloomberg CMCI Energy TR Index - Ädelmetaller: -3,50 %
UBS Bloomberg CMCI Precious Metals TR Index - Industrimetaller: +0,17 %
UBS Bloomberg CMCI Industrial Metals TR Index - Jordbruk: +1,59 %
UBS Bloomberg CMCI Agriculture TR Index
Kortsiktig marknadssyn:
- Guld: Neutral
- Olja: Neutral/köp
- Koppar: Sälj
- Majs: Neutral/sälj
- Vete: Neutral/sälj
Guld
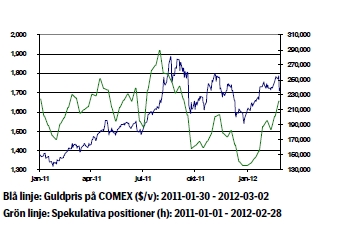
- Guldet föll 4,3 procent under onsdagen, detta efter att Ben Bernanke i Fedskonjunkturrapport bekräftade mer positiva signaler inom tillverkningsindustrin,hushållens konsumtion, bostads-/byggsektorn samt arbetsmarknaden. Förbättringarna är visserligen små, men visar ändå tecken på att USA:s ekonomi fortsätter att förbättras. Eftersom Bernanke inte nämnde något om fortsatta kvantitativa lättnader i sitt tal föll priset på guld som tillfälligtvis handlade under 1700 dollar/ozt. Dollarn stärktes efter Bernankes tal, vilket spädde på fallet ytterligare.
- Enligt Bloomberg ökade under förra veckan inflödet i börshandlade produkter med fysiskt guld som underliggande och uppnådde ett rekordhögt 2404 ton.
- Marknaden reagerade inte nämnvärt på ECBs 3-åriga repa där banker mot säkerheter får låna ett obegränsat belopp till en procents ränta. Denna ökning av likviditet hade marknaden redan prisat in och guldpriset påverkades inte heller av denna åtgärd.
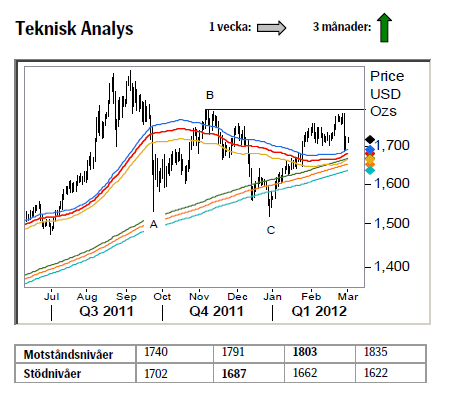
- Teknisk Analys: Marknaden nådde nästan ända upp till huvudmotståndet, 1803, innan en lite starkare vinsthemtagning slog till. Givet styrkan i nedgången är det troligt att det nu tar någon/några veckor innan marknaden samlat kraft och mod nog för ett nytt försök. Kommande veckan bör säljarna återfinnas runt 1740, dvs. mitten av onsdagens nedgång och om vi stiger över denna punkt så pekar det mesta på en redan avslutad korrektion och följaktligen ett nytt test högre.
Kortsiktig marknadssyn: Neutral
Olja
- För att kompensera för läget i Iran ökar nu de övriga OPEC-länderna sin oljeproduktion.
- Även Ryssland ökar produktionen som nu uppgår till 10,36 miljoner fat per dag, de högsta nivåerna sedan Sovjetunionens kollaps.
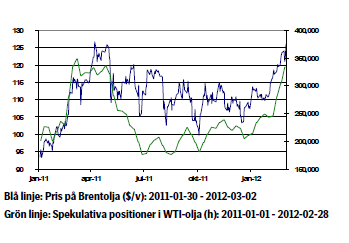
- I torsdags steg Brentpriset till 128,4 USD/fat efter rykten, som spreds genom Iransk media, om att en oljeledning i Saudiarabien exploderat. Landet dementerade ryktet och oljan föll tillbaka något på fredagen.
- Oljelagernivåerna i industrialiserade länder är på de lägsta nivåerna på fyra år och inom Europa på de lägsta nivåerna på 15 år. Det finns inga tillförlitliga siffror på hur stor reservkapaciteten är, men en sommar med ökad konsumtion på grund av luftkonditionering och utebliven Iransk export skulle kunna öka riskpremien i oljemarknaden ytterligare.
- Konflikterna mellan Sudan och Sydsudan fortsätter: Sudan har krävt att Sydsudan betalar motsvarande 30 dollar per fat olja i transitavgift för raffinering och användning av landets oljeledningar. Sydsudan har meddelat att man som mest är beredd att betala motsvarande 1 dollar per fat olja, detta med hänvisning till att regeringen redan betalar avgifter till bolagen som äger infrastrukturen.
- I Syrien, som är en nära allierad till Iran, fortsätter inbördeskriget. Syrien är ingen stor oljeproducent, men oroligheterna i MENA-regionen ökar även den riskpremien i oljepriset
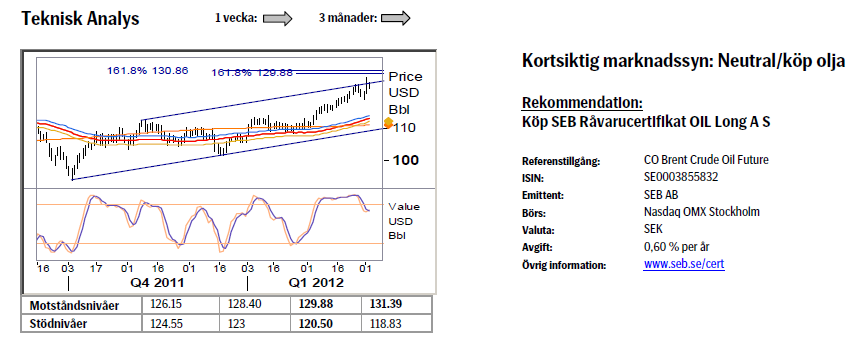
- Teknisk Analys: Gårdagens spik ovanför parallellkanalen ska nog ses som det första tecknet på att köparna börjar bli mättade. Även faktumet att stochastic uppvisar en potentiell negativ divergens (högre topp i pris, lägre topp i indikator) indikerar att vi nu närmar oss åtminstone en temporär topp. Tills denna är bekräftad (under 120.50) så kvarstår en öppning för att nå nästa Fibonacci nivå, 130/131.
Koppar
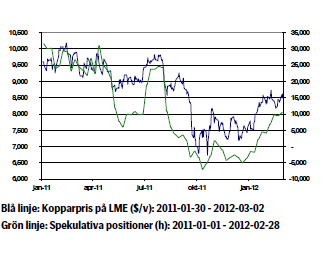
- Världsbankens chef Robert Zoellick tror Kina sannolikt kommer att få se en ”mjuklandning” av sin tillväxt i år.
- Det officiella kinesiska PMI-indexet som publicerades förra veckan visade en uppgång till 51,0 i februari, en uppgång från 50,5 månaden före. HSBC:s inköpschefsindex för tillverkningsindustrin stannade dock under den viktiga 50- nivån, trots en ökning från 48,8 till 49,6.
- Produktionen vid Grasberggruvan i Indonesien ligger fortfarande nere på grund av strejk om arbetsförhållanden, men arbetet bör återupptas denna vecka. Grasberg i Indonesien är världens största guldgruva och den tredje största koppargruvan.
- Enligt handlare i marknaden har kopparlagren i Shanghai ökat till 400 000 ton förra veckan, vilket kan jämföras med 350 000 ton föregående vecka. Låg inhemsk efterfrågan och låga inhemska priser har lett till att importörer valt att tillfälligt lagra metallen.
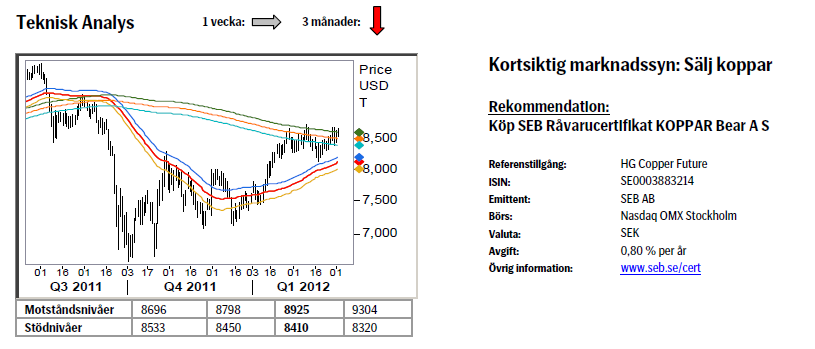
- Teknisk Analys: Vår huvudsakliga vy är fortfarande att markanden bör vända nedåt i eller runt 233dagars bandet. Så länge inte 8765 (alternativt 8925) inte bryts bör fokus ligga på att söka en säljsignal.
Majs
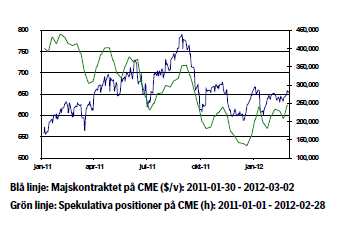
- Efter ökad oro för utbudet av majs och sojabönor kunde vi i tisdags se hur priserna gick upp till de högsta nivåerna sedan början av året. Framförallt torkan i Sydamerika har skapat oro i marknaden.
- Under slutet av förra veckan strejkade hamnarbetarna i ett flertal av de argentinska spannmålshamnarna. Då landet är en av världens största majs- och sojabönsexportör kan detta eventuellt ge ytterligare stöd uppåt i det korta perspektivet.
- I torsdags meddelade USDA att de bedömer att Kinas grisuppfödning kommer att öka med drygt 4 procent under 2012. Då den huvudsakliga delen av majsproduktionen går till djuruppfödning kan denna typ av uttalanden ge tillfälligt stöd åt priset.
- De spekulativa köparna kommer tillbaka i allt större utsträckning, där vi nu är på de högsta nivåerna under hela 2012.
- På fredag kommer det amerikanska jordbruksdepartementet ut med årets tredje WASDE-rapport. Vi förhåller oss svagt negativa till majspriset inför denna publikation.
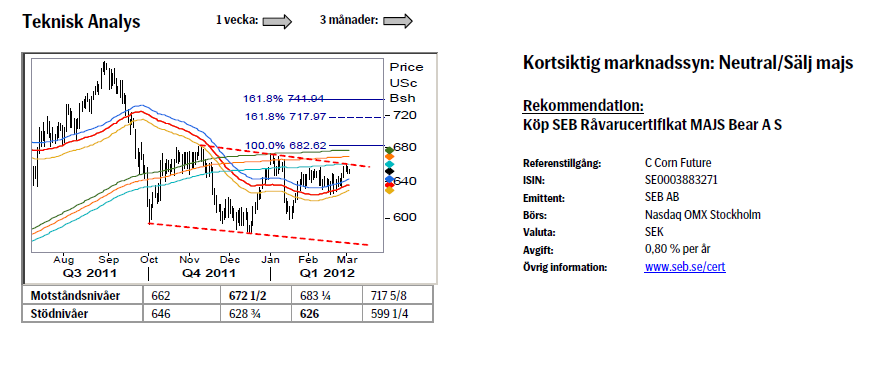
- Teknisk Analys: Marknaden har sedan sist byggt lite positivare momentum vilket föranleder lite noggrannare bevakning av motstånden då det ju fortfarande förhåller sig så att om ett brott över trend linjen (och kanske ännu viktigare januari toppen 672 ½) sker bör vi kunna måla in en fortsatt uppgång till 717/741 området.
Vete
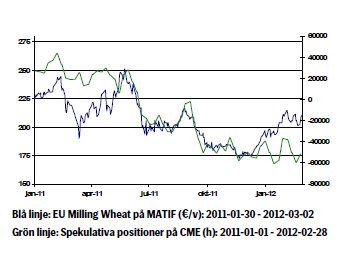
- Vetepriset gick starkt i Paris under hela förra veckan, bland annat baserat på rapporter om svagare veteskörd i Europa, detta som en konsekvens av den ovanligt svåra kylan under början av året.
- Det skrivs för tillfället mycket om de amerikanska bönderna och vad de förväntas så under 2012. Efter att sojabönspriset har gått väsentligen starkare än både majs och vete de senaste veckorna spekuleras det nu kring huruvida en stor del av bönderna i USA kommer att så detta istället för vete de kommande månaderna.
- Enligt U.S. Wheat Associates talar mycket för att vi på kort tid bör kunna se priserna mellan det relativt sett starka europeiska och det i jämförelse svaga amerikanska vetet gå ihop. Efterfrågan på amerikanskt vete bör öka i det korta perspektivet till stor del på grund av en försvagad dollar, låga fraktpriser samt förhållandevis goda utbudssiffror relativt Europa.
- I torsdags kom nyheten om att Iran har börjat köpa amerikanskt vete, vilket stärker tesen ytterligare om att prisnivån i nuläget ser intressant ut ur ett globalt perspektiv.
- De spekulativa köparna av vete fortsätter att lysa med sin frånvaro. Trots att priset gått förhållandevis starkt under 2012 väljer många investerare att undervikta vete, vilket känns rimligt då utbudet av vete i nuläget fortsatt får anses vara omfattande. Vi tycker att man ska vara försiktig med att ta några positioner före WASDE-rapporten på fredag. Men vill man spekulera är vår uppfattning att risken är störst på nedsidan.
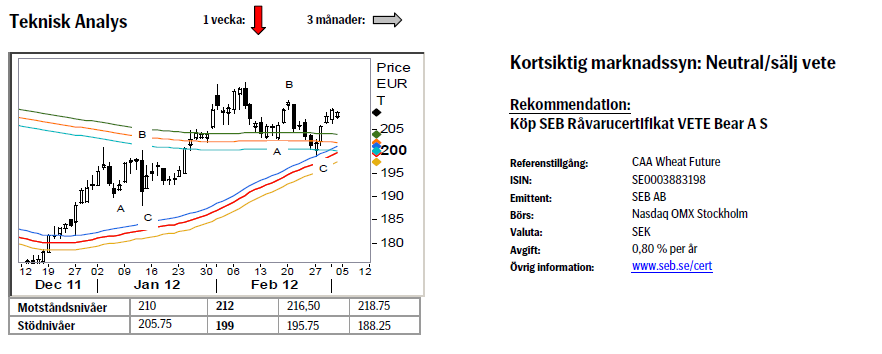
- Teknisk Analys: Studsen från 55dagars bandet kan mycket väl ha avslutat korrektionen. Följer vi tidigare A-B-C mönster borde nästa steg kunna vara ett brott över B-vågens topp, 212, något som i sådan fall skulle indikera ytterligare uppgång emot 245.
[box]SEB Veckobrev Veckans råvarukommentar är producerat av SEB Merchant Banking och publiceras i samarbete och med tillstånd på Råvarumarknaden.se[/box]
Disclaimer
The information in this document has been compiled by SEB Merchant Banking, a division within Skandinaviska Enskilda Banken AB (publ) (“SEB”).
Opinions contained in this report represent the bank’s present opinion only and are subject to change without notice. All information contained in this report has been compiled in good faith from sources believed to be reliable. However, no representation or warranty, expressed or implied, is made with respect to the completeness or accuracy of its contents and the information is not to be relied upon as authoritative. Anyone considering taking actions based upon the content of this document is urged to base his or her investment decisions upon such investigations as he or she deems necessary. This document is being provided as information only, and no specific actions are being solicited as a result of it; to the extent permitted by law, no liability whatsoever is accepted for any direct or consequential loss arising from use of this document or its contents.
About SEB
SEB is a public company incorporated in Stockholm, Sweden, with limited liability. It is a participant at major Nordic and other European Regulated Markets and Multilateral Trading Facilities (as well as some non-European equivalent markets) for trading in financial instruments, such as markets operated by NASDAQ OMX, NYSE Euronext, London Stock Exchange, Deutsche Börse, Swiss Exchanges, Turquoise and Chi-X. SEB is authorized and regulated by Finansinspektionen in Sweden; it is authorized and subject to limited regulation by the Financial Services Authority for the conduct of designated investment business in the UK, and is subject to the provisions of relevant regulators in all other jurisdictions where SEB conducts operations. SEB Merchant Banking. All rights reserved.

Wild moves yesterday. Brent crude traded to a high of $114.43/b and a low of $96.0/b and closed at $99.94/b yesterday.

US – Iran negotiations ongoing or not? What a day. Donald Trump announced that good talks were ongoing between Iran and the US and that the 48 hour deadline before bombing Iranian power plants and energy infrastructure was postponed by five days subject to success of ongoing meetings. Iranian media meanwhile stated that no meetings were ongoing at all.
Today we are scratching our heads trying to figure out what yesterday was all about.
Friends and family playing the market? Was it just Trump and his friends and family who were playing with oil and equity markets with $580m and $1.46bn in bets being placed by someone in oil and equity markets just 15 minutes before Trump’s announcement?
Was Trump pulling a TACO as he reached his political and economic pain point: Brent at $112/b, US Gas at $4/gal, SPX below 200dma and US 10yr above 4.4%?
Different Iranian factions with Trump talking with one of them? Are there real negotiations going on but with the US talking to one faction in Iran while another, the hardliners, are not involved and are denying any such negotiations going on?
Extending the ultimatum to attack and invade Kharg island next weekend? Or, is the five day delay of the deadline a tactical decision to allow US amphibious assault ships and marines to arrive in the Gulf in the upcoming weekend while US and Israeli continues to degrade Iranian military targets till then. And then next weekend a move by the US/Israel to attack and conquer for example the Kharg island?
We do not really know which it is or maybe a combination of these.
We did get some kind of TACO ydy. But markets have been waiting for some kind of TACO to happen and yesterday we got some kind of TACO. And Brent crude is now trading at $101.5/b as a result rather than at $112-114/b as it did no the high yesterday.
But what really matters in our view is the political situation on the ground in Iran. Will hardliners continue to hold power or will a more pragmatic faction gain power?
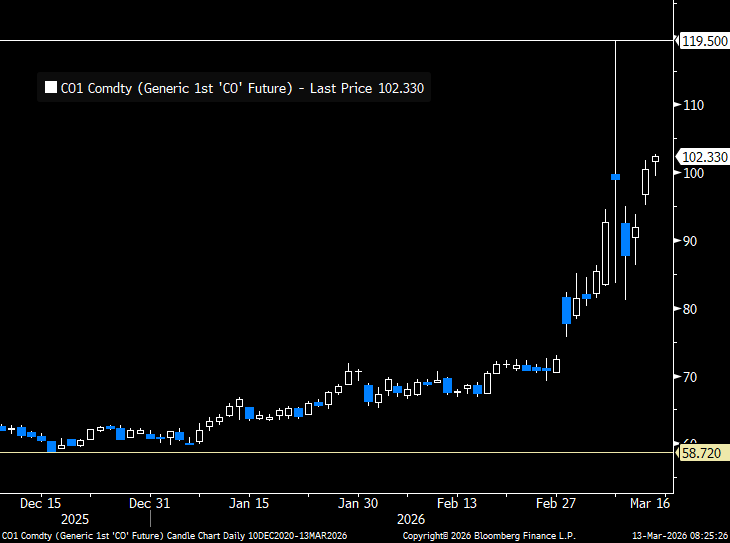
If the hardliners remain in power then oil pain should extend all the way to US midterm elections. The hardliners were apparently still in charge as of last week. Iran immediately retaliated and damaged LNG infrastructure in Qatar after Israel hit Iranian South Pars. The SoH was still closed and all messages coming out of Iran indicated defiance. Hardliners continues in power has a huge consequence for oil prices going forward. The regime has played its ’oil-weapon’ (closing or chocking the Strait of Hormuz). It is using it to achieve political goals. Deterrence: it needs to be so politically and economically expensive to attack Iran that it won’t happen again in the future. Or at least that the US/Israel thinks 10-times over before they attack again. The highest Brent crude oil closing price since the start of the war is $112.19/b last Friday. In comparison the 20-year inflation adjusted Brent price is $103/b. So Brent crude last Friday at $112.19/b isn’t a shockingly high price. And it is still far below the nominal high of $148/b from 2008 which is $220/b if inflation adjusted. So once in a lifetime Iran activates its most powerful weapon. The oil weapon. It needs to show the power of this weapon and it needs to reap political gains. Getting Brent to $112/b and intraday high of $119.5/b (9 March) isn’t a display of the power of that weapon. And it is not a deterrence against future attacks.
So if the hardliners remain in power in Iran, then the SoH will likely remain chocked all the way to US midterm elections and Brent crude will at a minimum go above the historical nominal high of $148/b from 2008.
Thus the outlook for the oil price for the rest of the year doesn’t depend all that much of whether Trump pulls a TACO or not. Stops bombing or not. It depends more on who is in charge in Iran. If it is the hardliners, then deterrence against future attacks via chocking of the SoH and high oil prices is the likely line of action. It is impacting the world but the Iranian ’oil-weapon’ is directed towards the US president and the the US midterm elections.
If a pragmatic faction gets to power in Iran, then a very prosperous future is possible. However, if power is shifting towards a more pragmatic faction in Iran then a completely different direction could evolve. Such a faction could possibly be open for cooperation with the US and the GCC and possibly put its issues versus Israel aside. Then the prosperity we have seen evolving in Dubai could be a possible future also for Iran.
So far it looks like the hardliners are fully in charge. As far as we can see, the hardliners are still fully in control in Iran. That points towards continued chocking of the SoH and oil prices ticking higher as global inventories (the oil market buffers) are drawn lower. And not just for a few more weeks, but possibly all the way to the US midterm elections.
A brief sigh of relief yesterday as oil infra at Kharg wasn’t damaged. But higher today. Brent crude dabbled around a bit yesterday in relief that oil infrastructure at Iran’s Kharg island wasn’t damaged. It traded briefly below the 100-line and in a range of $99.54 – 106.5/b. Its close was near the low at $100.21/b.
No easy victorious way out for Trump. So no end in sight yet. Brent is up 3.2% today to $103.4/b with no signs that the war will end anytime soon. Trump has no easy way to declare victory and mission accomplished as long as Iran is in full control of the Strait of Hormuz while also holding some 440 kg of uranium enriched to 60% and not far from weapons grade at 90%. As long as these two factors are unresolved it is difficult for Trump to pull out of the Middle East. Naturally he gets increasingly frustrated over the situation as the oil price and US retail gas prices keeps ticking higher while the US is tied into the mess in the Middle East. Trying to drag NATO members into his mess but not much luck there.
When commodity prices spike they spike 2x, 3x, 4x or 5x. Supply and demand for commodities are notoriously inflexible. When either of them shifts sharply, the the price can easily go to zero (April 2022) or multiply 2x, 3x, or even 5x of normal. Examples in case cobalt in 2025 where Kongo restricted supply and the price doubled. Global LNG in 2022 where the price went 5x normal for the full year average. Demand for tungsten in ammunition is up strongly along with full war in the middle east. And its price? Up 537%.
Why hasn’t the Brent crude oil price gone 2x, 3x, 4x or 5x versus its normal of $68/b given close to full stop in the flow of oil of the Strait of Hormuz? We are after all talking about close to 20% of global supply being disrupted. The reason is the buffers. It is fairly easy to store oil. Commercial operators only hold stocks for logistical variations. It is a lot of oil in commercial stocks, but that is predominantly because the whole oil system is so huge. In addition we have Strategic Petroleum Reserves (SPRs) of close to 2500 mb of crude and 1000 mb of oil products. The IEA last week decided to release 400 mb from global SPR. Equal to 20 days of full closure of the Strait of Hormuz. Thus oil in commercial stocks on land, commercial oil in transit at sea and release of oil from SPRs is currently buffering the situation.
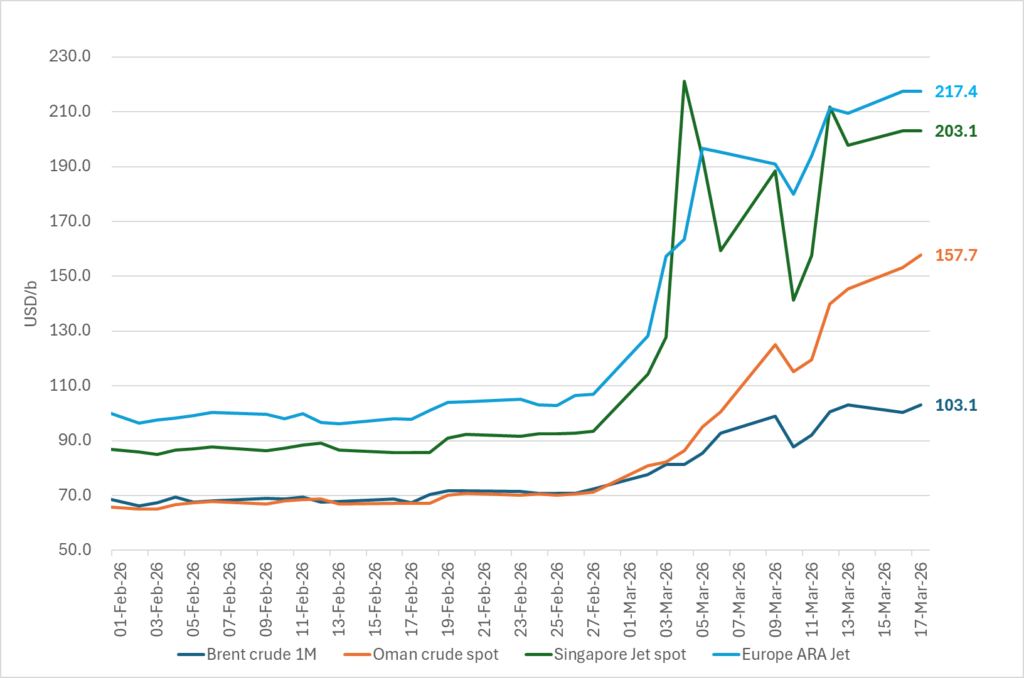
But we are running the buffers down day by day. As a result we see gradually increasing stress here and there in the global oil market. Asia is feeling the pinch the most. It has very low self sufficiency of oil and most of the exports from the Gulf normally head to Asia. Availability of propane and butane many places in India (LPG) has dried up very quickly. Local prices have tripled as a result. Local availability of crude, bunker oil, fuel oil, jet fuel, naphtha and other oil products is quickly running down to critical levels many places in Asia with prices shooting up. Oman crude oil is marked at $153/b. Jet fuel in Singapore is marked at $191/b.
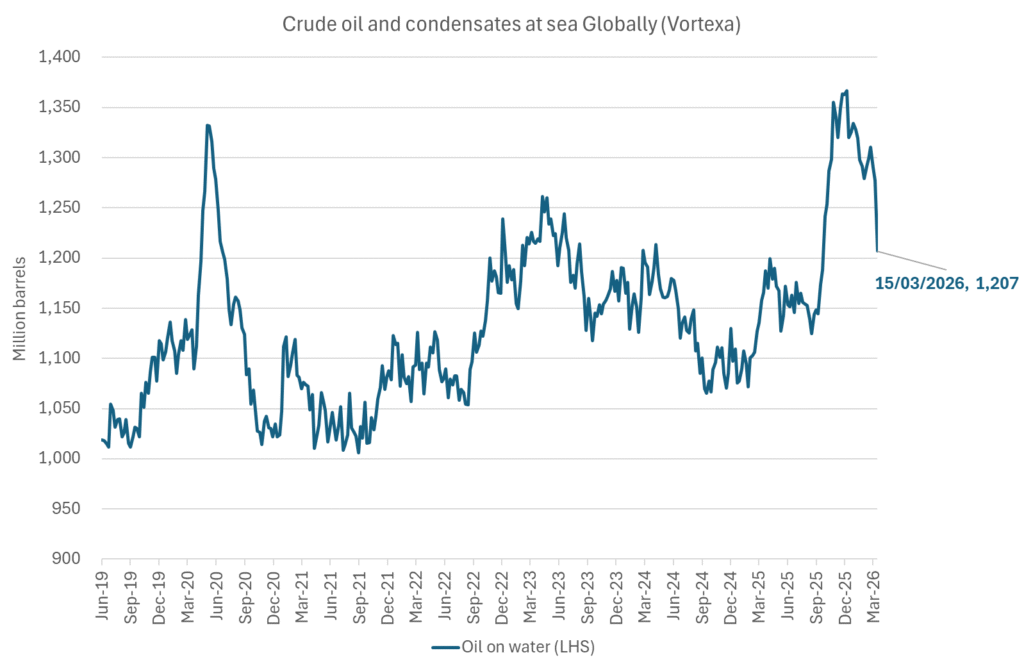
Oil at sea originating from Strait of Hormuz from before 28 Feb is rapidly emptied. Oil at sea is a large pool of commercial oil. An inventory of oil in constant move. If we assume that the average journey from the Persian Gulf to its destinations has a volume weighted average of 13.5 days then the amount of oil at sea originating from the Persian Gulf when the the US/Israel attacked on 28 Feb was 13.5 days * 20 mb/d = 269 mb. Since the strait closed, this oil has increasingly been delivered at its destinations. Those closest to the Strait, like Pakistan, felt the emptying of this supply chain the fastest. Propane prices shooting to 3x normal there already last week and restaurants serving cold food this week is a result of that. Some 50-60% of Asia’s imports of Naphtha normally originates from the Persian Gulf. So naphtha is a natural pain point for Asia. The Gulf also a large and important exporter of Jet fuel. That shut in has lifted jet prices above $200/b.
To simplify our calculations we assume that no oil has left the Strait since that date and that there is no increase in Saudi exports from Yanbu. Then the draining of this inventory at sea originated from the Persian Gulf will essentially look like this:
The supply chain of oil at sea originating from the Strait of Hormuz is soon empty. Except for oil allowed through the Strait of Hormuz by Iran and increased exports from Yanbu in the Red Sea. Not included here.
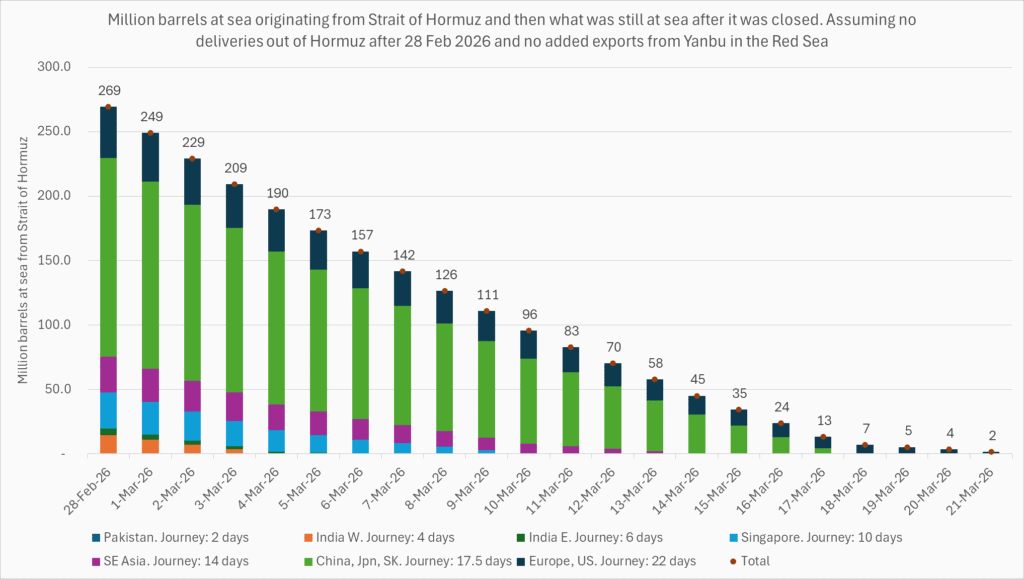
Oil at sea is falling fast as oil is delivered without any new refill in the Persian Gulf. Waivers for Russian crude is also shifting Russian crude to consumers. Brent crude will likely start to feel the pinch much more forcefully when oil at sea is drawn down another 200 mb to around 1000 mb. That is not much more than 10 days from here.
Oil and oil products are starting to become very pricy many places. Brent crude has still been shielded from spiking like the others.
Closing at highest since Aug 2022. Brent crude gained 9.2% yesterday. The trading range was limited to $95.2 – 101.85/b with a close at $100.46/b and higher than the Monday close of $98.96/b. Ydy close was the highest close since August 2022. This morning Brent is up 2% to $102.4/b and is trading at the highest intraday level since Monday when it high an intraday high of $119.5/b.
A military hit at Iran’s Kharg island would be a big, big bang for the oil price. The big, big risk for the weekend is that oil infrastructure could be damaged. For example Iran’s Kharg island which is Iran’s major oil export hub. If damaged we would have a longer lasting loss of supply stretching way beyond Trump’s announced ”two more weeks”. It will make the spot price spike higher and it will lift the curve. Brent crude 2027 swap would jump above $80/b immediately. An attack on Kharg island would naturally lead Iran to strike back at other oil infrastructures in the Gulf. Especially those belonging to countries who harbor US military bases. I.e. countries who essentially are supporting the attack by US and Israel towards Iran. Though if not in spirit, then in practical operational terms. An attack on Kharg island would not just lead to a lasting outage of supply from Iran until it would be repaired. It would immediately endanger other oil infrastructure in the region as well and additional lasting loss of supply.
No one in their right mind would dare to sit short oil over the coming weekend. Oil is thus set to close the week at a very strong note today.
Prepare for another 400 mb SPR release next week. This week’s announcement of a 400 mb release from Strategic Oil Reserves totally underwhelmed the market with the oil price going higher rather than lower following the announcement. For one it means that the market expects the war and the closure of the Strait of Hormuz to last longer than Trump’s recent announced ”two more weeks”. 400 mb only amounts to 20 days of lost supply to the world through Hormuz and we are already at day 14. So next week when we are getting close to the 20 day mark, we are likely to see another announcement of another 400 mb release of SPR stocks to the market. Preparing for the next 20 days of war.
Global oil logistics in total disarray. We have previously addressed the issue of the huge logistical web of the global oil market which is now in total disarray. The logistical disruption started to fry the oil market at the end of last week. Helped to spike the oil market on Monday. What we hear from our shipping clients is that the problems with supply of fuels locally in Korea, Singapore, India and Africa are getting worse with physical availability of fuels there drying up. It is getting increasingly difficult to find physical supply of bunker oil with local, physical prices shooting way higher than financial benchmarks. To the point that biofuels have become the cheap option many places. Availability of fuels in the US is still good. Not so surprising as the US is self-sufficient with crude and refineries.
The disruption in global oil logistics doesn’t seem to improve. Rather the opposite. If you cannot get fuel to run your ships, then how can you distribute fuels to where it is needed.
Buy Brent Dec-2026 calls with strike $150/b!! As the days goes by the oil price is ticking higher while Trump is getting one day closer to US midterm elections. Trump was betting that he could put this war to bead well before November. But that will probably not be up to him to decide. It will be up to Iran to decide when to reopen the Strait of Hormuz. It is very hard to imagine that Iran will let Trump easily off the hock after he has killed its Supreme Leader. This will likely go all the way to November. Buy Brent Dec-2026 calls with strike $150/b!!
Brent closed at highest since 2022 ydy. Will end this Friday at a very strong note! Consumers still dreaming of $60/b oil



Christian Kopfer om läget för oljan

Marknaden måste börja betrakta de höga kopparpriserna som det nya normala

Det fysiska spotpriset på brentolja har slagit nytt rekord

40 minuter med Javier Blas om hur världen verkligen påverkas av energikrisen

Efter tillväxten: Guldbrev satsar på expansion i Europa

Elpriserna fördubblas, stor osäkerhet inför sommaren
40 minuter med Javier Blas om hur världen verkligen påverkas av energikrisen

MP Materials, USA:s svar på Kinas dominans över sällsynta jordartsmetaller
Det fysiska spotpriset på brentolja har slagit nytt rekord

Studsvik har idag ansökt om att få bygga 1200-1600 MW kärnkraft i Valdemarsvik
-
 Nyheter3 veckor sedan
Elpriserna fördubblas, stor osäkerhet inför sommaren
-
 Nyheter2 veckor sedan
40 minuter med Javier Blas om hur världen verkligen påverkas av energikrisen
-
 Nyheter4 veckor sedan
MP Materials, USA:s svar på Kinas dominans över sällsynta jordartsmetaller
-
 Nyheter2 veckor sedan
Det fysiska spotpriset på brentolja har slagit nytt rekord
-
 Nyheter4 veckor sedan
Studsvik har idag ansökt om att få bygga 1200-1600 MW kärnkraft i Valdemarsvik
-
 Nyheter2 veckor sedan
Marknaden måste börja betrakta de höga kopparpriserna som det nya normala
-

 Nyheter4 veckor sedan
Matproduktion är beroende av gödsel, Gulfkriget skapar brist
-
Analys4 veckor sedan
TACO (or Whatever It Was) Sends Oil Lower — Iran Keeps Choking Hormuz