

Analys
SEB – Råvarukommentarer, 8 september 2014

Rekommendationer
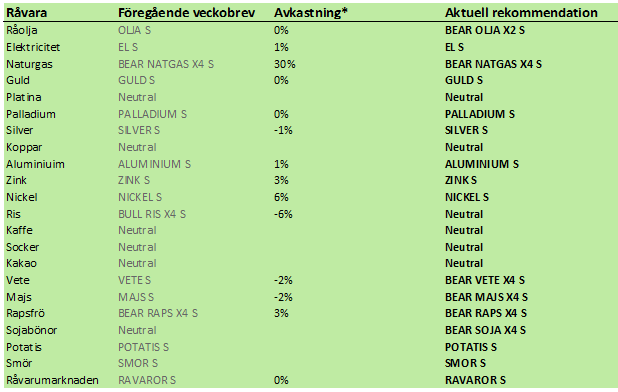
Kort sammanfattning
ECB sänkte sina tre viktigaste styrräntor i veckan, där två är nästan noll och en av dem är ännu mer negativ. Vi tror inte att detta kommer att göra varken till eller från, och väntar oss att QE är nästa steg. ECB chefen Mario Draghi sade också att QE kan bli aktuellt.
Veckan präglades också av en antydan till vapenvila mellan Ryssland och Ukraina, som dock verkade innebära en seger för de territoriella vinster Ryssland gjort. Denna vapenvila bröts av Ryssland under lördagen. En estnisk polis kidnappades av ryska säkerhetstjänsten inne på Estnisk sida av gränsen i fredags. Polisen visades under lördagen upp i en bur i Moskva. Efter att det varit viss tvekan under veckan, är det nu rätt säkert att EU/USA kommer att införa nya sanktioner mot Ryssland. Det innebär att konflikten mellan EU/USA och Ryssland trappas upp ytterligare. Det innebär också att tillväxten och efterfrågan framförallt på råvaror minskar.
På torsdag, den 11 september, publicerar både USDA och FAO/AMIS sina rapporter för september. De kommer förmodligen att innebära höjningar av majs- och sojaproduktionen i USA och av spannmålsproduktionen i Ryssland. Konsumtionen kommer antagligen inte att höjas lika mycket, eftersom geopolitisk oro och redan drabbade producenter av gris och mjölk håller tillbaka konsumtionen. Därför kommer antagligen utgående lager att justeras upp märkbart, med prisfall som följd.
Fonterra-auktionen i veckan visade på nya relativt stora prisfall på alla produkter. Det fick terminerna på EUREX avseende smör och SMP att återta den fallande pristrenden.
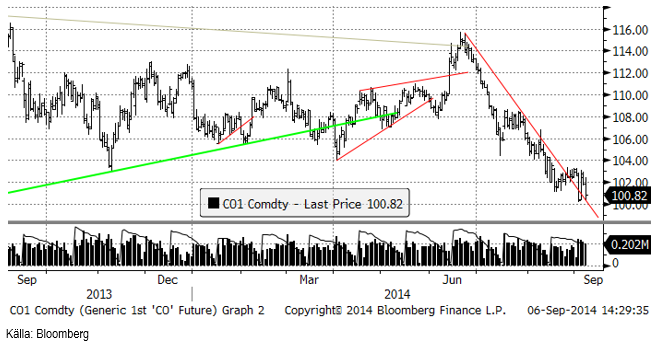
Råolja – Brent
Det finns argument för att priset ska gå ner och det finns också argument för att det ska gå upp. Å ena sidan är det extremt oroligt i Mellanöstern och i Nordafrika. Å den andra sidan råder faktiskt ett produktionsöverskott i råoljemarknaden. Till viss del beror det på att det finns så mycket orosmoment. Det sista Saudiarabien vill se är ett oljepris som sticker iväg till 150-200 dollar eftersom detta skulle underminera olja som en långsiktig och stabil energikälla. Det skulle också vara negativt för den globala ekonomin. Sådeles tror vi att Saudiarabien har valt att hålla sin produktion på en hög nivå och skapa en slags buffert i marknaden för det fall situationen i Irak skulle eskalera och därmed skada exporten av olja från Basra i södra Irak (~2.5 mbpd). Det finns inget som hindrar Saudiarabien att minska produktionen givet att de nu producerar nära sin historiska max-produktion på 10 mbdp. Den nuvarande överproduktionen från OPEC är således till viss del medveten.
Det finns inga tecken på att riskerna för en förvärring av läget i Irak skulle minska. På utbudssidan har vi sett att Libyen äntligen har kommit tillbaka i marknaden med en ökning från bara 200,000 fat per dag till 750,000 fat. De har en kapacitet på 1.5 mbpd.
Situationen är emellertid knappast lugn i landet. Oljeproduktionen ökar samtidigt som våldsamheterna också ökar. Den lagligt valda regeringen och statsministern har fått rymma från Tripoli och istället sökt sin tillflykt i den östra delen av Libyen, i staden Al-Bayda. Tripoli har blivit övertaget av militanta islamister. Ökningen av oljeproduktionen i Libyen måste således anses vara rätt otillförlitlig. Upproren i östra delen av landet har stängt av exporten av olja därifrån i ett helt år. Nu har dessa rebeller emellertid allierat sig med regeringen i östliga Al-Bayda och samarbetar med dem om oljeexporten istället. Således finns anledning att tro att exporten från den östra delen av landet kommer att kunna fortsätta, tills vidare. Men risken finns, med tanke på att det nu råder en tydlig konflikt mellan östra och västra Libyen.
Inför kommande vecka räknar vi med att konflikten mellan Ryssland och Ukraina näppeligen blir löst. Det finns en överhängande risk för ytterligare sanktioner mot Ryssland från USA/EU. Detta skulle vara negativt för den ekonomiska tillväxten både i Ryssland och i EU och således ha en negativ effekt på efterfrågan på olja och därmed på oljepriset. Det amerikanska dollarn kommer antagligen att stärkas, vilket betyder att oljepriset uttryckt i dollar går ner, dessutom.
En hög andel av raffinaderierna på norra halvklotet ställer nu om från sommarproduktion till vinterproduktion, och då går de off-line under tiden. Det innebär att efterfrågan på råolja minskar på spotmarknaden i en eller två månader. Saudiarabien håller oljeproduktionen högre än nödvändigt för att ligga före ifall det värsta skulle hända i Irak (att konflikten i Irak leder till ett stopp på Iraks export från Basra på 2.5 mbpd). Det finns således en hel del faktorer som talar för att priset på råolja kommer att sega sig vidare nedåt lite till. Risken finns dock att det värsta händer i Irak och att det blir ett motsvarande hopp uppåt i oljepriset.
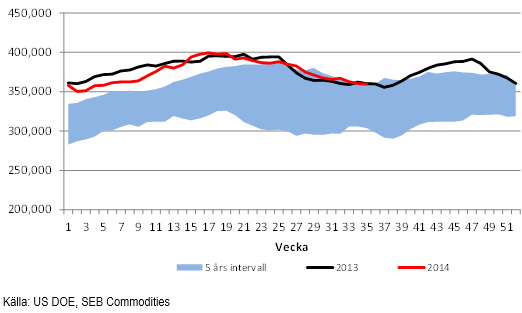
Råoljelagren i USA sjönk 1 mbbl till 359.6 mbbl.
Importen av olja ökade marginellt.
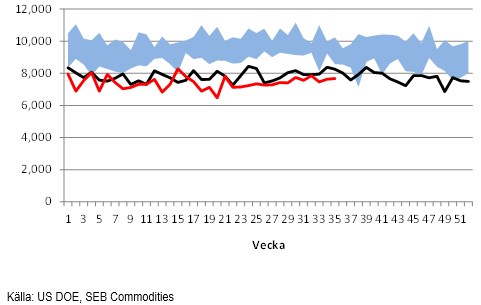
Nedan ser vi ett diagram på antalet oljeriggar i USA, enligt Baker Hughes statistik (svart) och USA:s oljeproduktion enligt US DOE på 8.357 mbpd. Antalet borr-riggar steg i veckan från 1914 till 1925.

Vi rekommenderar alltså på kort sikt en försiktig kortposition t ex med BEAR OLJA X2 S.
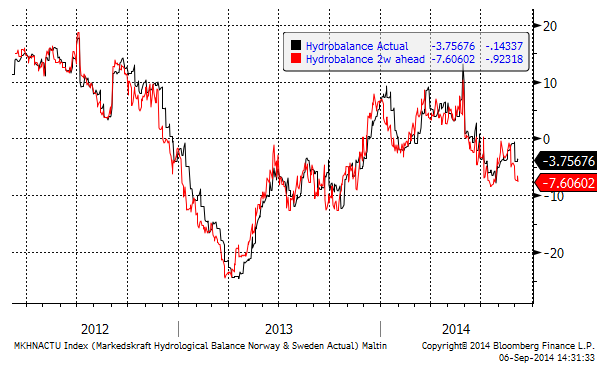
Elektricitet
Väderleksprognosen säger att nederbörden bli 55% lägre än normalt. Hydrologisk balans ligger på ca -5 TWh och den kan sjunka ännu mer in i underskott. Gasmarknaden i Europa har varit stark, pga oro för Rysslands export. Gasen ger stöd, men har inte drivit priset på el.
Marknaden handlar nu lite sidledes, men vi tror det är större sannolikhet för en fortsatt prisuppgång, än att priset ska gå ner.
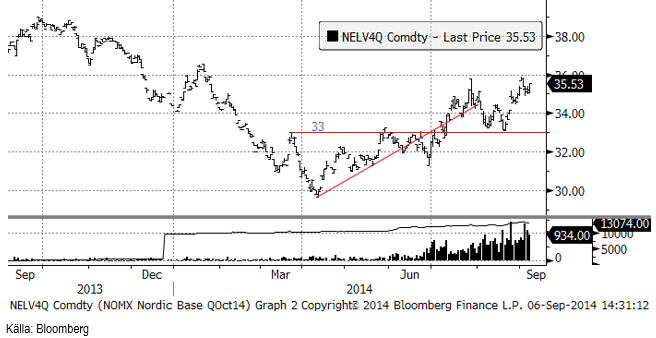
Hydrologisk balans har enligt 2-veckors prognosen försvagats.
Vi rekommenderar köp av EL S om priset kommer ner lite.
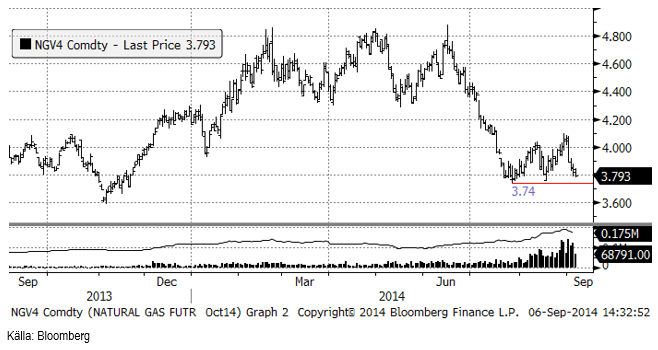
Naturgas
Naturgaspriset (oktoberkontraktet) vände ner vid 4.10 och nådde inte riktigt 4.20 som var motståndsnivån vi skrev om förra veckan. Priset ligger nu på 3.79 dollar, vara 5 cent över det tekniska stödet på 3.74. Priset kan både gå upp och ner, men vi tror att risk / reward är på nedsidan. Skulle stödet brytas, kan prisfallet bli snabbt. Vad som talar för ett prisfall är att Baker Hughes Rig Count ökar så stadigt, vilket leder till ett ökat utbud av naturgas på den amerikanska marknaden.
Med viss tvekan håller vi fast vid vår investering i t ex BEAR NATGAS X4 S.
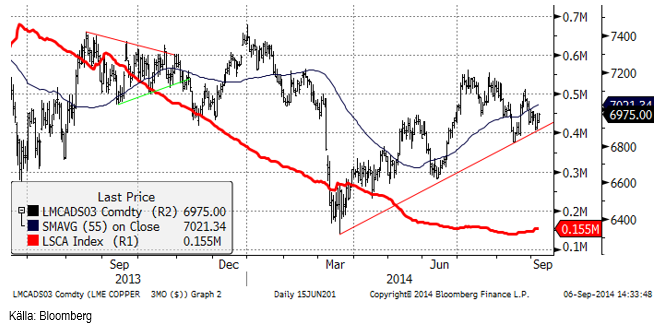
Koppar
Kopparpriset lyckades knappt hålla trendlinjen. Testet av trendlinjen för ett par veckor sedan fick oss att hissa varningsflagg. Nu är marknaden tillbaka på linjen och den ser sårbar ut igen. Som vi har skrivit förut ser vi inte risken för ett stort prisfall. Inte desto mindre, fortsätter den fundamentala balansen att försvagas. Ur ett tradingperspektiv gillar vi ett par olika strategier: Att köpa den korta änden av kurvan och sälja den långa (”lending”) på tron att kurvan ska gå från backwardation till contango. Att gå kort tycker vi är lite för riskabelt, men att utfärda köpoptioner kan vara en intressant strategi, så länge marknaden fortsätter röra sig sidledes eller går ner lite (vilket är vårt huvudsakliga scenario för kopparmarknaden).
Vi rekommenderar neutral position i koppar.
Aluminium
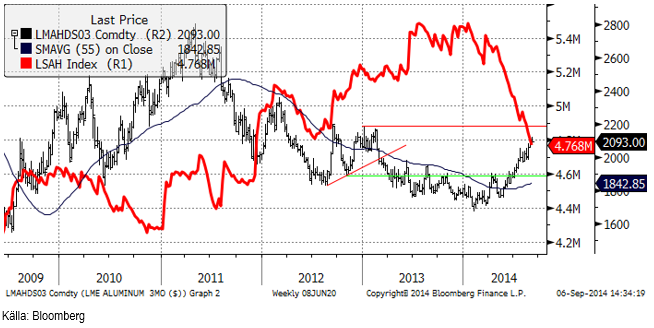
Det finns inte så mycket att rapportera om aluminiummarknaden. Veckan avslutades mer eller mindre oförändrat, fast fortfarande med en positiv underton. Den starka dollarn har helt klart varit en dämpande faktor. Från ett tekniskt perspektiv kan marknadens tvekan inför att notera nya toppnoteringar i den här rörelsen tolkas som tecken på en kommande svaghet i marknaden de närmaste veckorna. Den fysiska marknaden fokuserade på de japanska kvartalsvisa premierna, som fastställdes till 420 dollar i veckan. Det är lite högre än föregående 408 dollar. Höjningen kommer efter höjningar både i USA och i Europa. Några aktörer hade förväntat sig en ännu större höjning av premien i Japan, så i det avseendet kan även detta vara ett tecken på svaghet. Semestrarna på norra halvklotet är nu nästan avklarade, vilket normalt brukar innebära högre efterfrågan på metall de kommande veckorna. Som vi har nämnt förut hör vi att konsumenter håller tillbaka sina köp i väntan på lägre pris och/eller premier. Tiden börjar rinna ut för dessa. Det innebär att om vi får se en rekyl i aluminiumpriset den kommande veckan, så är det förmodligen ett bra köptillfälle.
Vi fortsätter alltså med köprekommendation på ALUMINIUM S.
Zink
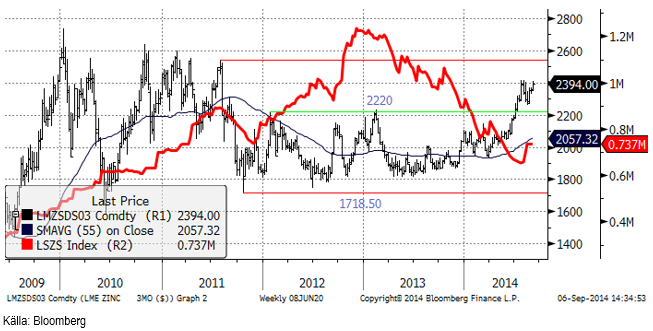
Som väntat gav uppgången en anledning för aktörer att öka på sina köpta positioner. Det första motståndet uppnåddes nästan. Det klassiska mönstret med ett nytt test av motståndsnivån och ett brott av det mot högre prisnivåer är vad vi kan vänta oss härnäst. Fundamentalt finns inte så mycket att rapportera. Enligt Metal Bulletin ger inte premierna för fysisk metall någon vägledning åt något håll, men om något, så är det i så fall en lite svagare utveckling både i Europa och i Asien.
Vi rekommenderar köp av ZINK S.
Nickel
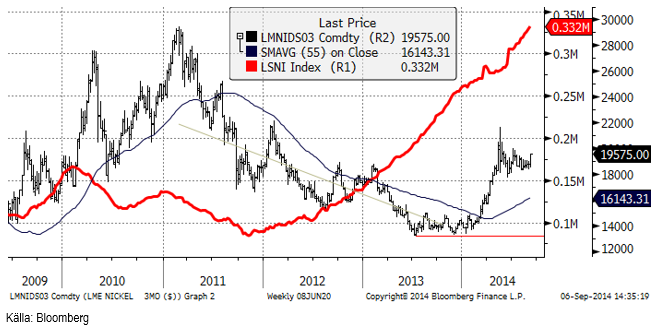
Ett uttalande från miljösekreteraren i Filippinerna antyder tankar på ett exportstopp liknande det i Indonesien. Den här nyheten utlöste en hausse i onsdags och torsdags. Mot slutet av veckan flukturerade priserna nära veckans högsta notering, vid 19450 dollar. Som vi har diskuterat i tidigare veckobrev, kan man vänta sig högre pris på nickel, fast vi har utgått från att det skulle komma först när balansen faktiskt blir ”tightare”. Men som ofta är fallet, diskonterar marknaden det som anses vara det mest sannolika scenariot. I det avseendet är haussen förståelig. Nuvarande momentum i prisrörelsen kan lätt ta priset ännu högre. Teknisk analys indikerar att 20,000 dollar kan nås de kommande veckorna. Vi anser dock att det är lite för tidigt för en stor prisuppgång och ytterligare en period med konsolidering borde följa på en sådan uppgång.
Guld
Den europeiska centralbanken, ECB, sänkte sin refinansieringsränta från 0.15% till 0.05%, insättningsräntan till -0.2% från -0.1% och den marginella lånefacilitetens ränta till 0.3% från 0.4%. De flesta analytikerna hade väntat sig att ECB inte skulle ändra räntorna. ECB-chefen Draghi sade också att QE, dvs att trycka pengar och köpa obligationer på marknaden med dem, fortfarande kan vara aktuellt. En så här liten räntesänkning lär göra varken till eller från. Sannolikheten att nästa steg blir QE är rätt stor. Vad som då händer känner vi till från både USA och Japan: de nytryckta pengarna som obligationssäljarna får, kommer att hamna på aktiebörserna i EU. Efter att Japan startade QE gick Nikkei upp med 83% på mindre än ett år – och valutan föll (nästan lika mycket). Eftersom 2/3 av BNP i vår utvecklade del av världen är konsumtion (och inte investering), kan en stigande aktiebörs få igång konsumtionen – och därmed skapa en BNP-tillväxt. Detta hände faktiskt i Japan, även om BNP-tillväxten nyligen föll tillbaka och nu ligger på -0.2%, vid samma nivå som före QE. Det är svårt att skapa en hållbar tillväxt med en sedelpress. Vinsterna i japanska företag har inte ökat. Endast värderingen har blivit högre.
En sak är dock säker, och det är att ädelmetaller har stigit i värde, i yen-termer.
Den senaste tiden har dollarn stärkts, vilket beror dels på ökningen av geopolitisk risk och dels på att EU:s tillväxt har sjunkit, vilket också beror på geopolitisk risk (Rysslands invasion av Ukraina). En starkare dollar innebär allt annat lika att priset i dollar på guld och andra ädelmetaller (råvaror över huvud taget), har fallit i pris (i dollar). I t ex kronor ser det inte så ut.
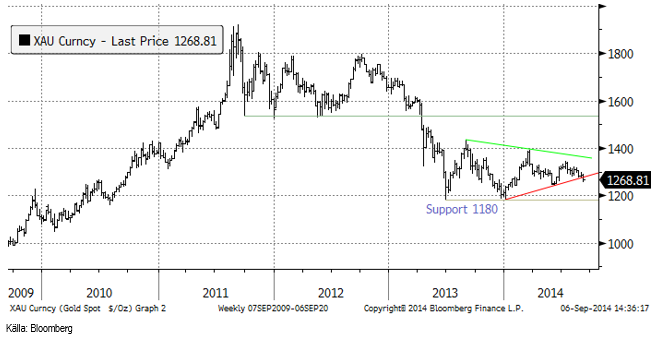
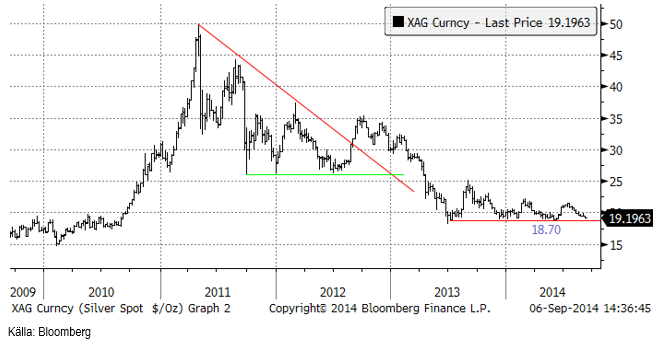
Nedan ser vi veckochartet för guld i dollartermer. Det har faktiskt utlöst ett brott av triangelformationen – på nedsidan. Det brukar anses vara en stark teknisk säljsignal. Allt fundamentalt till trots, vill marknaden inte ha guld just nu.
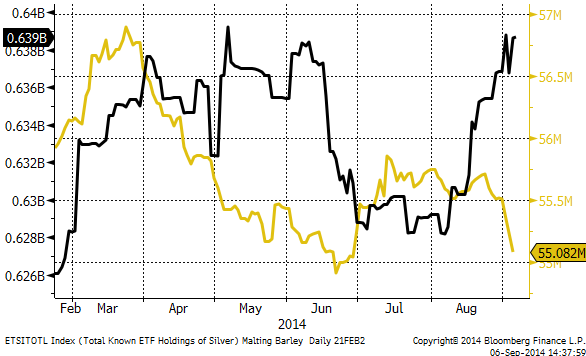
Att marknaden inte vill ha guld ser vi också i förändringen i innehav via börshandlade guldfonder och certifikat nedan. Investerare har den senaste veckan sålt av 500,000 uns guld via sådana instrument. Det är det största utflödet på en vecka hittills i år. Samtidigt har investerare faktiskt ökat på sina innehav i silver. Till viss del kan det alltså handla om att investerare sålt guld och köpt silver. Det är också en ”trade” som vi propagerat för en längre tid.
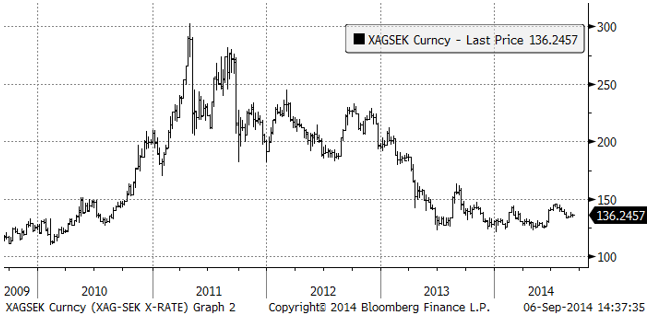
Nedan ser vi guldpriset i svenska kronor per uns. Guld ser mer ”bullish” ut ur ett svenskt perspektiv, om än inte ur ett dollarperspektiv.
Vi rekommenderar köp av GULD S. Hävstångsinstrument som är långa guld i dollartermer i större utsträckning rekommenderar vi inte.
Silver
Silver är vår favorit bland alla råvaror. Dels är har priset varit i konsolidering under mer än ett års tid efter prisfallet från toppnoteringen för tre år sedan, dels gynnas ädelmetaller av den förnyade och tilltagande geopolitiska oron och slutligen är silver billigt i förhållande till guld. Motståndet för nedgången från toppen 2011 är ännu inte bruten, men om eller när det sker, kan prisuppgången bli snabb och stor.
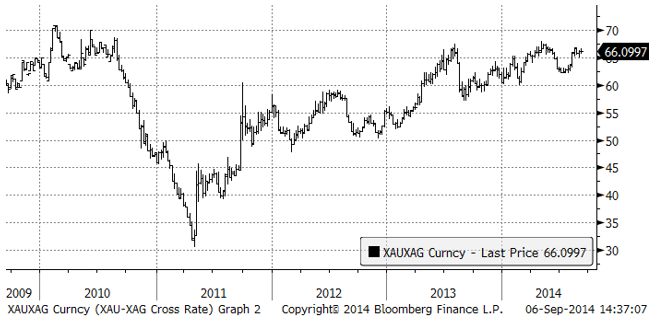
Det som särskilt lockar investerare till silver framför guld just nu är att silver är historiskt billigt jämfört med guld. Nedan ser vi ett diagram över priset på guld uttryckt i silver.
Vi anser att silver är mer köpvärt än guld och skulle vilja köpa på de här nivåerna. Vi rekommenderar köp av SILVER S. Det är dock viktigt att ta en stopp loss om priset bryter stödet.
Platina & Palladium
Platinapriset föll ner till 1400 dollar, som är en teknisk stödnivå.
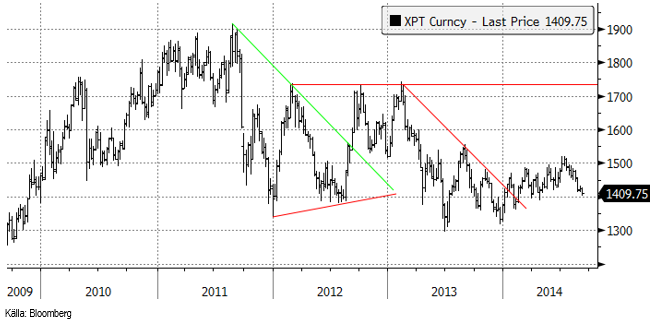
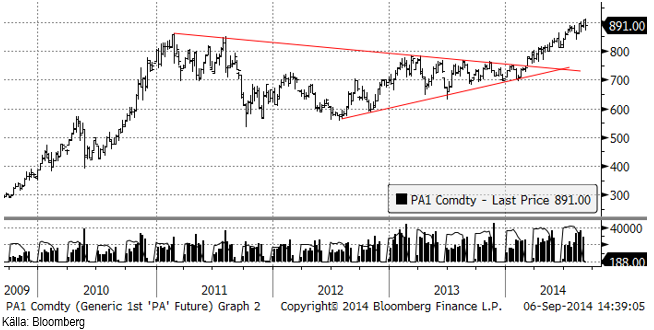
Palladium föll under 900 dollar på vinsthemtagningar. Det skulle egentligen inte förvåna om det kom en rekyl ner mot 800 dollar.
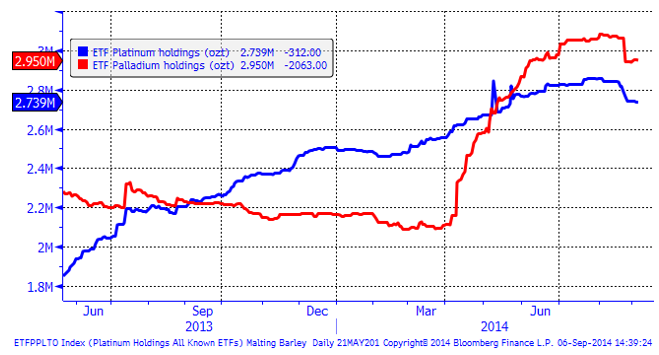
Nedanför ser vi hur mycket metall som finns i börshandlade fonder för platina respektive palladium. So vi ser har folk fortsatt att ta hem vinster i platina, medan de ökat på innehaven något i palladium.
Vi är neutrala på platina men rekommenderar en köpt position i palladium, helst om man kan köpa på en rekyl nära 800 dollar.
Ris
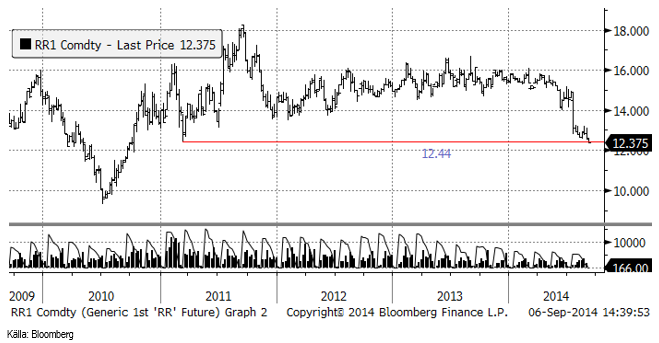
Priset på ris (novemberkontraktet på CME) föll under det tekniska stödet på 12.44 och vi måste därför gå ur den köpta positionen i BULL RIS X4 S.
Kaffe
Det är inga större nyheter på kaffefronten. Tekniskt ser vi att priset på decemberkontraktet tagit sig upp till 200 cent. Möjligen kommer priset att gå upp till 220 cent, där ett starkt motstånd finns. Fundamentalt ser vi dock inte något som talar för högre pris på kaffe.
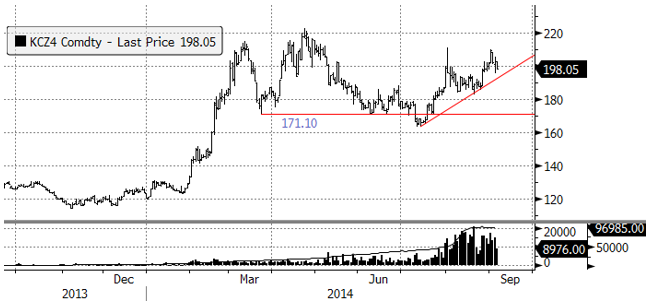
Vi rekommenderar neutral position i kaffe.
Kakao
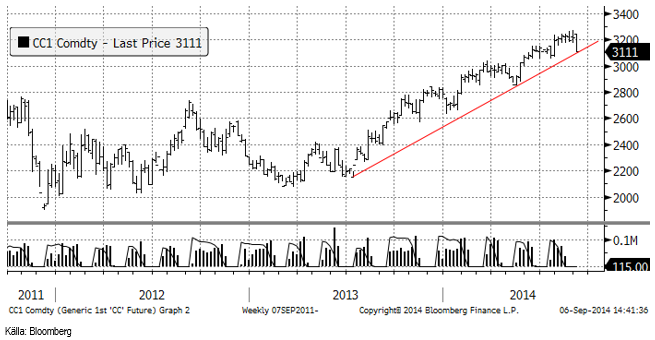
Efter att som vi skrev om förra veckan, the International Cocoa Organization (”ICCO”) meddelat att de ser ett överskott i marknaden istället för ett underskott, föll priset på spotkontraktet i New York från över 3200 dollar per ton ner till 3111 i fredags. Priset ligger nu preics på stödet för den stigande pristrenden. Om det stödet bryts, signalerar teknisk analys att trenden är bruten.
Om priset bryter stödet och går mot lägre nivåer, lämnar vi vår neutrala position och köper något instrument att gå kort i. ”SHORT KAKAO A S” har en hävstång på -0.93 och kan vara ett lämpligt instrument.
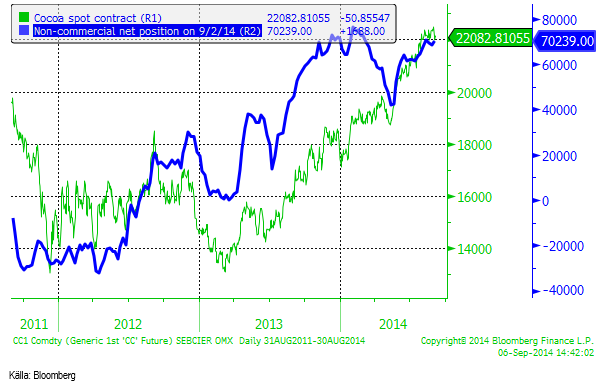
Spekulativ position ligger väldigt högt, historiskt sett. Det kan bli ”trångt i dörren” om trenden vänder nedåt.
För fler analyser se SEBs analysbrev om jordbruksråvaror.
[box]SEB Veckobrev Veckans råvarukommentar är producerat av SEB Merchant Banking och publiceras i samarbete och med tillstånd på Råvarumarknaden.se[/box]
Disclaimer
The information in this document has been compiled by SEB Merchant Banking, a division within Skandinaviska Enskilda Banken AB (publ) (“SEB”).
Opinions contained in this report represent the bank’s present opinion only and are subject to change without notice. All information contained in this report has been compiled in good faith from sources believed to be reliable. However, no representation or warranty, expressed or implied, is made with respect to the completeness or accuracy of its contents and the information is not to be relied upon as authoritative. Anyone considering taking actions based upon the content of this document is urged to base his or her investment decisions upon such investigations as he or she deems necessary. This document is being provided as information only, and no specific actions are being solicited as a result of it; to the extent permitted by law, no liability whatsoever is accepted for any direct or consequential loss arising from use of this document or its contents.
About SEB
SEB is a public company incorporated in Stockholm, Sweden, with limited liability. It is a participant at major Nordic and other European Regulated Markets and Multilateral Trading Facilities (as well as some non-European equivalent markets) for trading in financial instruments, such as markets operated by NASDAQ OMX, NYSE Euronext, London Stock Exchange, Deutsche Börse, Swiss Exchanges, Turquoise and Chi-X. SEB is authorized and regulated by Finansinspektionen in Sweden; it is authorized and subject to limited regulation by the Financial Services Authority for the conduct of designated investment business in the UK, and is subject to the provisions of relevant regulators in all other jurisdictions where SEB conducts operations. SEB Merchant Banking. All rights reserved.

Market is starting to take US/Iran headlines with a pinch of salt. Brent crude rose $2.8/b yesterday to an official close of $112.1/b. But after that it traded as low as $108.05/b before ending late night at around $109.7/b. Through the day it traded in a range of $106.87 – 112.72/b amid a flurry of news or rumors from Iran and the US. ”US temporary sanctions during negotiations” (falls alarm). ”We will bomb Iran” (not anyhow),… etc. While the market is still fluctuating to this kind of news flow, it is starting to take such headlines with a pinch of salt.

We’ll see. Maybe, maybe not. The Brent M1 contract is trading at $110.2/b this morning which very close to the average ticks through yesterday of $110.4/b.
Trump with bearish, verbal intervention whenever Brent trades above $110/b it seems. What seems to be a pattern is that Trump states something like ”very good negotiations going on with Iran”, ”New leaders in Iran are great,..”, ”Great progress in negotiations,…”, ”Deal in sight,..” etc whenever the Brent M1 contract trades above $110/b. An effort to cool the market. These hot air verbal interventions from Trump used to have a heavy bearish impact on prices, but they now seems to have less and less effect unless they are backed by reality.
As far as we can see there has been no real progress in the negotiations between the US and Iran with both sides still standing by their previous demands.
Iran is getting stronger while the cease fire lasts making a return to war for Trump yet harder. Iran is naturally in constant preparation for a return to war given Trump’s steady threats of bombing Iran again. Iran is naturally doing what ever is possible to prepare for a return to war. And every day the cease fire lasts it is better prepared. This naturally makes it more and more difficult and dangerous for the US to return to warring activity versus Iran as the consequences for energy infrastructure in the Persian Gulf will be more and more severe the longer the cease fire lasts. Israel seems to see it this way as well. That the war is not won and that current frozen state of a cease fire gives Iran opportunity to rebuild military and politically.
Global inventories are drawing down day by day. How much? In the meantime the Strait of Hormuz stays closed. There is varying measures and estimates of how much global inventories are drawing down. Our rough estimate, back of the envelope, is that global inventories are drawing down by at least some 10 mb/d or about 300 mb/d in a balance between loss of supply versus demand destruction. Other estimates we see are a monthly draw of 250-270 mb/d. The IEA only ’measured’ a draw in global observable stocks of 117 mb in April with oil on water rising 53 mb while on shore stocks fell 170 mb. But global stocks are hard to measure with large invisible, unmeasured stocks. As such a back of the envelope approach may be better.
Oil products is what the world is consuming. Oil product prices likely to rise while product stocks fall. Strategic Petroleum Reserves (SPR) are predominantly crude oil. Discharging oil from OECD SPR stocks, a sharp reduction in Chinese crude imports and a reduction in global refinery throughput of 6-7 mb/d has helped to keep crude oil markets satisfactorily supplied. But global inventories are drawing down none the less. And oil products is really what the world is consuming. So if global refinery throughput stays subdued, then demand will eventually have to match the supply of oil products. The likely path forward this summer is a steady draw down in jet fuel, diesel and gasoline. Higher prices for these. Then, if possible, higher refinery throughput and higher usage of crude in response to very profitable refinery margins. And lastly sharper draw in crude stocks and higher prices for these. But some 6 mb/d of oil products used to be exported through the Strait of Hormuz. And it may not be so easy to ramp up refinery activity across the world to compensate. Especially as Ukraine continues to damage Russian refineries as well as Russian crude production and export facilities.
Watch oil product stocks and prices as well as Brent calendar 2027. What to watch for this summer is thus oil product inventories falling and oil product premiums to crude rising. Another measure to watch is the Brent crude 2027 contract as it rises steadily day by day as the Strait of Hormuz stays closed and global oil inventories decline. The latter is close to the highest level since the start of the war and keeps rising.
The Brent M1 contract and the Brent 2027 prices and current price of jet fuel in Europe (ARA). All in USD/b

Our back of the envelope calculation of the global shortage created by the closure of the Strait of Hormuz. Note that 3.5 mb/d of discharge from SPR is also a draw. Note also that ’Forced demand loss’ of 2.5 mb/d is probably temporary and will fall back towards zero as logistics are sorted out leaving ’Price demand loss’ to do the job of balancing the market. Thus a shortfall of at least 9 mb/d created by the closure. More if SPR discharge is included and more if Forced demand loss recedes.

Brent is climbing higher. Front-month is at USD 106.3/bl this morning, close to a weekly high and a USD 9/bl jump from Mondays open. This is the move we flagged as a risk earlier in the week: the market shifting from ”a deal is around the corner” to ”this is going to take longer than we thought”.

Analyst Commodities, SEB
During April, rest-of-year Brent remained remarkably stable around USD 90/bl. A stability which rested on one single assumption: the SoH reopens around 1 May. That assumption is now slowly falling apart.
As we highlighted yesterday: every week of delay beyond 1 May adds (theoretically) ish USD 5/bl to the rest-of-year average, as global inventories draw 100 million barrels per week. i.e., a mid-May reopening implies rest-of-year Brent closer to USD 100/bl, and anything pushing into June or July takes us meaningfully higher.
What’s changed in the last 48 hours:
#1: The US military has formally warned that clearing suspected sea mines from SoH could take up to six months. That is a completely different timescale from what the financial market is pricing. Even a political deal tomorrow does not immediately reopen the strait.
#2: Trump has shifted his tone from urgency to ”strategic patience”. In yesterday’s press conference: ”Don’t rush me… I want a great deal.” The market is reading this as a president no longer feeling pressured by timelines, with the naval blockade running in the background.
#3: So far, the military activity is escalating, not de-escalating. Axios reports Iran is laying more mines in SoH. The US 3rd carrier strike group (USS George H.W. Bush) is arriving with two countermine vessels. Trump yesterday ordered the US Navy to destroy any Iranian boats caught laying mines. While CNN reports that the Pentagon is actively drawing up plans to strike Iranian SoH capabilities and individual Iranian military leaders if the ceasefire collapses. i.e., NOT a attitude consistent with an imminent deal!
Spot crude and product prices eased off the early-April highs on a combination of system rerouting and deal optimism. Both now weakening. Goldman estimates April Gulf output is reduced by 14.5 mbl/d, or 57% of pre-war supply, a number that keeps getting worse the longer this drags on.
Demand-side adaptation is ongoing: S. Korea has cut its Middle East crude dependence from 69% to 56% by pulling more from the Americas and Africa, and Japan is kicking off a second round of SPR releases from 1 May. But SPRs are finite.
Ref. to the negotiations, we should not bet on speed. The current Iranian leadership is dominated by genuine hardliners willing to absorb economic pain and run the clock to extract concessions. That is not a setup for a rapid resolution. US/Israeli media briefings keep framing the delay as ”internal Iranian divisions”, the reality is more complicated and points toward weeks and months, not days.
Our point is that the complexity is large, and higher prices have only just started (given a scenario where the negotiations drag out in time). The market spent April leaning on the USD 90/bl rest-of-year assumption; that case is diminishing by the hour. If ”early May reopening” is replaced by ”June, July or later” over the next week or two, both crude and products have meaningful room to reprice higher from here. There is a high risk being short energy and betting on any immediate political resolution(!).
Down on Friday. Up on Monday. The Brent June crude oil contract traded down 5.1% last week to a close of $90.38/b. It reached a high of $103.87/b last Monday and a low of $86.09/b on Friday as Iran announced that the Strait of Hormuz was fully open for transit. That quickly changed over the weekend as the US upheld its blockade of Iranian oil exports while Iran naturally responded by closing the SoH again. The US blew a hole in the engine room of the Iranian ship TOUSKA and took custody of the ship on Sunday. Brent crude is up 5.6% this morning to $95.4/b.
The cease-fire is expiring tomorrow. The US has said it will send a delegation for a second round of negotiations in Islamabad in Pakistan. But Iran has for now rejected a second round of talks as it views US demands as unrealistic and excessive while the US is also blocking the Strait of Hormuz.
While Brent is up 5% this morning, the financial market is still very optimistic that progress will be made. That talks will continue and that the SoH will fully open by the start of May which is consistent with a rest-of-year average Brent crude oil price of around $90/b with the market now trading that balance at around $88/b.
Financial optimism vs. physical deterioration. We have a divergence where the financial market is trading negotiations, improvements and resolution while at the same time the physical market is deteriorating day by day. Physical oil flows remain constrained by disrupted flows, longer voyage times and elevated freight and insurance costs.
Financial markets are betting that a US/Iranian resolution will save us in time from violent shortages down the road. But every day that the SoH remains closed is bringing us closer to a potentially very painful point of shortages and much higher prices.
The US blockade is also a weapon of leverage against its European and Asian allies. When Iran closed the SoH it held the world economy as a hostage against the US. The US blockade of the SoH is of course blocking Iranian oil exports. But it is also an action of disruption directed towards Europe and Asia. The US has called for the rest of the world to engaged in the war with Iran: ”If you want oil from the Persian Gulf, then go and get it”. A risk is that the US plays brinkmanship with the global oil market directed towards its European and Asian allies and maybe even towards China to force them to engage and take part. Maybe unthinkable. But unthinkable has become the norm with Trump in the White House.


Sommarväder skapar prisrally på elbörsen
Oil product price pain is set to rise as the Strait of Hormuz stays closed into summer

Solkraften pressar elpriserna dagtid

Michel Gubel ger sin syn på oljemarknaden