

Analys
SEB – Råvarukommentarer, 8 december 2014

Veckans rekommendationer
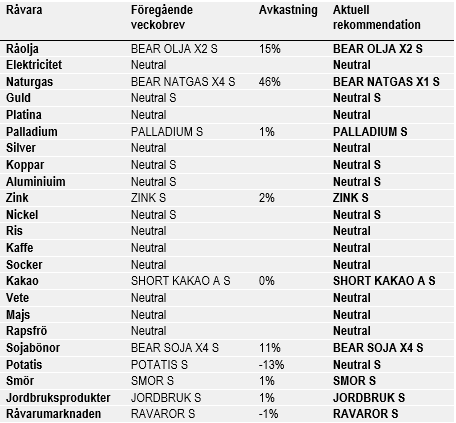
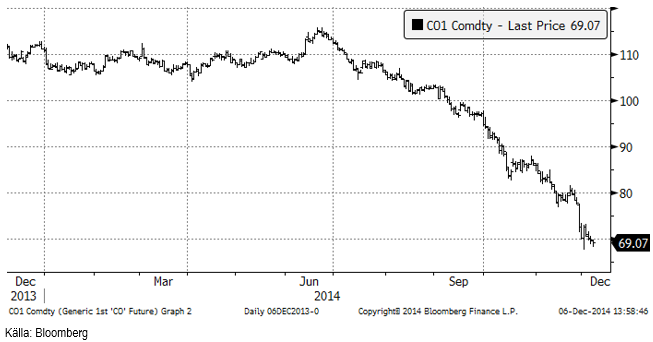
Råolja – Brent
Prisraset hejdade sig något vid 70 dollar i veckan, men gled successivt under den nivån och stängde på 69.07 i fredags. Nyheten att Irak planerar att öka exporten av råolja under nästa år (2015) från nuvarande 2.75 mbpd till 3.2 mbpd tyngde marknaden.
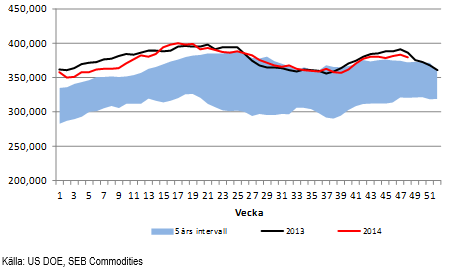
Lagren i USA sjönk med 3.7 miljoner fat enligt DOE:s statistik i veckan. Det är helt i enlighet med säsongsmönstret.
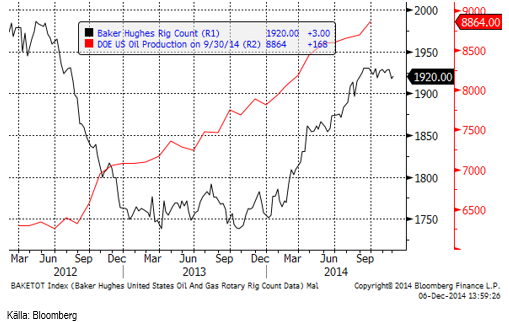
Nedan ser vi ett diagram på antalet oljeriggar i USA, enligt Baker Hughes statistik (svart). Antalet riggar i drift ökade med 3 till 1920 i veckan som gick. Det var nog inte väntat med en ökning. Vi ser dock ändå att antalet i drift har planat ut på mellan 1920 och 1930 riggar, i spåren av oljeprisfallet. Detta är säkerligen en besvikelse för dem som hoppats på en botten i oljepriset, att antalet inte minskar mer.
Saudi-ARAMCO har sänkt sitt pris för export till Asien och USA till den lägsta nivån sedan åtminstone år 2000. De säljer nu sin olja 2 dollar under benchmarkindexet. Så sent som vid årsskiftet såldes oljan för 3.50 dollar över benchmarkindexet. Priset är alltså till och med lägre än det var år 2008.
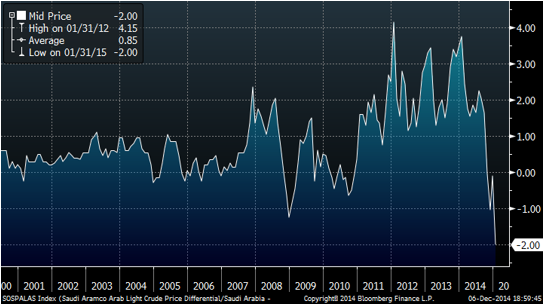
Det här är naturligtvis ett tecken på att Saudierna verkligen vill sälja så mycket olja de kan, för att via volym försöka hålla landets oljeintäkter uppe. Det är helt i linje med den spelteoretiska analys vi gjorde för ganska länge sedan, att skiffertekniken gör att OPEC som kartell upphör att fungera och oljeländerna går över till att agera såsom under fri konkurrens. Tidskriften The Economist nämnde samma analysmetod, spelteori i veckan som gick. Det centrala i den är inte att volymen från skiffertekniken behöver vara så värst stor, utan att den finns och är tillgänglig för ett stort antal länder.
Vi får ofta frågan vad kostnaden för skifferolja är i USA, eftersom man ser många olika uppgifter på det. Det som gör det svårt att svara på frågan är att tekniken utvecklas med ca 30% effektiviseringsgrad per år. En kostnad på 60 dollar för två år sedan kan alltså pga effektivitetsförbättringar vara 29 dollar per fat i år. Geologin spelar också roll, t ex hur djupt skifferlagret ligger. Olika fält har olika kostnadsnivå i USA. Så det går inte att svara entydigt vad kostnaden för att utvinna skifferolja är just nu. US DOE säger dock att den redan i år är ett par dollar billigare än konventionell olja att utvinna i USA.
Veckan som kommer är händelserik på oljemarknaden. Här är schemat:
Måndag 8 december. China crude oil, oil products and coal imports and exports data.
Tisdag 9 december. 1800 CET. US Department Of Energy monthly energy report – Short Term Energy Outlook (STEO)
Onsdag 10 december. OPEC Monthly Oil Market Report (OMR)
Onsdag 10 december. 1630 CET. US Department Of Energy. Weekly US oil inventory data.
Fredag 12 december. 1000 CET. International Energy Market OMR.
Fredag 12 december. 1900 CET. Oil and Gas rig count by Baker Hughes
Vi rekommenderar en kort position, t ex med BEAR OLJA X2 S.
Elektricitet
Priset på elektricitet föll mot slutet av veckan. Den nordiska situationen är att vädret ser mildare ut än normalt. Det är lite högre spotpriser. Prisområdena ser ut som de brukar, med lite lägre pris i norr och lite högre i söder.
Det är kallare än normalt i Europa, så det är lite högre pris på EEX, men forwardpriserna är under tryck.
Kolmarknaden är under press. Kolpriset påverkas mycket av Brent-priserna, naturligtvis.
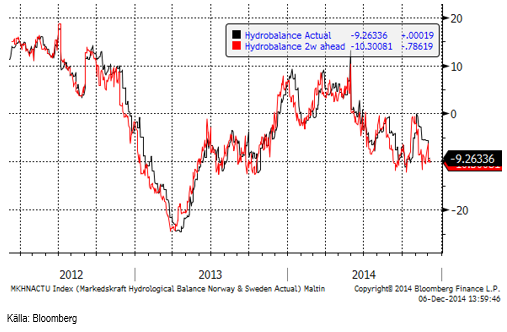
Hydrologisk balans har enligt 2-veckors prognosen sjunkit från -7.7 TWh till -10.3 TWh.
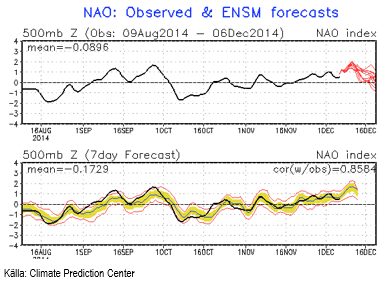
Den Nordatlantiska Oscillationen, där ett NAO som är positivt innebär att varma och fuktiga vindar från sydväst kommer in över Norden, har i en månad medfört väder som präglats av detta. Som vi kan se förutspås denna tendens att fortsätta och vid ungefär den 16 december eventuellt gå över till negativt. Negativt NAO innebär att stillastående ishavskyla kommer ner över Norden, men stjärnklart, vindstilla och knasterkallt väder. Eftersom det både är kallt och vindkraftverken står stilla innebär det högre pris på elektricitet. Det mildra väder vi har nu, kan alltså komma att följas av kallare.
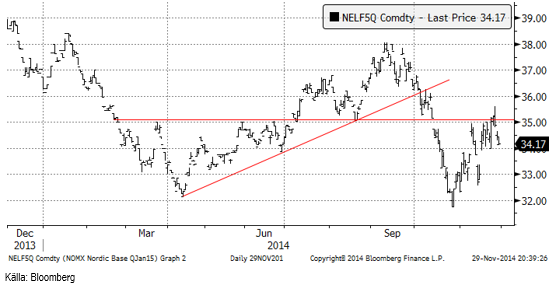
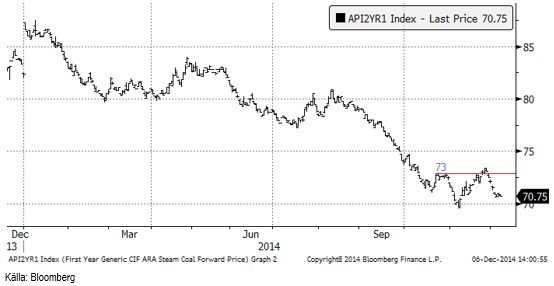
Nedan ser vi terminskontraktet för leverans av kol under 2015, som sjunkit från 72.10 dollar per ton till 70.75 i fredags.
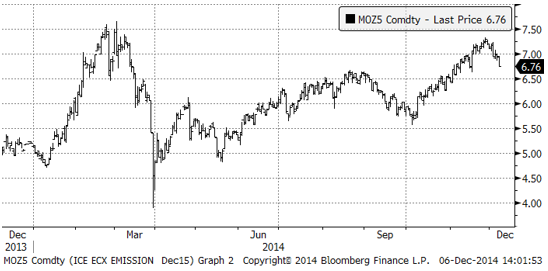
Priset på utsläppsrätter vände nedåt i veckan.
Naturgas
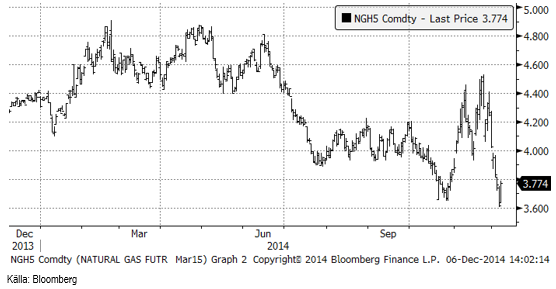
Naturgaspriset föll kraftigt i veckan, från 4.03 dollar till 3.77 dollar per miljoner BTU.
Koppar
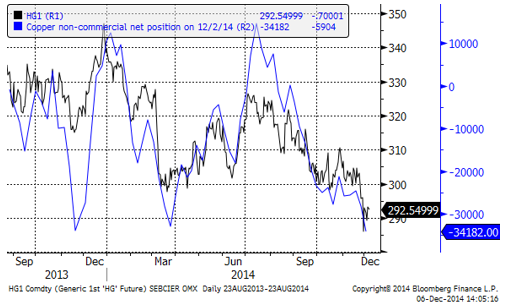
November avslutades med massiv likvidering av koppar. Varje tänkbart tekniskt stöd bröts i den våg av likvidering av köpta positioner och etablering av nya korta positioner som ägde rum. Det verkar som om detta började i Asien, men det är svårt att utröna vad det var som utlöste paniken – möjligen besvikelsen över att Chiles produktion i oktober var den högsta på fem månader. Prisfallet fortsatte in i veckan som gick och även LME noterade en botten som var lägre än den i mars, ner till 6230 dollar per ton. Prisnedgången till den nivån möttes av stora köpordrar som inte bara absorberade säljordrarna, utan lyfte priset till 6450 dollar till slutet av dagen – en mycket stor prisrörelse för att vara en dag i kopparmarknaden!
Tekniskt kan vi dock se att en ny lägre botten noterades, lägre än den i mars. Några kanske minns att i mars var det SRB, den kinesiska ”Strategic Reserve Bureau”, som klev in och köpte på sig stora mängder koppar. Det är möjligt att det var SRB som köpte igen, men det är svårt att veta, naturligtvis. Men bara det faktum att det KAN ha varit dem, gjorde att säljare avhöll sig från att sälja på vad som annars hade varit en tydlig teknisk säljsignal.
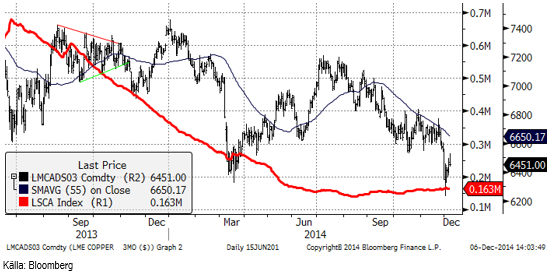
Spekulantkollektivet (non-commercials i CFTC:s data) har fortsatt att sälja terminer på koppar, som vi ser i diagrammet nedan.
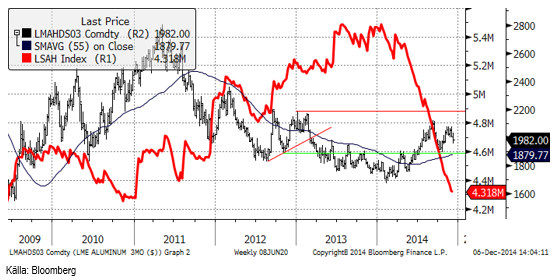
Aluminium
Skillnaden mellan cash och 3-månaders terminspris gick från 27 dollar i backwardation till under veckan. De längre terminerna handlas med contango, men mindre än normalt. Dec-14 till Dec-15 handlas t ex 20 dollar i contango mot 40-50 dollar för en månad sedan. Flödet mellan annullerade lagerbevis och nyskapade lagerbevis antyder att det sker något lite ”lending” i marknaden, enligt Metal Bulletin. Det verkar rimligt med tanke på att det är backwardation. Marknaden för fysisk metall (premierna) är lite svagare i Europa. Rotterdamnoteringen har kommit ner med 10 dollar till 420 dollar (över LME:s pris). Det officiella indexet för den amerikanska Mellanvästern håller sig fortfarande stabilt vid 520 dollar, men en del rapporter antyder att det skett stora affärer under den nivån. Om det är början på en minskning i premien är svårt att säga, men det kan vara början.
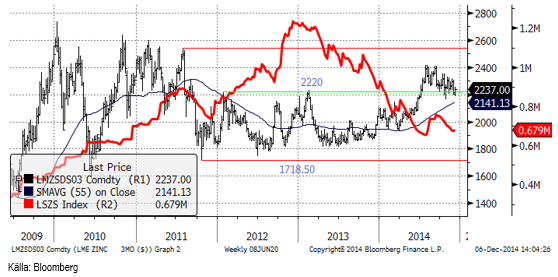
Zink
Zinkpriset låg kvar i den senaste tidens tradingintervall, trots prisnedgången i koppar. Priset rörde sig huvudsakligen nedåt i början av veckan, men repade sig mot slutet. Den underliggande trenden tror vi är uppåtriktad, men marknaden verkar ha svårt att röra sig åt något håll just nu.
Underskottet i marknaden känns ännu inte av eftersom lagren år så höga. Investerare som köpt in sig i ”bull caset” på zink har gått i och ur marknaden och skapat en ganska fluktuerande marknad. Det verkar som om detta läge kan bestå ett tag innan en ny uppgångsfas börjar (som vi tror blir någon gång i början på nästa år).
Vi behåller köprekommendationen på ZINK S.
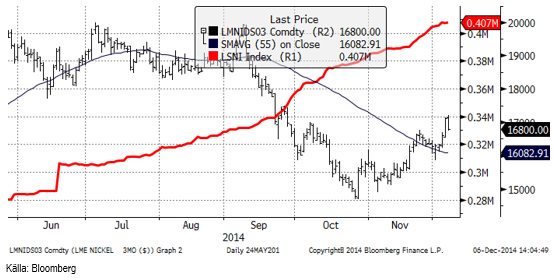
Nickel
Nickelpriset som rekylerade för en vecka sedan, fann ny styrka i veckan som gick. Vi har i ett år fokuserat på utbudssidan, med Indonesiens exportstopp i fokus. Förra veckan noterade vi att efterfrågan långsiktigt kan få en knäck om det lägre oljepriset dämpar skifferrevolutionen i USA. I Metal Bulletins senaste rapport om rostfritt stål, skriver de (inte förvånande) att en ökning i efterfrågan väntas det kommande kvartalet. Men även fortsättningsvis kommer nog utbudssituationen att fortsätta att vara i marknadens fokus. Den tydligaste indikatorn är LME:s lager. Det kan också vara intressant att studera annullerade lagerbevis (warrants) och hur den volymen utvecklas. Just nu annulleras mest lagerbevis i Malaysia och därifrån går flödet vanligtvis till Kina.
Tekniskt har priset vänt upp igen till 17,000 dollar, som noterades i torsdags. Fredagens handel var volatil och slutade med vinsthemtagningar och ett stängningspris på 16,750 dollar.
Guld
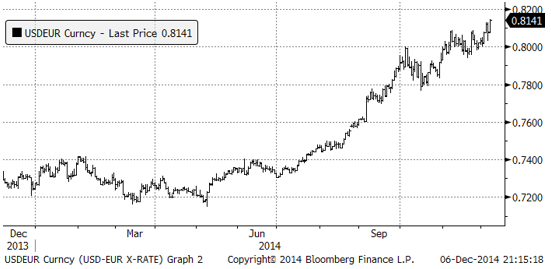
Guldpriset föll från det tekniska motståndet i fredags efter arbetsmarknadsstatstiken i USA publicerats. Den visade att amerikanska företag anställt 321,000 personer i November och det var ungefär 100,000 personer fler än vad marknaden hade förväntat sig. Det är den starkaste månaden på arbetsmarknaden sedan januari 2012.
Detta fick dollarn att fortsätta stärkas mot andra valutor. I diagrammet nedan ser vi hur USDEUR (alltså priset på en dollar uttryckt i euro) förändrat sig det senaste året.
Nedan ser vi hur guldpriset i dollar utvecklat sig, alltså växelkursen XAUUSD.
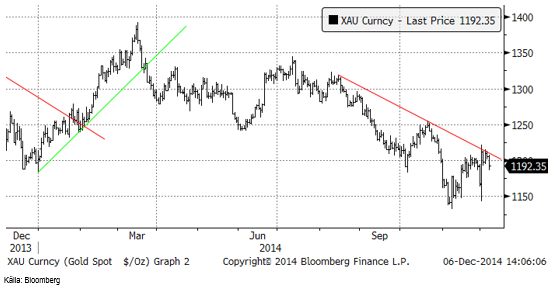
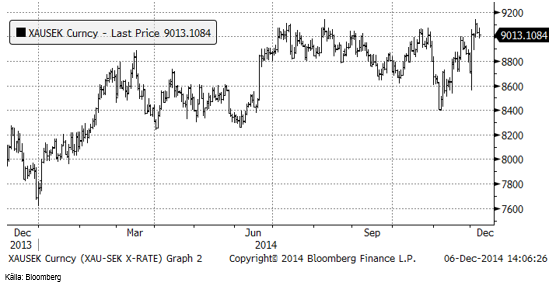
Den svenska kronan är svag och har gått från 9.10 mot euron i början av september till 9.28 i fredags. Det innebär att guldpriset faktiskt stod på årshögsta i veckan som gick, även om en viss rekyl noterades i torsdags och fredags.
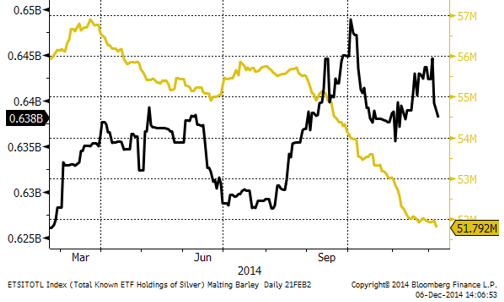
Institutionella investerare har fortsatt att sälja guld igen och nu har de även vräkt ut silver. Antagligen sker en hel del likvidering av generella råvarufonder, till fördel för generella aktiefonder, en process som antagligen fått mer fart i takt med oljeprisets nedgång.
Vi fortsätter med neutral rekommendation på guld.
Silver
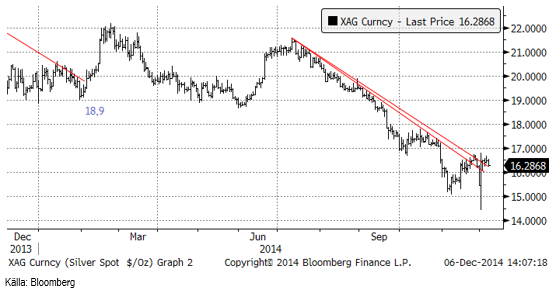
Silverpriset står och väger. Tekniskt har motstånden brutits, oavsett hur man drar linjen, men det finns inget momentum uppåt i prisrörelsen, så detta behöver inte betyda att den fallande trenden är bruten.
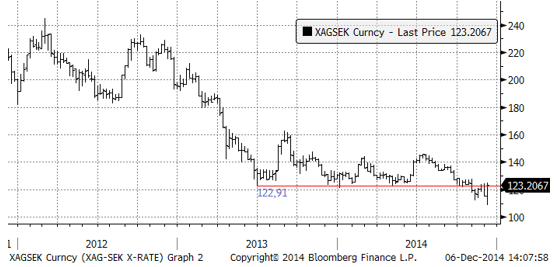
Silverpriset i kronor befinner sig fortfarande i det läge, där metallen enligt den tekniska analysen borde säljas, så länge priset inte går högre, vilket skulle förändra den tekniska bilden av marknaden.
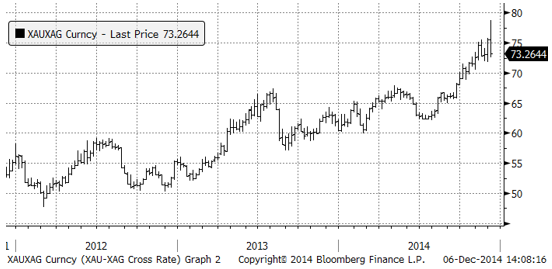
Silver har i och med prisuppgången i veckan värderats upp i förhållande till guld. Fortfarande är dock silver ”billigt” i förhållande till guld. Det betyder i och för sig inte att det inte kan bli ännu billigare.
Platina & Palladium
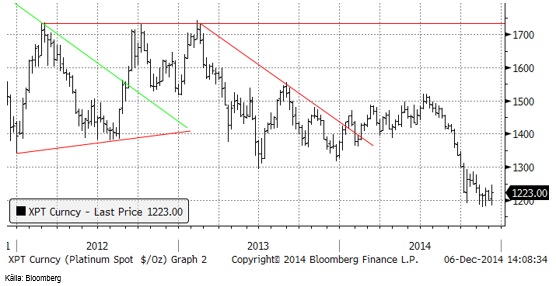
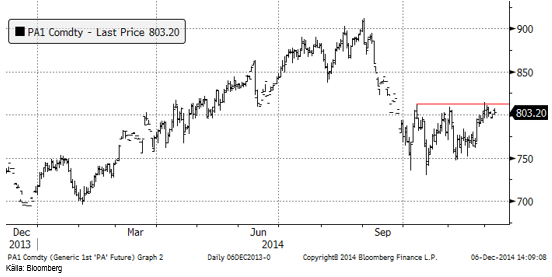
Priset på platina reste sig från 1200 dollar och stängde 23 dollar högre i fredags. Fortfarande är dock marknaden i ”sidledes” konsolidering. Priset skulle behöva gå över 1300 för att man ska våga tro på att vinden har vänt. Tills vidare ser vi dock uppgångar som potentiella säljtillfällen.
Palladiumpriset gjorde ett försök att bryta det tekniska motståndet, men rekylerade ner i veckan. I fredag torsdags gjordes ett nytt försök från veckans lägsta pris, men köparna orkade inte ända fram, delvis förmodligen på grund av dollarns styrka. Skulle motståndet brytas, skulle vi vilja köpa (ännu mer) palladium.
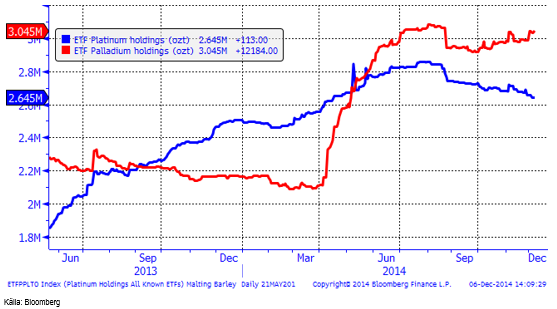
Nedanför ser vi hur mycket metall som finns i börshandlade fonder för platina respektive palladium. Investerare har fortsatt att sälja platina och köpa palladium den senaste veckan.
Ris
Priset på ris sjönk med 0.25 cent i veckan till 12.065 cent per pund. Priset pressas samtidigt som skörden pågår som bäst runtom i världen. 12 cent verkar vara någon slags psykologisk stödnivå.
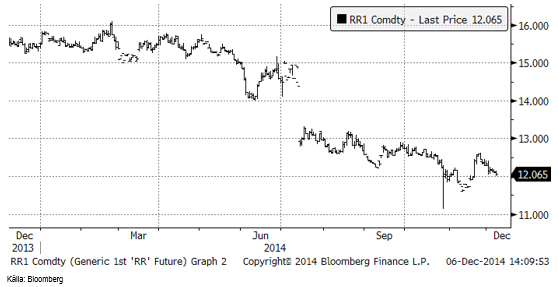
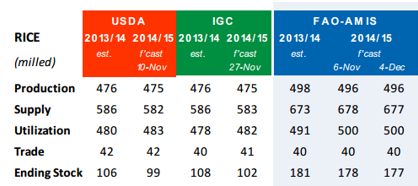
FAO / AMIS lämnade produktionsestimatet oförändrat i rapporten som kom den 4 december. Utgående lager sänks med 1 mt till 177 mt.
12 cent verkar vara ett stöd, samtidigt som FAO justerar ner utgående lager. Det finns trots allt en antydan till positiva tongångar för priset på ris.
Kaffe
Kaffepriset (mars) har fortsatt att försvagas, såsom vi mer eller mindre förväntat oss. Det nederbördsrika vädret i Brasilien fortsätter. Terminen stängde på 180.10 cent per pund i fredags, efter att ha handlats ner ganska ordentligt under dagen. Bryts 180-centsnivån finns nästa stöd vid 170 cent. Med ett fundamentalt långsiktigt överskott i marknaden och en genomsnittlig produktionskostnad i Brasilien på ca 150 cent, enligt en rapport från USDA för ett år sedan, skulle ett rimligt pris kunna ligga vid 140 – 160 cent.
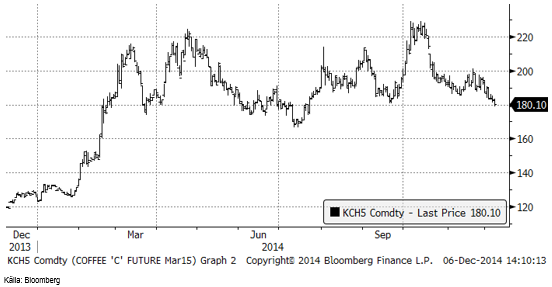
Vi har neutral rekommendation, men bryts 180 cent, går vi omedelbart kort via t ex BEAR KAFFE X1 S.
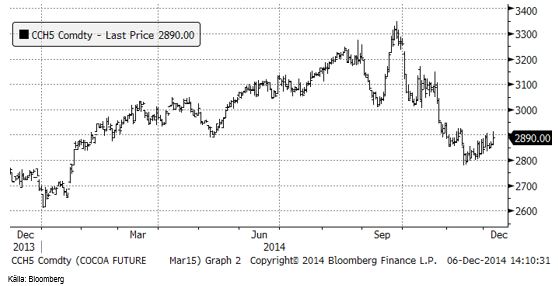
Kakao
Kakaopriset befinner sig i vad som ser ut som en rekyl mot den huvudsakliga trenden, som vi tror är en fallande pristrend. ICCO säger att produktionen är stigande och går mot ett överskott. Det talar för ett lägre pris.
Den senaste veckan har ”non-commercials” sålt ytterligare lite terminskontrakt .De har fortfarande 30721 kontrakt kvar att sälja till dess de når en neutral position.
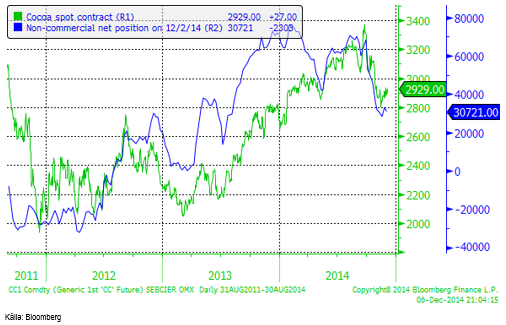
Vi behåller positionen i SHORT KAKAO A S. Nu finns även en BEAR KAKAO X1 S med 1 gånger negativ daglig hävstång och en BEAR KAKAO X4 S med fyra gångers negativ daglig hävstång.
För fler jordbruksanalyser se SEB-bankens andra analysbrev.
[box]SEB Veckobrev Veckans råvarukommentar är producerat av SEB Merchant Banking och publiceras i samarbete och med tillstånd på Råvarumarknaden.se[/box]
Disclaimer
The information in this document has been compiled by SEB Merchant Banking, a division within Skandinaviska Enskilda Banken AB (publ) (“SEB”).
Opinions contained in this report represent the bank’s present opinion only and are subject to change without notice. All information contained in this report has been compiled in good faith from sources believed to be reliable. However, no representation or warranty, expressed or implied, is made with respect to the completeness or accuracy of its contents and the information is not to be relied upon as authoritative. Anyone considering taking actions based upon the content of this document is urged to base his or her investment decisions upon such investigations as he or she deems necessary. This document is being provided as information only, and no specific actions are being solicited as a result of it; to the extent permitted by law, no liability whatsoever is accepted for any direct or consequential loss arising from use of this document or its contents.
About SEB
SEB is a public company incorporated in Stockholm, Sweden, with limited liability. It is a participant at major Nordic and other European Regulated Markets and Multilateral Trading Facilities (as well as some non-European equivalent markets) for trading in financial instruments, such as markets operated by NASDAQ OMX, NYSE Euronext, London Stock Exchange, Deutsche Börse, Swiss Exchanges, Turquoise and Chi-X. SEB is authorized and regulated by Finansinspektionen in Sweden; it is authorized and subject to limited regulation by the Financial Services Authority for the conduct of designated investment business in the UK, and is subject to the provisions of relevant regulators in all other jurisdictions where SEB conducts operations. SEB Merchant Banking. All rights reserved.

Selling down on a ”deal”. Brent crude fell 6.2% last week with accelerated weakness towards the end of the week. Close of the week at $87.33/b and low of the week (and on Friday) of $85.8/b. Brent is falling another 4% this morning to $83.7/b on confirmation by Iran that a MoU text has been reached and that it will be signed on Friday this week.

So what is this ”deal” worth? Talk on the desk here this morning is that it is much like ”putting lipstick on a pig” where Trump has to sell this at home as a victory where ”the SoH has reopened”, the nuclear issue will be ironed out over the coming 60 days (or maybe 600 days?) and US consumers are getting a lower gasoline price and maybe US republicans survives the midterm elections.
The importance for Iran is that it emerges as the defacto winner of this war in the eyes of the non-US public world. That Iran now onwards is the ”ruler of the SoH” (combo of geography and new weapons systems like drones) or more softer: ”the guarantor of safe passage through the SoH”.
Iran doesn’t need nuclear weapons any more. Nuclear deterrence doesn’t work any more. Ukraine has made many attacks deep into Russia without being nuked in return. Plenty of Iranian ballistic rockets blasts over Israel but Iran wasn’t nuked in return.
There is no trust between the US and Iran. We don’t know all the details yet of the MoU. But what we do know is that there is no trust between the US and Iran what so ever. This is probably more like a descriptive text on how they can cooperate in a way where both sides keeps tactical leverage. Neither side makes irreversible concessions. Violations can be punished quickly. Cooperation produces immediate benefits.
This is a fragile structure. It can easily break down. There may be details which cannot be overcome. To be seen on Friday. The US has to show that it is willing put enough force behind managing and restraining Israel versus Hezbollah in Lebanon. We have seen that Netanyahu hasn’t listened all that much to Trump’s directives and wishes. This could be a major obstacle.
A gradual reopening is tactically preferable for Iran. A tactical leverage for Iran right now is that global oil stocks have been drawn down towards painful and increasingly dangerous levels with increasing risks for oil price spikes in mid-July to August. This together with US midterm elections on 3 November gives tactical leverage to Iran. Iran probably doesn’t want to fully give up on that leverage. A rapid, full reopening where global stocks are able to refill over the coming 60 days will significantly erode that leverage. If Iran reinstates a closure of the SoH after 60 days (if talks break down again), then the effect won’t be that impactful in terms of prices and the US midterm elections.
So a gradual and partial reopening where global markets gets the oil they need while they are unable to rebuild stocks could be a practical middle way for both parties. Trump can sell it as ”the SoH has reopened” and get affordable gasoline for US consumers. Iran can sell it as ”the SoH has fully reopened, but there is some friction” so flow is only 60-80% of normal.
Not much real demand destruction below $100/b. What we do know is that there is not much real price pain demand destruction for oil globally at an oil price below $100/b. A lot of demand-shock destruction. Fear. But demand should now come roaring back towards normal with fear for exceptionally high prices now is rapidly receding.
Sudden China demand destruction due to EVs? Bullocks. EV share of total Chinese carpool now around 13%. Share of new sales of EVs has reached 50%. This is a very gradual process. It doesn’t make oil demand fall like a rock over night. When EV new sales share reaches 100%, then the gasoline car pool will contract by some 5-10% per year. But that is only gasoline. Sudden reduction in Chinese oil demand is more about shock and risk.
Chinese crude oil imports will come roaring back. At what price? Today’s ”neutral” oil price is $70/b. That is the five year price which has steadily traded around the $70/b mark over the past 3-4 years. With still a risky picture one would think that China and the rest of the world will be big buyers of oil in the range of $70-85/b.
Global demand will likely snap back towards normal, forecasted demand and growth at such prices.
Physical reopening is a gradual process. The physical and practical reopening of the SoH will likely be gradual rather than sudden. And that probably suites Iran tactically as well.
Brent M1 price versus the Brent 5-yr (today’s ”normal” price)

Market is starting to take US/Iran headlines with a pinch of salt. Brent crude rose $2.8/b yesterday to an official close of $112.1/b. But after that it traded as low as $108.05/b before ending late night at around $109.7/b. Through the day it traded in a range of $106.87 – 112.72/b amid a flurry of news or rumors from Iran and the US. ”US temporary sanctions during negotiations” (falls alarm). ”We will bomb Iran” (not anyhow),… etc. While the market is still fluctuating to this kind of news flow, it is starting to take such headlines with a pinch of salt.
We’ll see. Maybe, maybe not. The Brent M1 contract is trading at $110.2/b this morning which very close to the average ticks through yesterday of $110.4/b.
Trump with bearish, verbal intervention whenever Brent trades above $110/b it seems. What seems to be a pattern is that Trump states something like ”very good negotiations going on with Iran”, ”New leaders in Iran are great,..”, ”Great progress in negotiations,…”, ”Deal in sight,..” etc whenever the Brent M1 contract trades above $110/b. An effort to cool the market. These hot air verbal interventions from Trump used to have a heavy bearish impact on prices, but they now seems to have less and less effect unless they are backed by reality.
As far as we can see there has been no real progress in the negotiations between the US and Iran with both sides still standing by their previous demands.
Iran is getting stronger while the cease fire lasts making a return to war for Trump yet harder. Iran is naturally in constant preparation for a return to war given Trump’s steady threats of bombing Iran again. Iran is naturally doing what ever is possible to prepare for a return to war. And every day the cease fire lasts it is better prepared. This naturally makes it more and more difficult and dangerous for the US to return to warring activity versus Iran as the consequences for energy infrastructure in the Persian Gulf will be more and more severe the longer the cease fire lasts. Israel seems to see it this way as well. That the war is not won and that current frozen state of a cease fire gives Iran opportunity to rebuild military and politically.
Global inventories are drawing down day by day. How much? In the meantime the Strait of Hormuz stays closed. There is varying measures and estimates of how much global inventories are drawing down. Our rough estimate, back of the envelope, is that global inventories are drawing down by at least some 10 mb/d or about 300 mb/d in a balance between loss of supply versus demand destruction. Other estimates we see are a monthly draw of 250-270 mb/d. The IEA only ’measured’ a draw in global observable stocks of 117 mb in April with oil on water rising 53 mb while on shore stocks fell 170 mb. But global stocks are hard to measure with large invisible, unmeasured stocks. As such a back of the envelope approach may be better.
Oil products is what the world is consuming. Oil product prices likely to rise while product stocks fall. Strategic Petroleum Reserves (SPR) are predominantly crude oil. Discharging oil from OECD SPR stocks, a sharp reduction in Chinese crude imports and a reduction in global refinery throughput of 6-7 mb/d has helped to keep crude oil markets satisfactorily supplied. But global inventories are drawing down none the less. And oil products is really what the world is consuming. So if global refinery throughput stays subdued, then demand will eventually have to match the supply of oil products. The likely path forward this summer is a steady draw down in jet fuel, diesel and gasoline. Higher prices for these. Then, if possible, higher refinery throughput and higher usage of crude in response to very profitable refinery margins. And lastly sharper draw in crude stocks and higher prices for these. But some 6 mb/d of oil products used to be exported through the Strait of Hormuz. And it may not be so easy to ramp up refinery activity across the world to compensate. Especially as Ukraine continues to damage Russian refineries as well as Russian crude production and export facilities.
Watch oil product stocks and prices as well as Brent calendar 2027. What to watch for this summer is thus oil product inventories falling and oil product premiums to crude rising. Another measure to watch is the Brent crude 2027 contract as it rises steadily day by day as the Strait of Hormuz stays closed and global oil inventories decline. The latter is close to the highest level since the start of the war and keeps rising.
The Brent M1 contract and the Brent 2027 prices and current price of jet fuel in Europe (ARA). All in USD/b

Our back of the envelope calculation of the global shortage created by the closure of the Strait of Hormuz. Note that 3.5 mb/d of discharge from SPR is also a draw. Note also that ’Forced demand loss’ of 2.5 mb/d is probably temporary and will fall back towards zero as logistics are sorted out leaving ’Price demand loss’ to do the job of balancing the market. Thus a shortfall of at least 9 mb/d created by the closure. More if SPR discharge is included and more if Forced demand loss recedes.

Brent is climbing higher. Front-month is at USD 106.3/bl this morning, close to a weekly high and a USD 9/bl jump from Mondays open. This is the move we flagged as a risk earlier in the week: the market shifting from ”a deal is around the corner” to ”this is going to take longer than we thought”.

Analyst Commodities, SEB
During April, rest-of-year Brent remained remarkably stable around USD 90/bl. A stability which rested on one single assumption: the SoH reopens around 1 May. That assumption is now slowly falling apart.
As we highlighted yesterday: every week of delay beyond 1 May adds (theoretically) ish USD 5/bl to the rest-of-year average, as global inventories draw 100 million barrels per week. i.e., a mid-May reopening implies rest-of-year Brent closer to USD 100/bl, and anything pushing into June or July takes us meaningfully higher.
What’s changed in the last 48 hours:
#1: The US military has formally warned that clearing suspected sea mines from SoH could take up to six months. That is a completely different timescale from what the financial market is pricing. Even a political deal tomorrow does not immediately reopen the strait.
#2: Trump has shifted his tone from urgency to ”strategic patience”. In yesterday’s press conference: ”Don’t rush me… I want a great deal.” The market is reading this as a president no longer feeling pressured by timelines, with the naval blockade running in the background.
#3: So far, the military activity is escalating, not de-escalating. Axios reports Iran is laying more mines in SoH. The US 3rd carrier strike group (USS George H.W. Bush) is arriving with two countermine vessels. Trump yesterday ordered the US Navy to destroy any Iranian boats caught laying mines. While CNN reports that the Pentagon is actively drawing up plans to strike Iranian SoH capabilities and individual Iranian military leaders if the ceasefire collapses. i.e., NOT a attitude consistent with an imminent deal!
Spot crude and product prices eased off the early-April highs on a combination of system rerouting and deal optimism. Both now weakening. Goldman estimates April Gulf output is reduced by 14.5 mbl/d, or 57% of pre-war supply, a number that keeps getting worse the longer this drags on.
Demand-side adaptation is ongoing: S. Korea has cut its Middle East crude dependence from 69% to 56% by pulling more from the Americas and Africa, and Japan is kicking off a second round of SPR releases from 1 May. But SPRs are finite.
Ref. to the negotiations, we should not bet on speed. The current Iranian leadership is dominated by genuine hardliners willing to absorb economic pain and run the clock to extract concessions. That is not a setup for a rapid resolution. US/Israeli media briefings keep framing the delay as ”internal Iranian divisions”, the reality is more complicated and points toward weeks and months, not days.
Our point is that the complexity is large, and higher prices have only just started (given a scenario where the negotiations drag out in time). The market spent April leaning on the USD 90/bl rest-of-year assumption; that case is diminishing by the hour. If ”early May reopening” is replaced by ”June, July or later” over the next week or two, both crude and products have meaningful room to reprice higher from here. There is a high risk being short energy and betting on any immediate political resolution(!).


Vattenfalls och Industrikrafts kärnkraftsbolag Videberg Kraft har valt Rolls-Royce SMR
Selling down on a ”deal”

Sommarväder skapar prisrally på elbörsen
Oil product price pain is set to rise as the Strait of Hormuz stays closed into summer

Solkraften pressar elpriserna dagtid
Oil product price pain is set to rise as the Strait of Hormuz stays closed into summer
Sommarväder skapar prisrally på elbörsen
Vattenfalls och Industrikrafts kärnkraftsbolag Videberg Kraft har valt Rolls-Royce SMR
Selling down on a ”deal”
-
Analys4 veckor sedan
Oil product price pain is set to rise as the Strait of Hormuz stays closed into summer
-
Nyheter2 veckor sedan
Sommarväder skapar prisrally på elbörsen
-
 Nyheter2 dagar sedan
Vattenfalls och Industrikrafts kärnkraftsbolag Videberg Kraft har valt Rolls-Royce SMR
-
Analys2 dagar sedan
Selling down on a ”deal”