

Analys
SEB Jordbruksprodukter, 8 december 2014


 Vetepriset steg med 3% i Chicago under stigande dollarkurs och med 2% i för de korta kontrakten i Paris .Den dämpade prisutvecklingen i Paris har troligen sin förklaring i att franskt vete inte var billigast i veckans GASC.
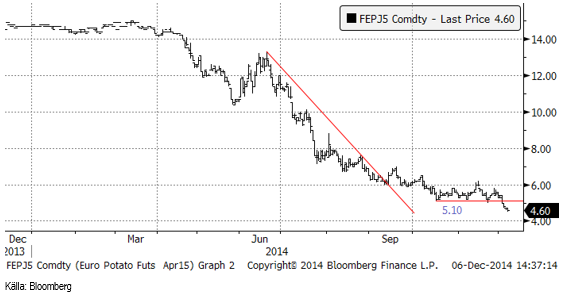
Potatispriset i Frankfurt (snart Leipzig – handeln flyttar i maj) föll med 15%. Historiskt har december varit en stark månad och sedan har det gått utför. Mjölkprodukterna handlades någon procent lägre i Frankfurt, men föll med 10% i USA. På Global Dairy Trade i tisdags noterades lägre pris generellt, men på produkterna endast på WMP. Resten steg i pris, vilket de till slut som nämnt ovan inte gjorde på EUREX.
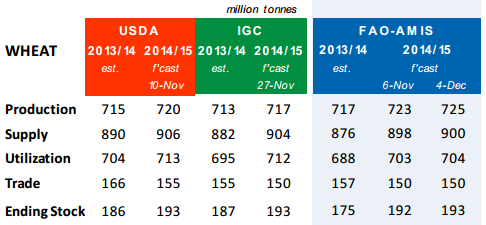
Årets sista WASDE-rapport kommer i veckan. Reuters har sammanställt analytikernas förväntningar på globala utgående lager till i genomsnitt 191.75 mt för vete (192.90 i novemberrapporten), 191.42 mt för majs (191.50 i november) och 89.70 mt för sojabönor (90.28 i november).
Odlingsväder
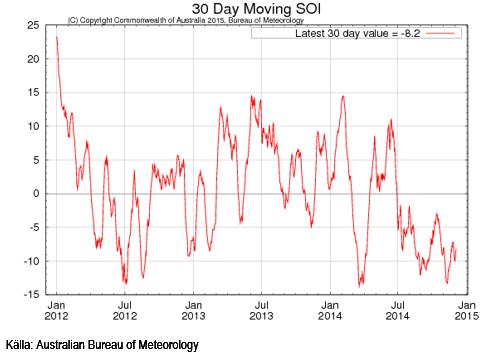
Southern Oscillation Index har sedan förra veckan sjunkit från -7.3 till -8.2. Ett SOI under -8 kan indikera ett El Niño. I diagrammet nedan ser vi ett 30-dagars glidande medelvärde av SOI.
USA.s Climate Prediction Center sade i veckan att det är 65% chans att ett El Niño uppstår under vintern eller våren på norra halvklotet.
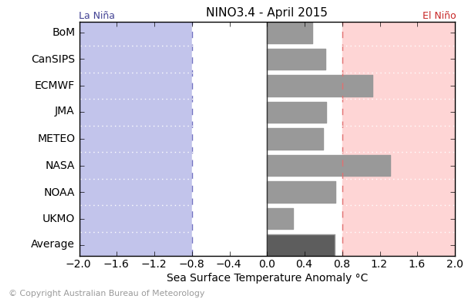
En sammanställning av ensembleprognoser som publiceras på Australian Bureau of Meteorologys hemsida visar att den genomsnittliga prognosen indikerar El Niño för december, men inte riktigt för februari och april. För april är det bara ECMWF och NASA som förutspår ett El Niño, men alla ligger åt det hållet.
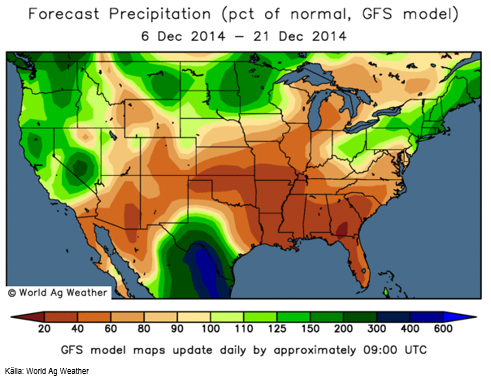
I USA blir det torrare än normalt i Mellanvästern, i Södern och i Sydväst. I Norra Mexico blir det däremot blötare än normalt.
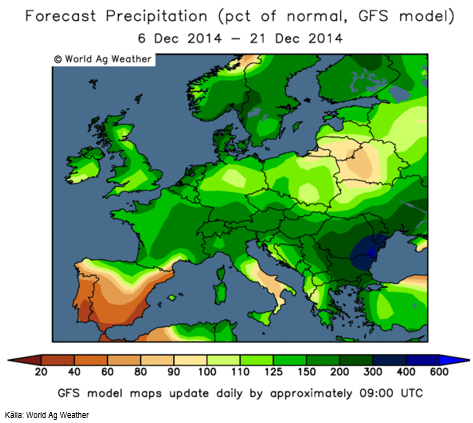
De kommande två veckorna blir samlad nederbörd över det normala i hela Europa, utom i södra Spanien och Portugal. Det är en mycket blötare prognos än vi såg förra veckan.
Även Ryssland kommer att få mer nederbörd än normalt och där faller det som snö. Ukraina får ännu mer regn än Ryssland.
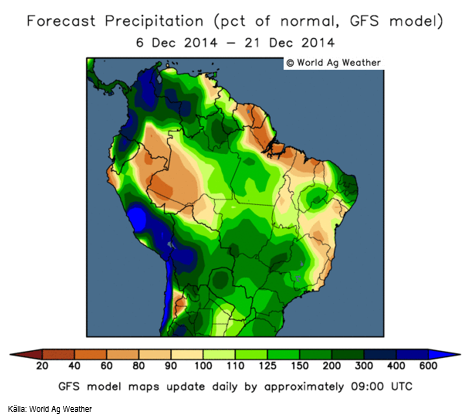
Nederbörden i Brasilien fortsätter att vara rikligare än normalt även den kommande tvåveckorsperioden. Även Argentina fortsätter att få riktlig nederbörd.
Australiens prognos är även denna vecka nederbördsrik i öster och torr i väster.
Vete
Risken för utvintring av Rysslands höstvete, som var det tema som drev priset på vete uppåt, är nu redan diskonterat av marknaden och blickarna har vänts mot andra nyheter. Det rapporteras från Ryssland att det ligger snö över de flesta åkrar. Crop condition har nu slutat rapporteras för det amerikanska vetet som gått in i vintervilan. De andra nyheterna har inte varit positiva för vetepriset.
Dit hör t ex att Ukrainas jordbruksdepartement i veckan sade i att 7.5 mHa höstvete blev sått och att 72% av det är i bra eller tillfredsställande skick.
Dit hör också den senaste GASC-tendern. Egyptens GASC köpte 175,000 ton vete i veckan som gick. Resultaten kom ut i onsdags och när det visade sig att det inte var franskt vete som var billigast den här gången, föll Matifs terminer omedelbart med 3 euro. GASC-tendern gick till Rumänien med 120,000 ton för 260 dollar FOB och Ukraina med 55,000 ton till 257.50 dollar FOB. Priserna motsvarar 210 respektive 208.50 euro per ton.
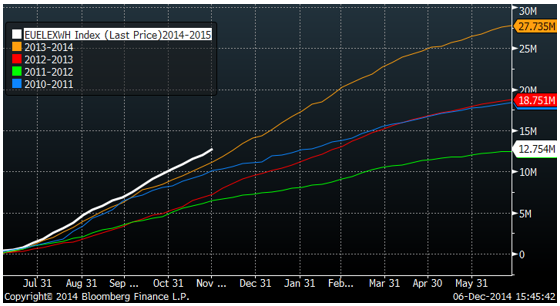
EU gav exportlicens för 729,000 ton vete i veckan. Hittills i år ligger exporten en bra bit över förra årets 12.75 mt jämfört med 11.5 för samma vecka förra året. Fortsätter EU att exportera vete i den här takten kommer den att nå ca 32 mt fram till sista juni, eller ca 5 mt mer än förra året. USDA estimerade i november (och oktober) att exporten ska bli 28 mt, dvs ungefär lika hög som förra året. Det verkar nu ganska klart att exporten alltså kommer att bli högre. Det ska bli intressant att se att om USDA ändrar exportestimatet för EU i den WASDE-rapport som kommer i veckan.
Nedan ser vi en bild på exportlicenserna för vete som givit av Bryssel.
Det finns mycket vete lagrat på gårdarna i Europa i förhoppningen om högre pris. Tidigare år när det har lagrats in mycket vete har synen på lagringsidén varit annorlunda på Nyårsdagen än den varit före Julhelgen. Kanske har då blicken flyttat över till den kommande skörden, medan den gamla skördens öde förlorat det mesta av sin tidigare betydelse. Efter den prisuppgång som varit sedan slutet av september är priset också ganska attraktivt nu. Gissningsvis kommer en hel del vete att komma ut på marknaden den kommande månaden.
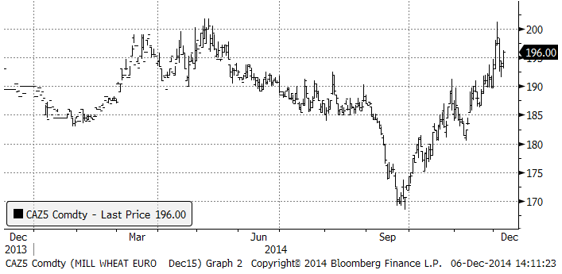
Matifs termin för december 2015 handlas i 196 euro per ton, motsvarande 1819 kr per ton. Detta är både i ett historiskt perspektiv och mot bakgrund av årets prisnivå, ett attraktivt pris att terminssäkra nästa års skörd till. Ännu bättre är förmodligen att göra detta via Chicagos veteterminer, som generellt sett alltid handlas på en lägre nivå, men som också uppvisar ett stort contango på 7% på årsbasis. Priset där är drygt 1700 kr / ton och det skall alltså ses mot bakgrund av att prisnivån generellt är lägre.
Statistics Canada estimerade skörden i landet till 29.3 mt, som är 1.8 mt mer än de trodde i oktober och mer än marknaden förväntade sig. Med ett ganska stort ingående lager innebär det att exporten den här säsongen kan bli (nästan) lika stor som förra årets 23 mt.
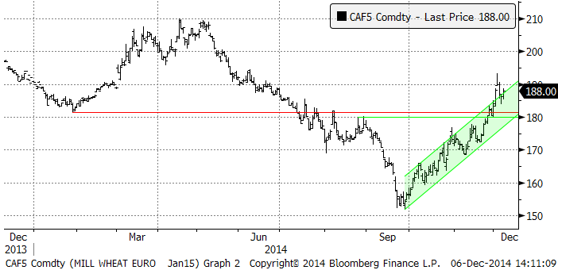
Nedan ser vi utvecklingen på januarikontraktet på Matif.
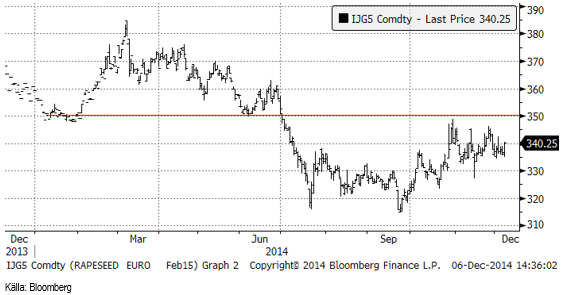
Nedan ser vi prisutvecklingen på nästa års decemberkontrakt på Matif (de har bytt från november till december som förfallomånad).
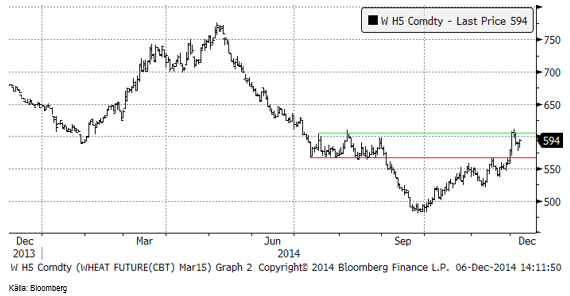
Chicagovetet (mars) stötte på motstånd vid 600 cent, liksom under sensommaren. Ett nytt försök att gå högre kanske inträffar i veckan som kommer. Priset stängde på 594 cent i fredags.
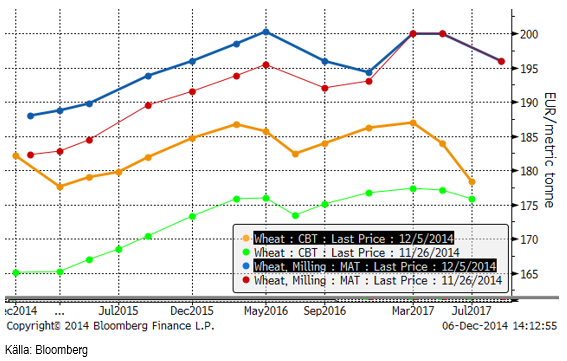
Nedan ser vi terminskurvorna i fredags och en vecka tidigare för Matif respektive Chicago. Det är contango på båda marknader.
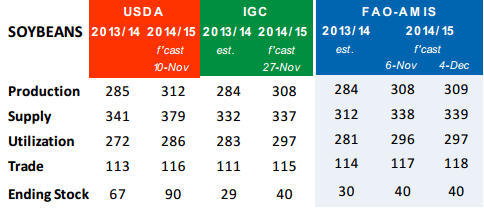
FAO / AMIS rapporterade i torsdags den 4 december. De höjde produktionsestimatet från 723 mt till 725 mt hänförligt till EU och Ryssland och höjde också utgående lager med 1 mt (huvudsakligen i Ryssland +3.3 mt och i Kina +3 mt).
Vi behåller neutral rekommendation på vetet.
Majs
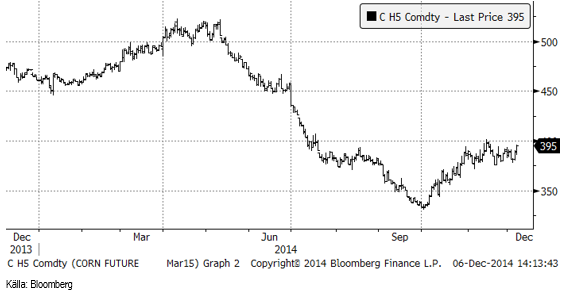
Marskontraket CH4 har gått upp från 385 cent till fredagens 395 cent. Uppgången kom i torsdags efter att USDA sagt att exporten av majs varit större än förväntat.
Mato Grosso i Brasilien, som är den delstat där majs odlas mest som andragröda efter sojabönor, väntas enligt den första officiella prognosen producera 14.5 mt, jämfört med 17.7 mt förra året. Det beror på att arealen är 12% mindre än förra året. Detta kommer att slå direkt mot exportvolymen.
Etanolproduktionen föll tillbaka något i veckan, från förra veckans rekordnivå.
Man tänker intuitivt att ett lägre oljepris och därmed ett lägre etanolpris ska leda till lägre pris på majs, men det är inte alls säkert. I USA är det krav på att bensin ska innehålla 10% etanol. Ett lägre bensinpris innebär åtminstone så småningom en högre efterfrågan på bensin och därmed också en högre efterfrågan på etanol – och majs. För priset på majs i USA, där nästan hälften av all majs redan används till etanoltillverkning, kan detta innebära att priset på majs går upp, inte ner.
Motsvarande mekanism finns inte för biodiesel. I EU går det mesta av rapsoljan till biodiesel.
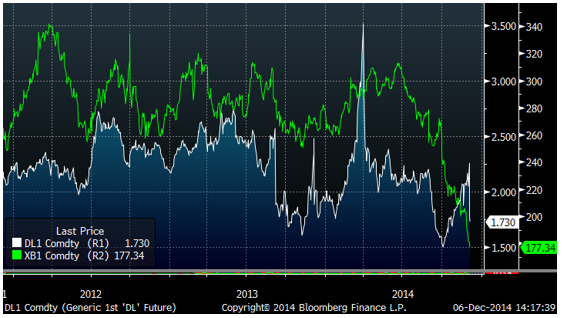
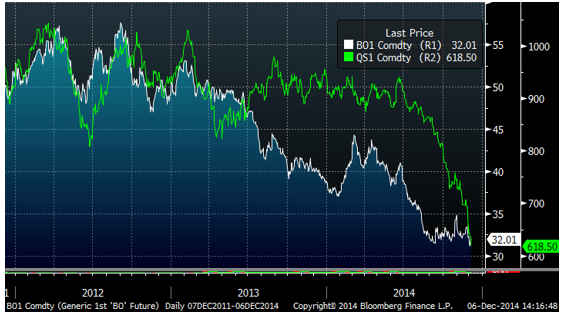
Nedan ser vi ett diagram över priset på etanol (vit kurva) och bensin utan etanol som grön kurva. Vi ser att etanolpriset visserligen fallit lite i veckan, men i stort sett inte följt med bensinpriset ner under hösten.
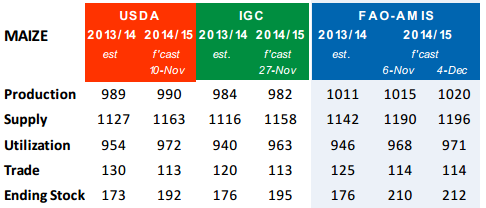
FAO / AMIS höjde produktionsestimatet med 5 mt till 1020 mt, hänförligt till Kina (+2.2 mt) och Mexiko (+1.5 mt). För USA gjorde de en sänkning med 1.7 mt. Utgående lager höjs med 2 mt. De noterar särskilt att utgående lager i USA ökar med 19.5 mt från förra året.
Vi fortsätter med neutral rekommendation på majs.
Sojabönor
Sojabönorna (SF5) föll inte, som många tekniska analytiker väntat sig. Priset vände upp kraftigt i fredags, förmodligen med stöd av tekniskt orienterade handlare som köpte tillbaka sålda terminer. Det är dock ännu för tidigt att säga att huvud-skuldra-formationen är historia. Man ser ibland sådana formationer som har flera ”skuldror”.
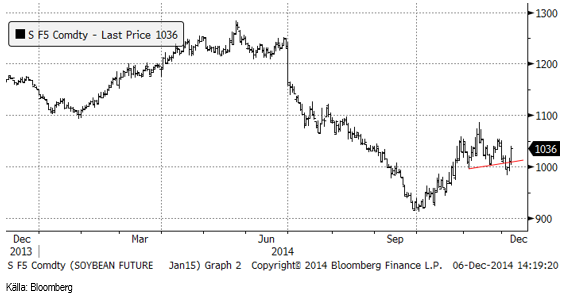
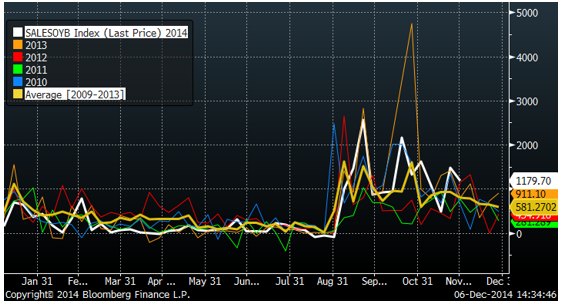
Exporten av sojabönor var fortsatt hög, 1.18 mt, men inte så hög som veckan innan.
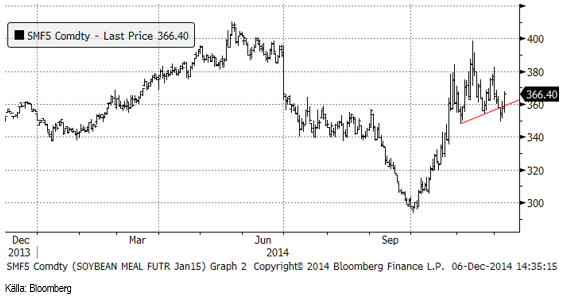
Sojamjölet uppvisar samma mönster, alltså en potentiell ”huvud-skuldra formation”, som sojabönorna – och på samma sätt kan det handla om en ”falsk” sådan.
Sojaoljan föll under 32 cent som är en teknisk stödnivå. Mot slutet av veckan rekylerade priset upp mot 32 cent igen, vilket erbjuder ett bra säljtillfälle.
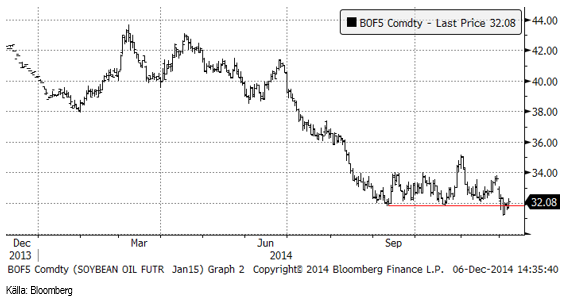
Som vi har berört ovan, finns ingen mekanism liknande den för etanol, som skyddar biodieselråvaran mot prisfall i råolja. Råoljan har fallit kraftigt i pris den senaste tiden. Sojaoljan har varit i fallande pristrend längre, men det senaste fallet i råoljan borde ge ny fart nedåt i sojaoljan.
FAO / AMIS höjer global produktion av sojabönor med 1 mt, hänförligt till högre hektarskörd i USA. De lämnar dock utgående lager oförändrat på 40 mt.
Vi fortsätter med säljrekommendation på sojabönor.
Raps
Februarikontraktet på rapsfrö steg med 3 euro under veckan till 340 euro.
Statistics Canada rapporterade att skörden av canola uppgick till 15.6 mt, vilket var mycket högre än det tidigare estimatet på 14.1 mt. Ingen i branschen hade väntat sig den stora skörden. Exporten av canola kommer därför förmodligen att vara ännu större än förra året, när skörden var förbluffande stor. Med tanke på att året började med snö och is som fördröjde sådden, var det väl ingen som trodde att skörden skulle kunna bli 13% större än redordskörden förra året.
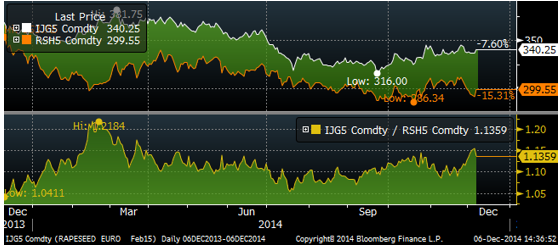
Nedan ser vi skillnaden mellan canolaterminen (mars) och februari dito för rapsfrö, båda i euro per ton. Rapsfröet har stigit i pris i förhållande till canola och handlas 13.6% över canolan. Det finns potential för rapsfröet att gå ner lite i pris.
Dollarn har stärkts kraftigt mot Euron i veckan och det slutade med hausse i dollarn på fredagen efter att sysselsättningsstatistiken i USA publicerats. Dollarns styrka har bidragit till att priset på rapsfrö (i euro) inte fallit såsom den annars skulle ha gjort.
Vi fortsätter med neutral rekommendation på raps.
Potatis
Potatisterminen bröt stödet på 5.10 cent och eftersom vi också befinner oss i december, som tidigare år varit den säsongsmässig topp, innan priset fortsätter nedåt de år som haft en stor produktion, är det nog bäst att gå ur köpta positioner på potatis. Vi rekommenderar neutral position.
Gris
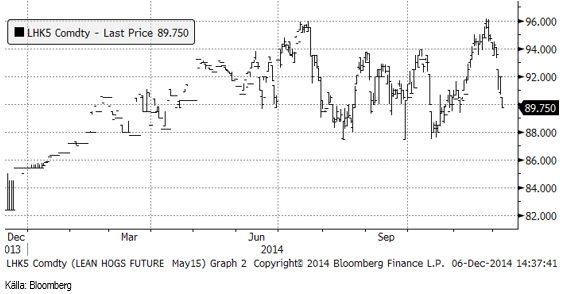
Lean hogs majkontrakt föll kraftigt i veckan. Efter att ha handlats på 96 cent i november har priset fallit ner till 89.75 cent. Det finns ganska stor fallhöjd i det amerikanska grispriset.
Mjölk
I tisdags var det återigen en Global Dairy Trade-auktion, med ännu lägre genomsnittligt pris. Det genomsnittliga priset föll med 1.1%. WMP sjönk med 7.1%, men det var den enda produkten som noterade lägre pris. Smör steg med 7.3% och SMP med 5.7%. Ostpriset steg också med 5.2%.
På EUREX har dock de lite längre terminerna på SMP handlats ner med 3% i veckan, medan smörpriset har handlats upp med 1%. En korg av dem som motsvarar mjölkråvara har gått ner med 1% i veckan till 2.79 Kr / Kg.
När vi frågar mjölkbönder vid vilken nivå de tror att de skulle vilja sälja terminer på mjölk verkar ”3.60 Kr / Kg” vara ett riktmärke.
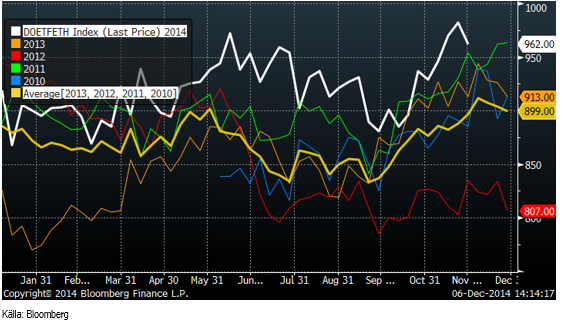
I diagrammet nedan ser vi uppgången i SMP-noteringen på Fonterra-auktionen (grön linje). Notera också att priset på SMP i USA (rosa linje) gått lika mycket nedåt. Priserna på EUREX smör och SMP ser fortfarande ut att vara i stabilt fallande pristrend.
Blå kurva är visar dock liksom Fonterras SMP-noteringen en uppgång i december. Det är den första uppgången i WMP-noteringen sedan början på året, vilket i och för sig kan bero på att den föll mer än vanligt i november.
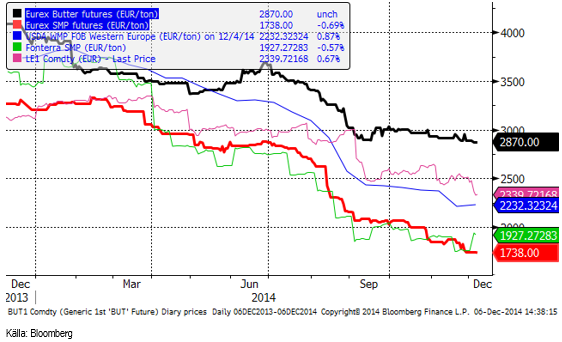
Botten är inte nådd än.
Socker
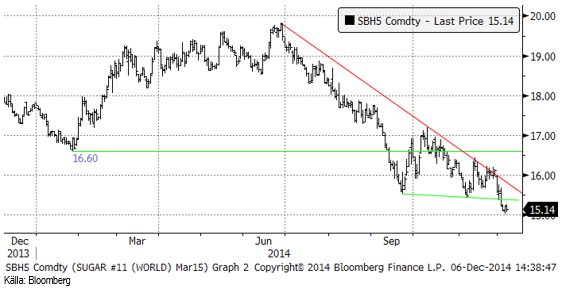
Priset marskontraktet på NYBOT föll under den tekniska stödnivån och nådde ner till 15 cent där priset fann stöd. Tekniskt är trenden nedåtriktad och ur det perspektivet skulle priset gissningsvis fortsätta ner.
Kingsman sänkte estimatet för underskottet på socker med 60% till 600,000 ton. I oktober estimerade Kingsman underskottet till 1.66 mt. De hänvisar till högre produktion i Indien. Enligt Kingsman har det lägre priset på socker ännu inte påverkat produktionen i världen, utom i Mexiko och i södra Brasilien, där det inte investerats på flera år, enligt Kingsman.
Vi behåller neutral rekommendation.
För ytterligare jordbruksanalyser, se SEBs andra analysbrev.
[box]SEB Veckobrev Jordbruksprodukter är producerat av SEB Commodities Sales desk och publiceras i samarbete och med tillstånd på Råvarumarknaden.se[/box]
Detta marknadsföringsmaterial, framtaget av SEB’s Commodities Sales desk, har upprättats enbart i informationssyfte.
Även om innehållet är baserat på källor som SEB bedömt som tillförlitliga ansvarar SEB inte för fel eller brister i informationen. Den utgör inte oberoende, objektiv investeringsanalys och skyddas därför inte av de bestämmelser som SEB har infört för att förebygga potentiella intressekonflikter. Yttranden från SEB’s Commodities Sales desk kan vara oförenliga med tidigare publicerat material från SEB, då den senare hänvisas uppmanas du att läsa den fullständiga rapporten innan någon åtgärd vidtas.
Dokumentationen utgör inte någon investeringsrådgivning och tillhandahålls till dig utan hänsyn till dina investeringsmål. Du uppmanas att självständigt bedöma och komplettera uppgifterna i denna dokumentation och att basera dina investeringsbeslut på material som bedöms erforderligt. Alla framåtblickande uttalanden, åsikter och förväntningar är föremål för risker, osäkerheter och andra faktorer och kan orsaka att det faktiska resultatet avviker väsentligt från det förväntade. Historisk avkastning är ingen garanti för framtida resultat. Detta dokument utgör inte ett erbjudande att teckna några värdepapper eller andra finansiella instrument. SEB svarar inte för förlust eller skada – direkt eller indirekt, eller av vad slag det vara må – som kan uppkomma till följd av användandet av detta material eller dess innehåll.
Observera att det kan förekomma att SEB, dess ledamöter, dess anställda eller dess moder- och/eller dotterbolag vid olika tillfällen innehar, har innehaft eller kommer att inneha aktier, positioner, rådgivningsuppdrag i samband med corporate finance-transaktioner, investment- eller merchantbankinguppdrag och/eller lån i de bolag/finansiella instrument som nämns i materialet.
Materialet är avsett för mottagaren, all spridning, distribuering mångfaldigande eller annan användning av detta meddelande får inte ske utan SEB:s medgivande. Oaktat detta får SEB tillåta omfördelning av materialet till utvald tredje part i enlighet med gällande avtal. Materialet får inte spridas till fysiska eller juridiska personer som är medborgare eller har hemvist i ett land där sådan spridning är otillåten enligt tillämplig lag eller annan bestämmelse.
Skandinaviska Enskilda Banken AB (publ) är ett [publikt] aktiebolag och står under tillsyn av Finansinspektionen samt de lokala finansiella tillsynsmyndigheter i varje jurisdiktionen där SEB har filial eller dotterbolag.

Selling down on a ”deal”. Brent crude fell 6.2% last week with accelerated weakness towards the end of the week. Close of the week at $87.33/b and low of the week (and on Friday) of $85.8/b. Brent is falling another 4% this morning to $83.7/b on confirmation by Iran that a MoU text has been reached and that it will be signed on Friday this week.

So what is this ”deal” worth? Talk on the desk here this morning is that it is much like ”putting lipstick on a pig” where Trump has to sell this at home as a victory where ”the SoH has reopened”, the nuclear issue will be ironed out over the coming 60 days (or maybe 600 days?) and US consumers are getting a lower gasoline price and maybe US republicans survives the midterm elections.
The importance for Iran is that it emerges as the defacto winner of this war in the eyes of the non-US public world. That Iran now onwards is the ”ruler of the SoH” (combo of geography and new weapons systems like drones) or more softer: ”the guarantor of safe passage through the SoH”.
Iran doesn’t need nuclear weapons any more. Nuclear deterrence doesn’t work any more. Ukraine has made many attacks deep into Russia without being nuked in return. Plenty of Iranian ballistic rockets blasts over Israel but Iran wasn’t nuked in return.
There is no trust between the US and Iran. We don’t know all the details yet of the MoU. But what we do know is that there is no trust between the US and Iran what so ever. This is probably more like a descriptive text on how they can cooperate in a way where both sides keeps tactical leverage. Neither side makes irreversible concessions. Violations can be punished quickly. Cooperation produces immediate benefits.
This is a fragile structure. It can easily break down. There may be details which cannot be overcome. To be seen on Friday. The US has to show that it is willing put enough force behind managing and restraining Israel versus Hezbollah in Lebanon. We have seen that Netanyahu hasn’t listened all that much to Trump’s directives and wishes. This could be a major obstacle.
A gradual reopening is tactically preferable for Iran. A tactical leverage for Iran right now is that global oil stocks have been drawn down towards painful and increasingly dangerous levels with increasing risks for oil price spikes in mid-July to August. This together with US midterm elections on 3 November gives tactical leverage to Iran. Iran probably doesn’t want to fully give up on that leverage. A rapid, full reopening where global stocks are able to refill over the coming 60 days will significantly erode that leverage. If Iran reinstates a closure of the SoH after 60 days (if talks break down again), then the effect won’t be that impactful in terms of prices and the US midterm elections.
So a gradual and partial reopening where global markets gets the oil they need while they are unable to rebuild stocks could be a practical middle way for both parties. Trump can sell it as ”the SoH has reopened” and get affordable gasoline for US consumers. Iran can sell it as ”the SoH has fully reopened, but there is some friction” so flow is only 60-80% of normal.
Not much real demand destruction below $100/b. What we do know is that there is not much real price pain demand destruction for oil globally at an oil price below $100/b. A lot of demand-shock destruction. Fear. But demand should now come roaring back towards normal with fear for exceptionally high prices now is rapidly receding.
Sudden China demand destruction due to EVs? Bullocks. EV share of total Chinese carpool now around 13%. Share of new sales of EVs has reached 50%. This is a very gradual process. It doesn’t make oil demand fall like a rock over night. When EV new sales share reaches 100%, then the gasoline car pool will contract by some 5-10% per year. But that is only gasoline. Sudden reduction in Chinese oil demand is more about shock and risk.
Chinese crude oil imports will come roaring back. At what price? Today’s ”neutral” oil price is $70/b. That is the five year price which has steadily traded around the $70/b mark over the past 3-4 years. With still a risky picture one would think that China and the rest of the world will be big buyers of oil in the range of $70-85/b.
Global demand will likely snap back towards normal, forecasted demand and growth at such prices.
Physical reopening is a gradual process. The physical and practical reopening of the SoH will likely be gradual rather than sudden. And that probably suites Iran tactically as well.
Brent M1 price versus the Brent 5-yr (today’s ”normal” price)

Market is starting to take US/Iran headlines with a pinch of salt. Brent crude rose $2.8/b yesterday to an official close of $112.1/b. But after that it traded as low as $108.05/b before ending late night at around $109.7/b. Through the day it traded in a range of $106.87 – 112.72/b amid a flurry of news or rumors from Iran and the US. ”US temporary sanctions during negotiations” (falls alarm). ”We will bomb Iran” (not anyhow),… etc. While the market is still fluctuating to this kind of news flow, it is starting to take such headlines with a pinch of salt.
We’ll see. Maybe, maybe not. The Brent M1 contract is trading at $110.2/b this morning which very close to the average ticks through yesterday of $110.4/b.
Trump with bearish, verbal intervention whenever Brent trades above $110/b it seems. What seems to be a pattern is that Trump states something like ”very good negotiations going on with Iran”, ”New leaders in Iran are great,..”, ”Great progress in negotiations,…”, ”Deal in sight,..” etc whenever the Brent M1 contract trades above $110/b. An effort to cool the market. These hot air verbal interventions from Trump used to have a heavy bearish impact on prices, but they now seems to have less and less effect unless they are backed by reality.
As far as we can see there has been no real progress in the negotiations between the US and Iran with both sides still standing by their previous demands.
Iran is getting stronger while the cease fire lasts making a return to war for Trump yet harder. Iran is naturally in constant preparation for a return to war given Trump’s steady threats of bombing Iran again. Iran is naturally doing what ever is possible to prepare for a return to war. And every day the cease fire lasts it is better prepared. This naturally makes it more and more difficult and dangerous for the US to return to warring activity versus Iran as the consequences for energy infrastructure in the Persian Gulf will be more and more severe the longer the cease fire lasts. Israel seems to see it this way as well. That the war is not won and that current frozen state of a cease fire gives Iran opportunity to rebuild military and politically.
Global inventories are drawing down day by day. How much? In the meantime the Strait of Hormuz stays closed. There is varying measures and estimates of how much global inventories are drawing down. Our rough estimate, back of the envelope, is that global inventories are drawing down by at least some 10 mb/d or about 300 mb/d in a balance between loss of supply versus demand destruction. Other estimates we see are a monthly draw of 250-270 mb/d. The IEA only ’measured’ a draw in global observable stocks of 117 mb in April with oil on water rising 53 mb while on shore stocks fell 170 mb. But global stocks are hard to measure with large invisible, unmeasured stocks. As such a back of the envelope approach may be better.
Oil products is what the world is consuming. Oil product prices likely to rise while product stocks fall. Strategic Petroleum Reserves (SPR) are predominantly crude oil. Discharging oil from OECD SPR stocks, a sharp reduction in Chinese crude imports and a reduction in global refinery throughput of 6-7 mb/d has helped to keep crude oil markets satisfactorily supplied. But global inventories are drawing down none the less. And oil products is really what the world is consuming. So if global refinery throughput stays subdued, then demand will eventually have to match the supply of oil products. The likely path forward this summer is a steady draw down in jet fuel, diesel and gasoline. Higher prices for these. Then, if possible, higher refinery throughput and higher usage of crude in response to very profitable refinery margins. And lastly sharper draw in crude stocks and higher prices for these. But some 6 mb/d of oil products used to be exported through the Strait of Hormuz. And it may not be so easy to ramp up refinery activity across the world to compensate. Especially as Ukraine continues to damage Russian refineries as well as Russian crude production and export facilities.
Watch oil product stocks and prices as well as Brent calendar 2027. What to watch for this summer is thus oil product inventories falling and oil product premiums to crude rising. Another measure to watch is the Brent crude 2027 contract as it rises steadily day by day as the Strait of Hormuz stays closed and global oil inventories decline. The latter is close to the highest level since the start of the war and keeps rising.
The Brent M1 contract and the Brent 2027 prices and current price of jet fuel in Europe (ARA). All in USD/b

Our back of the envelope calculation of the global shortage created by the closure of the Strait of Hormuz. Note that 3.5 mb/d of discharge from SPR is also a draw. Note also that ’Forced demand loss’ of 2.5 mb/d is probably temporary and will fall back towards zero as logistics are sorted out leaving ’Price demand loss’ to do the job of balancing the market. Thus a shortfall of at least 9 mb/d created by the closure. More if SPR discharge is included and more if Forced demand loss recedes.

Brent is climbing higher. Front-month is at USD 106.3/bl this morning, close to a weekly high and a USD 9/bl jump from Mondays open. This is the move we flagged as a risk earlier in the week: the market shifting from ”a deal is around the corner” to ”this is going to take longer than we thought”.

Analyst Commodities, SEB
During April, rest-of-year Brent remained remarkably stable around USD 90/bl. A stability which rested on one single assumption: the SoH reopens around 1 May. That assumption is now slowly falling apart.
As we highlighted yesterday: every week of delay beyond 1 May adds (theoretically) ish USD 5/bl to the rest-of-year average, as global inventories draw 100 million barrels per week. i.e., a mid-May reopening implies rest-of-year Brent closer to USD 100/bl, and anything pushing into June or July takes us meaningfully higher.
What’s changed in the last 48 hours:
#1: The US military has formally warned that clearing suspected sea mines from SoH could take up to six months. That is a completely different timescale from what the financial market is pricing. Even a political deal tomorrow does not immediately reopen the strait.
#2: Trump has shifted his tone from urgency to ”strategic patience”. In yesterday’s press conference: ”Don’t rush me… I want a great deal.” The market is reading this as a president no longer feeling pressured by timelines, with the naval blockade running in the background.
#3: So far, the military activity is escalating, not de-escalating. Axios reports Iran is laying more mines in SoH. The US 3rd carrier strike group (USS George H.W. Bush) is arriving with two countermine vessels. Trump yesterday ordered the US Navy to destroy any Iranian boats caught laying mines. While CNN reports that the Pentagon is actively drawing up plans to strike Iranian SoH capabilities and individual Iranian military leaders if the ceasefire collapses. i.e., NOT a attitude consistent with an imminent deal!
Spot crude and product prices eased off the early-April highs on a combination of system rerouting and deal optimism. Both now weakening. Goldman estimates April Gulf output is reduced by 14.5 mbl/d, or 57% of pre-war supply, a number that keeps getting worse the longer this drags on.
Demand-side adaptation is ongoing: S. Korea has cut its Middle East crude dependence from 69% to 56% by pulling more from the Americas and Africa, and Japan is kicking off a second round of SPR releases from 1 May. But SPRs are finite.
Ref. to the negotiations, we should not bet on speed. The current Iranian leadership is dominated by genuine hardliners willing to absorb economic pain and run the clock to extract concessions. That is not a setup for a rapid resolution. US/Israeli media briefings keep framing the delay as ”internal Iranian divisions”, the reality is more complicated and points toward weeks and months, not days.
Our point is that the complexity is large, and higher prices have only just started (given a scenario where the negotiations drag out in time). The market spent April leaning on the USD 90/bl rest-of-year assumption; that case is diminishing by the hour. If ”early May reopening” is replaced by ”June, July or later” over the next week or two, both crude and products have meaningful room to reprice higher from here. There is a high risk being short energy and betting on any immediate political resolution(!).


Vattenfalls och Industrikrafts kärnkraftsbolag Videberg Kraft har valt Rolls-Royce SMR
Selling down on a ”deal”

Sommarväder skapar prisrally på elbörsen
Oil product price pain is set to rise as the Strait of Hormuz stays closed into summer

Solkraften pressar elpriserna dagtid
Oil product price pain is set to rise as the Strait of Hormuz stays closed into summer
Sommarväder skapar prisrally på elbörsen
Vattenfalls och Industrikrafts kärnkraftsbolag Videberg Kraft har valt Rolls-Royce SMR
Selling down on a ”deal”
-
Analys4 veckor sedan
Oil product price pain is set to rise as the Strait of Hormuz stays closed into summer
-
Nyheter2 veckor sedan
Sommarväder skapar prisrally på elbörsen
-
 Nyheter2 dagar sedan
Vattenfalls och Industrikrafts kärnkraftsbolag Videberg Kraft har valt Rolls-Royce SMR
-
Analys3 dagar sedan
Selling down on a ”deal”