

Analys
SEB – Råvarukommentarer, 30 september 2013

Rekommendationer
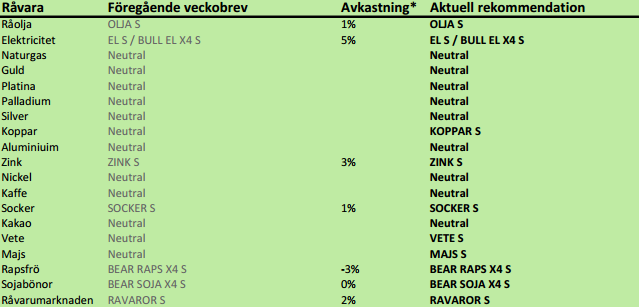
*) Avkastningen anges för 1:1 certifikaten där både BULL och 1:1 certifikat är angivna.
Inledning
Elpriset har fortsatt att stiga och BULL EL X4 S belönade dem som köpt med 17% ytterligare avkastning. Den har stigit med 35% den senaste månaden. Ett högre elpris är fortsatt vår främsta rekommendation. Rekyler ska betraktas som köptillfällen.
Vi anser att vi har tidiga tecken på en vändning uppåt i pristrenden för vete och majs. Därför byter vi rekommendation från neutral till köp på dessa. För oljeväxter har vi fortfarande säljrekommendation. Den tekniska analysen av sojamarknaden indikerar ett nytt stort prisfall från fredagens 1319 till 1250 cent per bushel.
Den sista september är det dags att ta emot lagerstatistiken från USDA: hur stora lagren av spannmål och oljeväxter som fanns i USA den 1 september.
Estimaten hos marknaden är som följer:
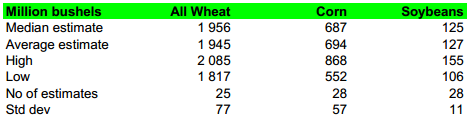
Statistiken publiceras klockan 18:00 svensk tid.
Vi går också över till köprekommendation på koppar och certfikatet KOPPAR S.
Det är den så kallade Golden Week i Kina den här veckan, vilket innebär att affärslivet går på sparlåga där hela veckan
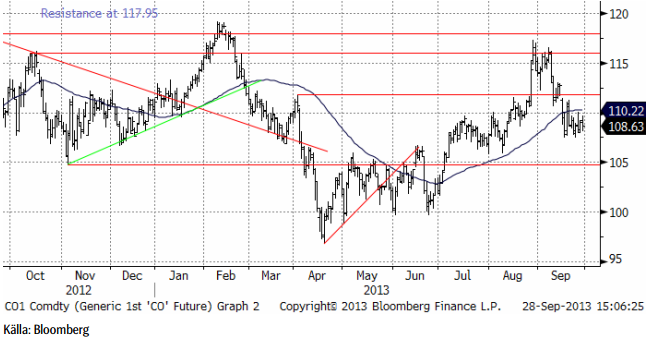
Råolja – Brent
Oljepriset backade med 1% förra veckan. Vi tror det finns risk för ytterligare svaghet i prisutvecklingen.
Terminskurvan för Brent ligger något lägre än förra veckan. Det som annars är så påfallande är rabatten på terminerna i förhållande till spotpriset.
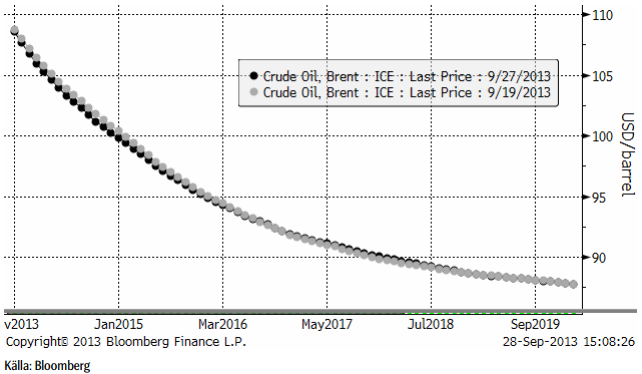
När nu priset fallit tillbaka och rabatten på terminer är så attraktiv, tycker vi att det är ett bra tillfälle att komma in i den lönsamma oljemarknaden och rekommenderar köp av OLJA S. Det är framförallt rabatten på terminerna vi vill komma åt och därför föredrar vi OLJA S framför t ex BULL OLJA X4 S.
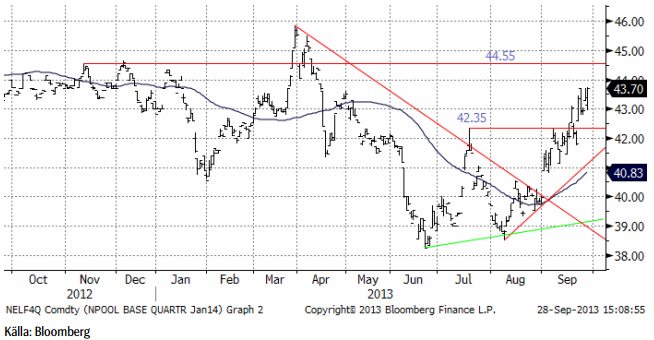
Elektricitet
Elpriset har fortsatt upp, vilket har fört med sig att vår rekommendation av EL S gett 5% den senaste veckan och BULL EL X4 S har gett 17% i avkastning. Vi ser att vi närmar oss ett tekniskt motstånd på 44.55 euro per MWh. Trots vad vi skriver nedan, tror vi det kan finnas anledning att tro att det kan komma en rekyl nedåt. Detta är ett utmärkt tillfälle att komma in i marknaden på. Den här haussen drivs av långsiktiga förändringar i marknaden för kol och energi, som varit fallande i tre år och nu vänt upp igen.
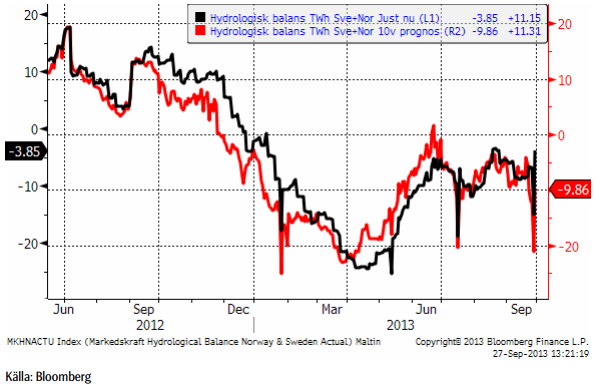
Markedskraft har under hela uppgången haft en säljrekommendation till sina kunder. Och man kan inte heller se någon anledning för dem att tro på en prisuppgång när man ser på deras prognos för hydrologisk balans, som vi ser nedan.
Vi har, som bekant fokuserat på det nedtryckta priset på kol och på att en normalisering av den marknaden har inletts. Ser vi däremot till väderleksprognoser har de inte gett mycket att hålla i. SMHI:s modeller har fladdrat fram och tillbaka mellan blött och torrt den senaste tiden. Den senaste prognosen från i fredags visar på blötare väder. Samtidigt skriver de att det troligaste är ”nog” att det fortsätter som förut. Vi väljer att inte tro på modellerna, utan på vad meteorologerna skriver, alltså håller vi fast vid något torrare väder.
Vad som stödjer detta är beteendet hos den Nordatlantiska Oscillationen / North Atlantic Oscillation (NAO) som har har gått in (djupt) i negativ fas.
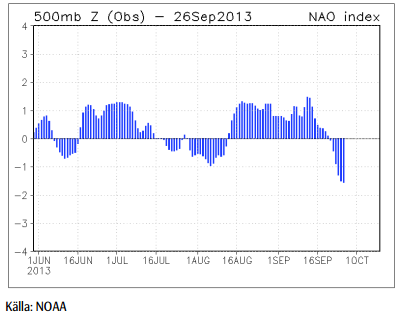
NAO i negativ fas innebär att kall ishavsluft tränger söderut och trycker undan de normala vädervindarna, som normalt bär med sig blöt luft från sydvästra Europa, dvs britiska öarna. När NAO är i negativ fas, tvingas denna ström gå söderöver, dvs över Frankrike. En molnfri, knaster-kall vinterdag, där röken från skorstenarna går rakt upp i torr och vindstilla luft, är det typiska vädret vid NAO i negativ fas. Det är en dag när förbrukningen av el är hög och vindkraften står still och ingen nederbörd fyller på den hydrologiska balansen. Det brukar hänga ihop med höga elpriser.
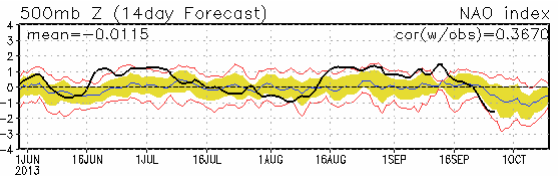
Det är svårt att göra prognoser på NAO långt in i framtiden, mycket svårare än för ENSO. Men det görs ändå och nedanför ser vi NOAA:s 14-dagars prognos. Den visar att att NAO troligtvis kommer att ligga kvar i negativ fas.
Kolmarknaden i Europa har hamnat i backwardation för korta löptider. Handlare berättar att sentimentet i marknaden har svängt. För en månad sedan var det ingen som oroade sig för att kunna få tag på kol. När man sedan började vilja köpa på sig mer för vintern, märkte man att det var svårt att få tag på varan på marknaden. Nyhetsbyrån Montel rapporterade i måndags för en vecka sedan om att det blivit allt svårare att få tag på kol från Ryssland. Lagernivåerna vid gruvorna är höga, men transportkapaciteten, via tåg, har blivit en flaskhals, samtidigt som mer går på export till Fjärran Östern.
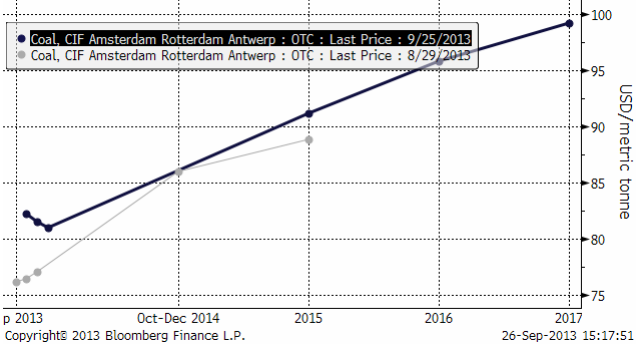
Backwardation är normalt sett ett “bullish” tecken och orsakas oftast av en ökning i efterfrågan, även om förklaringarna som vi sett ovan, bestått av både ökad efterfrågan och hänvisningar till flaskhalsar i transporterna.
Vi rekommenderar köp av el, t ex EL S eller BULL EL X4 S.
Naturgas
Naturgaspriset som förra veckan var uppe på 4 dollar, föll ner mot 3.60, men rekylerade genast upp mot 3.80.
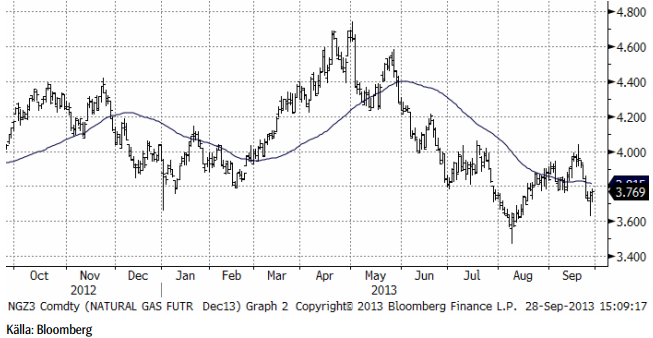
Vi har neutral rekommendation.
Guld & Silver
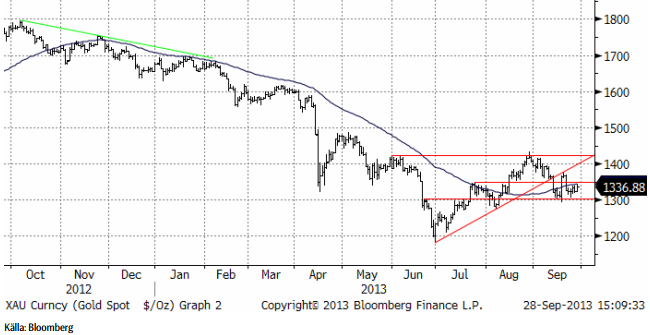
Guldpriset, som bröt uppgångsfasen i början på september, ligger nu mellan ett stöd på 1300 och ett motstånd på 1340 – 1350. Det mesta talar trots allt för att det blir en ny nedgångsfas mot 1200 dollar, men det är inte säkert.
Nedan ser vi kursdiagrammet för silver i dollar per troy ounce. Priset ligger precis under en motståndsnivå, men det ser inte ut som en stark startpunkt för veckans handel.
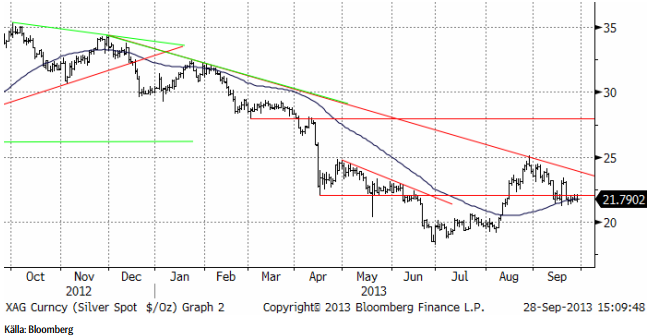
Vi fortsätter att vara neutrala guld och silver och skulle inte vilja köpa någon av dem idag.
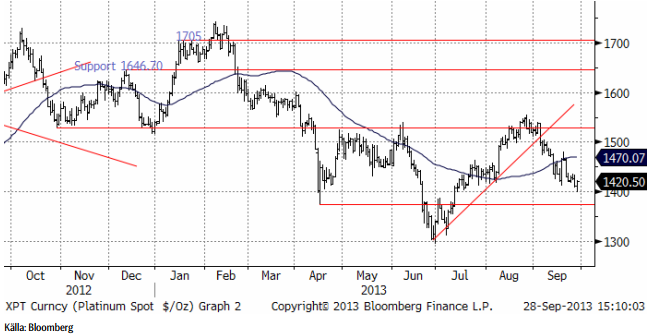
Platina & Palladium
Platinapriset har fallit ner till ett stöd på 1400 dollar. Där studsade priset upp under fredagens handel. Den kortsiktiga trenden är nedåtriktad, men det är möjligt att det finns tillräckligt med stöd på 1400 för att få till stånd en rekyl uppåt.
Nedan ser vi frontmånadskontraktet på palladium. Palladium ligger fortfarande i en slags sidledes rörelse, utan trend.
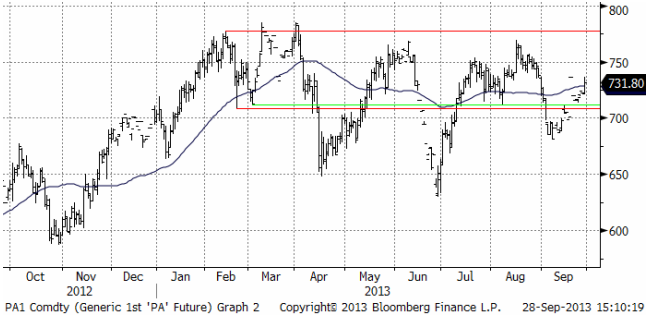
Vi är för närvarande neutrala platina och palladium, men om palladium skulle falla bara något lite ytterligare, skulle vi vilja haka på och ta en kort position via BEAR PALLAD X4 S. Vi skulle absolut inte vilja köpa någon av dem.
Koppar
Det är vid den här tiden på året som Codelco bestämmer sig för premien för katoder. Den premie som Codelco bestämmer anses vara industrins benchmark och sprider sig genom värdekedjan. Codelco producerar 10% av världens koppar. Förhandlingarna avslutas precis före den traditionella LME-veckan som börjar måndagen den 7 oktober. Europas största kopparsmältverk Aurubis annonserade i fredags att deras premium för 2014 blir 105 dollar per ton. Det är 22% högre än årets nivå. Detta tyder på att Codelco också kommer att lägga sig högre. Högre premier för fysisk metall präglar alla metaller, vilket har LME:s kapacitetsproblem vid sina lagerhus som gemensam nämnare. Det kan också i och för sig vara ett tecken på högre efterfrågan generellt.
Lagren vid LME fortsatte att minska i veckan som gick och vi tror att kopparpriset kommer att testa motstånden från i somras.
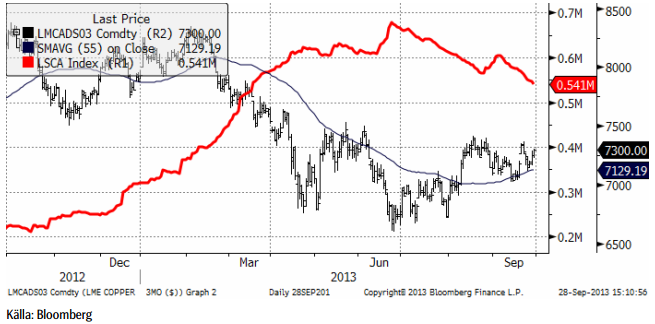
Vi går därmed över till köprekommendation på koppar och rekommenderar köp av KOPPAR S.
Aluminium
Tekniskt beter sig aluminiummarknaden som om den stod inför en uppgång mot 1900 – 1950 i det korta perspektivet. Veckan bjöd på en lagerminskning. Handlare har generellt sett en negativ vy på aluminiummarknaden och det är en god grogrund för en uppgång. Marknaden behöver dock produktionsminskningar och det är en fråga om när dessa sker; som vi skrev förra veckan tror vi att det tar längre tid än marknaden hoppas. Den fysiska premien fortsatte att falla i veckan som gick.
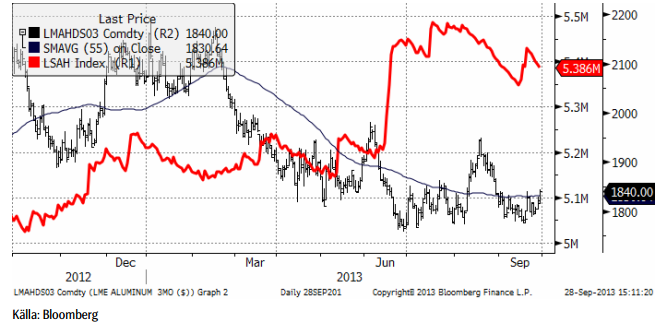
Vi har neutra rekommendation, men lutar mot en köprekommendation.
Zink
Som vi har påpekat tidigare är zinkmarknaden gott och väl i en överskottssituation, arbetar sig branschen åt rätt håll. Rekyler nedåt är köptillfällen. Förra veckan bjöd på +2.3%. Till viss del beror veckans lite större plus på den enligt vår mening omotiverade baissiga stängningen på fredagen för en vecka sedan.
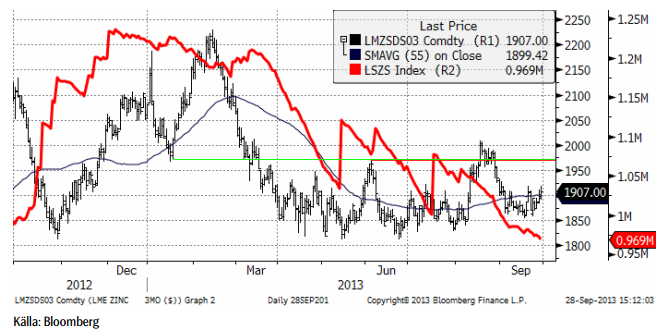
Vi fortsätter med en försiktig köprekommendation, av ZINK S.
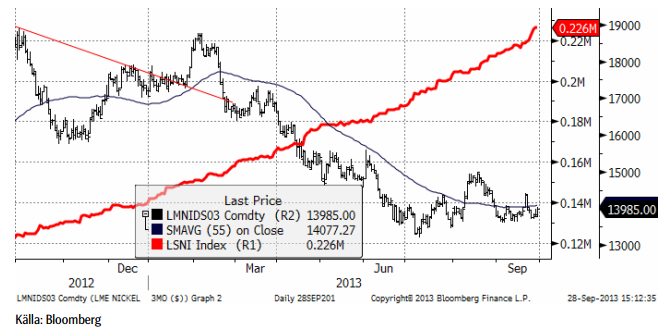
Nickel
Nickelpriset stängde mer eller mindre på oförändrat pris på veckan. Det har varit tyst på nyhetsfronten och priset har följt de andra metallernas rörelser.
Kaffe
Kaffepriset noterade nya, fräscha, bottennoteringar i veckan som gick. Trenden är nedåtriktad. Vi väntar på en uppgång, men fortsätter att vänta.
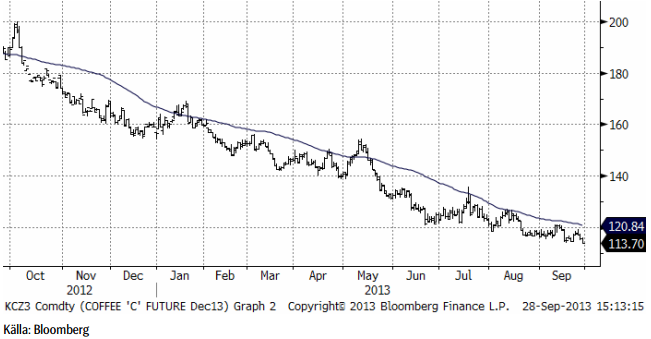
Vi behåller tills vidare neutral rekommendation, tills vi ser tecken på ett trendbrott.
[box]SEB Veckobrev Veckans råvarukommentar är producerat av SEB Merchant Banking och publiceras i samarbete och med tillstånd på Råvarumarknaden.se[/box]
Disclaimer
The information in this document has been compiled by SEB Merchant Banking, a division within Skandinaviska Enskilda Banken AB (publ) (“SEB”).
Opinions contained in this report represent the bank’s present opinion only and are subject to change without notice. All information contained in this report has been compiled in good faith from sources believed to be reliable. However, no representation or warranty, expressed or implied, is made with respect to the completeness or accuracy of its contents and the information is not to be relied upon as authoritative. Anyone considering taking actions based upon the content of this document is urged to base his or her investment decisions upon such investigations as he or she deems necessary. This document is being provided as information only, and no specific actions are being solicited as a result of it; to the extent permitted by law, no liability whatsoever is accepted for any direct or consequential loss arising from use of this document or its contents.
About SEB
SEB is a public company incorporated in Stockholm, Sweden, with limited liability. It is a participant at major Nordic and other European Regulated Markets and Multilateral Trading Facilities (as well as some non-European equivalent markets) for trading in financial instruments, such as markets operated by NASDAQ OMX, NYSE Euronext, London Stock Exchange, Deutsche Börse, Swiss Exchanges, Turquoise and Chi-X. SEB is authorized and regulated by Finansinspektionen in Sweden; it is authorized and subject to limited regulation by the Financial Services Authority for the conduct of designated investment business in the UK, and is subject to the provisions of relevant regulators in all other jurisdictions where SEB conducts operations. SEB Merchant Banking. All rights reserved.

Selling down on a ”deal”. Brent crude fell 6.2% last week with accelerated weakness towards the end of the week. Close of the week at $87.33/b and low of the week (and on Friday) of $85.8/b. Brent is falling another 4% this morning to $83.7/b on confirmation by Iran that a MoU text has been reached and that it will be signed on Friday this week.

So what is this ”deal” worth? Talk on the desk here this morning is that it is much like ”putting lipstick on a pig” where Trump has to sell this at home as a victory where ”the SoH has reopened”, the nuclear issue will be ironed out over the coming 60 days (or maybe 600 days?) and US consumers are getting a lower gasoline price and maybe US republicans survives the midterm elections.
The importance for Iran is that it emerges as the defacto winner of this war in the eyes of the non-US public world. That Iran now onwards is the ”ruler of the SoH” (combo of geography and new weapons systems like drones) or more softer: ”the guarantor of safe passage through the SoH”.
Iran doesn’t need nuclear weapons any more. Nuclear deterrence doesn’t work any more. Ukraine has made many attacks deep into Russia without being nuked in return. Plenty of Iranian ballistic rockets blasts over Israel but Iran wasn’t nuked in return.
There is no trust between the US and Iran. We don’t know all the details yet of the MoU. But what we do know is that there is no trust between the US and Iran what so ever. This is probably more like a descriptive text on how they can cooperate in a way where both sides keeps tactical leverage. Neither side makes irreversible concessions. Violations can be punished quickly. Cooperation produces immediate benefits.
This is a fragile structure. It can easily break down. There may be details which cannot be overcome. To be seen on Friday. The US has to show that it is willing put enough force behind managing and restraining Israel versus Hezbollah in Lebanon. We have seen that Netanyahu hasn’t listened all that much to Trump’s directives and wishes. This could be a major obstacle.
A gradual reopening is tactically preferable for Iran. A tactical leverage for Iran right now is that global oil stocks have been drawn down towards painful and increasingly dangerous levels with increasing risks for oil price spikes in mid-July to August. This together with US midterm elections on 3 November gives tactical leverage to Iran. Iran probably doesn’t want to fully give up on that leverage. A rapid, full reopening where global stocks are able to refill over the coming 60 days will significantly erode that leverage. If Iran reinstates a closure of the SoH after 60 days (if talks break down again), then the effect won’t be that impactful in terms of prices and the US midterm elections.
So a gradual and partial reopening where global markets gets the oil they need while they are unable to rebuild stocks could be a practical middle way for both parties. Trump can sell it as ”the SoH has reopened” and get affordable gasoline for US consumers. Iran can sell it as ”the SoH has fully reopened, but there is some friction” so flow is only 60-80% of normal.
Not much real demand destruction below $100/b. What we do know is that there is not much real price pain demand destruction for oil globally at an oil price below $100/b. A lot of demand-shock destruction. Fear. But demand should now come roaring back towards normal with fear for exceptionally high prices now is rapidly receding.
Sudden China demand destruction due to EVs? Bullocks. EV share of total Chinese carpool now around 13%. Share of new sales of EVs has reached 50%. This is a very gradual process. It doesn’t make oil demand fall like a rock over night. When EV new sales share reaches 100%, then the gasoline car pool will contract by some 5-10% per year. But that is only gasoline. Sudden reduction in Chinese oil demand is more about shock and risk.
Chinese crude oil imports will come roaring back. At what price? Today’s ”neutral” oil price is $70/b. That is the five year price which has steadily traded around the $70/b mark over the past 3-4 years. With still a risky picture one would think that China and the rest of the world will be big buyers of oil in the range of $70-85/b.
Global demand will likely snap back towards normal, forecasted demand and growth at such prices.
Physical reopening is a gradual process. The physical and practical reopening of the SoH will likely be gradual rather than sudden. And that probably suites Iran tactically as well.
Brent M1 price versus the Brent 5-yr (today’s ”normal” price)

Market is starting to take US/Iran headlines with a pinch of salt. Brent crude rose $2.8/b yesterday to an official close of $112.1/b. But after that it traded as low as $108.05/b before ending late night at around $109.7/b. Through the day it traded in a range of $106.87 – 112.72/b amid a flurry of news or rumors from Iran and the US. ”US temporary sanctions during negotiations” (falls alarm). ”We will bomb Iran” (not anyhow),… etc. While the market is still fluctuating to this kind of news flow, it is starting to take such headlines with a pinch of salt.
We’ll see. Maybe, maybe not. The Brent M1 contract is trading at $110.2/b this morning which very close to the average ticks through yesterday of $110.4/b.
Trump with bearish, verbal intervention whenever Brent trades above $110/b it seems. What seems to be a pattern is that Trump states something like ”very good negotiations going on with Iran”, ”New leaders in Iran are great,..”, ”Great progress in negotiations,…”, ”Deal in sight,..” etc whenever the Brent M1 contract trades above $110/b. An effort to cool the market. These hot air verbal interventions from Trump used to have a heavy bearish impact on prices, but they now seems to have less and less effect unless they are backed by reality.
As far as we can see there has been no real progress in the negotiations between the US and Iran with both sides still standing by their previous demands.
Iran is getting stronger while the cease fire lasts making a return to war for Trump yet harder. Iran is naturally in constant preparation for a return to war given Trump’s steady threats of bombing Iran again. Iran is naturally doing what ever is possible to prepare for a return to war. And every day the cease fire lasts it is better prepared. This naturally makes it more and more difficult and dangerous for the US to return to warring activity versus Iran as the consequences for energy infrastructure in the Persian Gulf will be more and more severe the longer the cease fire lasts. Israel seems to see it this way as well. That the war is not won and that current frozen state of a cease fire gives Iran opportunity to rebuild military and politically.
Global inventories are drawing down day by day. How much? In the meantime the Strait of Hormuz stays closed. There is varying measures and estimates of how much global inventories are drawing down. Our rough estimate, back of the envelope, is that global inventories are drawing down by at least some 10 mb/d or about 300 mb/d in a balance between loss of supply versus demand destruction. Other estimates we see are a monthly draw of 250-270 mb/d. The IEA only ’measured’ a draw in global observable stocks of 117 mb in April with oil on water rising 53 mb while on shore stocks fell 170 mb. But global stocks are hard to measure with large invisible, unmeasured stocks. As such a back of the envelope approach may be better.
Oil products is what the world is consuming. Oil product prices likely to rise while product stocks fall. Strategic Petroleum Reserves (SPR) are predominantly crude oil. Discharging oil from OECD SPR stocks, a sharp reduction in Chinese crude imports and a reduction in global refinery throughput of 6-7 mb/d has helped to keep crude oil markets satisfactorily supplied. But global inventories are drawing down none the less. And oil products is really what the world is consuming. So if global refinery throughput stays subdued, then demand will eventually have to match the supply of oil products. The likely path forward this summer is a steady draw down in jet fuel, diesel and gasoline. Higher prices for these. Then, if possible, higher refinery throughput and higher usage of crude in response to very profitable refinery margins. And lastly sharper draw in crude stocks and higher prices for these. But some 6 mb/d of oil products used to be exported through the Strait of Hormuz. And it may not be so easy to ramp up refinery activity across the world to compensate. Especially as Ukraine continues to damage Russian refineries as well as Russian crude production and export facilities.
Watch oil product stocks and prices as well as Brent calendar 2027. What to watch for this summer is thus oil product inventories falling and oil product premiums to crude rising. Another measure to watch is the Brent crude 2027 contract as it rises steadily day by day as the Strait of Hormuz stays closed and global oil inventories decline. The latter is close to the highest level since the start of the war and keeps rising.
The Brent M1 contract and the Brent 2027 prices and current price of jet fuel in Europe (ARA). All in USD/b

Our back of the envelope calculation of the global shortage created by the closure of the Strait of Hormuz. Note that 3.5 mb/d of discharge from SPR is also a draw. Note also that ’Forced demand loss’ of 2.5 mb/d is probably temporary and will fall back towards zero as logistics are sorted out leaving ’Price demand loss’ to do the job of balancing the market. Thus a shortfall of at least 9 mb/d created by the closure. More if SPR discharge is included and more if Forced demand loss recedes.

Brent is climbing higher. Front-month is at USD 106.3/bl this morning, close to a weekly high and a USD 9/bl jump from Mondays open. This is the move we flagged as a risk earlier in the week: the market shifting from ”a deal is around the corner” to ”this is going to take longer than we thought”.

Analyst Commodities, SEB
During April, rest-of-year Brent remained remarkably stable around USD 90/bl. A stability which rested on one single assumption: the SoH reopens around 1 May. That assumption is now slowly falling apart.
As we highlighted yesterday: every week of delay beyond 1 May adds (theoretically) ish USD 5/bl to the rest-of-year average, as global inventories draw 100 million barrels per week. i.e., a mid-May reopening implies rest-of-year Brent closer to USD 100/bl, and anything pushing into June or July takes us meaningfully higher.
What’s changed in the last 48 hours:
#1: The US military has formally warned that clearing suspected sea mines from SoH could take up to six months. That is a completely different timescale from what the financial market is pricing. Even a political deal tomorrow does not immediately reopen the strait.
#2: Trump has shifted his tone from urgency to ”strategic patience”. In yesterday’s press conference: ”Don’t rush me… I want a great deal.” The market is reading this as a president no longer feeling pressured by timelines, with the naval blockade running in the background.
#3: So far, the military activity is escalating, not de-escalating. Axios reports Iran is laying more mines in SoH. The US 3rd carrier strike group (USS George H.W. Bush) is arriving with two countermine vessels. Trump yesterday ordered the US Navy to destroy any Iranian boats caught laying mines. While CNN reports that the Pentagon is actively drawing up plans to strike Iranian SoH capabilities and individual Iranian military leaders if the ceasefire collapses. i.e., NOT a attitude consistent with an imminent deal!
Spot crude and product prices eased off the early-April highs on a combination of system rerouting and deal optimism. Both now weakening. Goldman estimates April Gulf output is reduced by 14.5 mbl/d, or 57% of pre-war supply, a number that keeps getting worse the longer this drags on.
Demand-side adaptation is ongoing: S. Korea has cut its Middle East crude dependence from 69% to 56% by pulling more from the Americas and Africa, and Japan is kicking off a second round of SPR releases from 1 May. But SPRs are finite.
Ref. to the negotiations, we should not bet on speed. The current Iranian leadership is dominated by genuine hardliners willing to absorb economic pain and run the clock to extract concessions. That is not a setup for a rapid resolution. US/Israeli media briefings keep framing the delay as ”internal Iranian divisions”, the reality is more complicated and points toward weeks and months, not days.
Our point is that the complexity is large, and higher prices have only just started (given a scenario where the negotiations drag out in time). The market spent April leaning on the USD 90/bl rest-of-year assumption; that case is diminishing by the hour. If ”early May reopening” is replaced by ”June, July or later” over the next week or two, both crude and products have meaningful room to reprice higher from here. There is a high risk being short energy and betting on any immediate political resolution(!).


Vattenfalls och Industrikrafts kärnkraftsbolag Videberg Kraft har valt Rolls-Royce SMR
Selling down on a ”deal”

Sommarväder skapar prisrally på elbörsen
Oil product price pain is set to rise as the Strait of Hormuz stays closed into summer

