

Analys
SEB – Råvarukommentarer, 21 oktober 2013

Rekommendationer
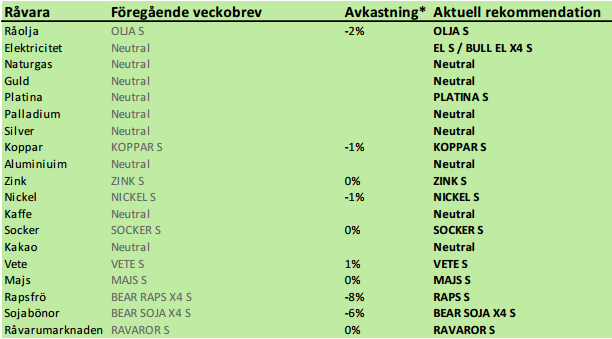 *) Avkastningen anges för 1:1 certifikaten där både BULL och 1:1 certifikat är angivna.
Inledning
Vi rekommenderar köp av el igen. Elpriset har rekylerat 2% sedan förra veckan. Samtidigt har priset på kol stigit med 5% och priset på utsläppsrätter med 11%. Samtidigt som elmarknaden fått en hälsosam rekyl på vinsthemtagningar, har priset fallit, samtidigt som produktionskostnaden stigit. Det är ett perfekt läge för att gå in och köpa certifikat på igen. EL S eller BULL EL X4 S om man vill ta mer risk.
Guld höll sig över det tekniska stödet och steg med 3% i veckan som gick. Till stor del beror detta på att dollarn försvagades mot andra valutor. Det sägs att ”when life gives you lemons, make lemonade”. Guldmarknaden åsatte åtminstone en liten sannolikhet för default av USA, men när det inte blev av, vändes blickarna mot ännu mer QE3-lemonad, om man får säga så. Därav uppgången. PGM-metallerna platina och palladium hade en ännu starkare vecka med uppgångar på 4 – 5%. Det extra stödet kom från statistik som visade ökad bilförsäljning i Europa. Detta fick även blypriset att stiga med 5%. Zinkprisets uppgång på 2% kan också ha påverkats positivt av bilförsäljningsstatistiken. På basis av detta går vi över till en försiktig kortsiktig köprekommendation av PLATINA S, men behåller ”neutral” på de andra ädelmetallerna.
Kinesisk statistik kom i fredags. BNP för det tredje kvartalet hamnade på +7.8% i tillväxt, vilket var helt enligt förväntningarna, men högre än tidigare under året. Industriproduktionen i september ökade med 10.2% och detaljhandelsförsäljningen med 13.3%. Kina står för en betydande del av råvaruefterfrågan i världen. Att tillväxten nu tycks ha tagit fart även i Kina, är mycket positivt för råvarumarknaden.
Råolja – Brent
Oljepriset backade med 1% i veckan som gick, men det ser inte ut som en trendvändning nedåt, utan som en rekyl innan ett nytt test uppåt.
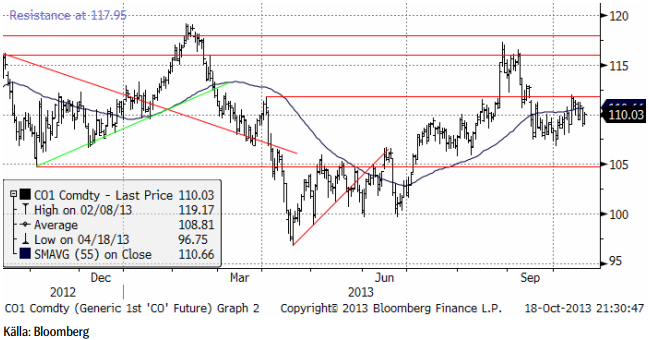
På grund av den attraktiva rabatten på terminer i oljemarknaden och för att vi inte ser någon omedelbar risk för väsentligt lägre pris på olja rekommenderar vi innehav i OLJA S.
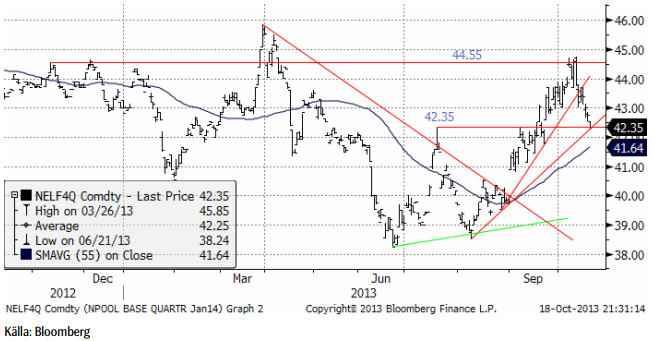
Elektricitet
Första kvartalet 2014:s terminskontrakt som sedan det inte klarade av att gå över motståndet vid 44.55 euro för drygt en vecka sedan befunnit sig i rekyl, stängde i fredags på stödet vid 42.35 euro per MWh. Veckans nedgång blev 2%. Förra veckan rekommenderade vi neutral position i väntan på att rekylen skulle bli färdig och erbjuda ett nytt köptillfälle. Vi anser att vi är där nu och rekommenderar köp av EL S eller BULL EL X4 S för den som vill ta mer risk och få större utväxling om priset stiger. Samtidigt som priset på el har backat, har nämligen priset på kol stigit med 5% och priset på utsläppsrätter stigit med 11%. Det gör att gapet mellan priset på el och kostnaden för att producera elen, återigen blivit attraktivt för att vara köpt el.
Nedan ser vi prisdiagrammet för det första kvartalet 2014:s kontrakt.
Nedan ser vi priset på energikol, den närmaste månadens leveranstermin. Priset har stigit till den högsta nivån sedan i maj.
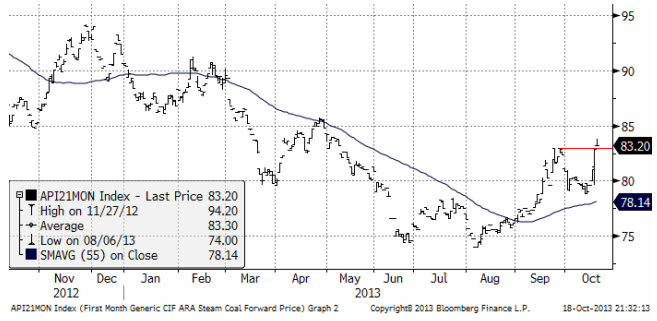
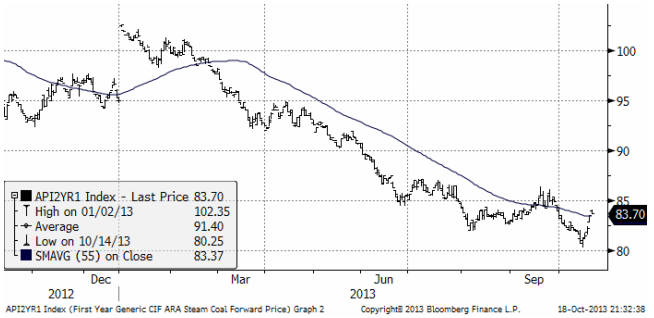
Även årskontraktet på kol har stigit från 80 dollar till 83.70, som vi ser i diagrammet nedan.
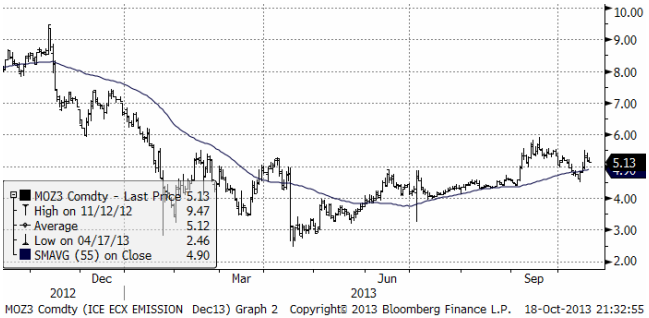
Priset på utsläppsrätter har stigit och sedan rekylerat i vad som ser ut som en flagga. Om det är en flagga, säger den tekniska analysen att prisobjektivet hamnar vid 6 euro per ton.
Vi rekommenderar alltså köp av EL S eller BULL EL X4 S.
Naturgas
Naturgaspriset gick inte igenom 4 dollar och föll därefter. Vi ser dock att det glidande medelvärdet, som mäter trenden, har vänt uppåt och är stigande. Då och då ser man rekyler där det glidande medelvärdet även fungerar som stöd. Det skulle kunna bli så den här gången, vilket i så fall indikerar att priset kan komma att stiga i veckan som kommer.
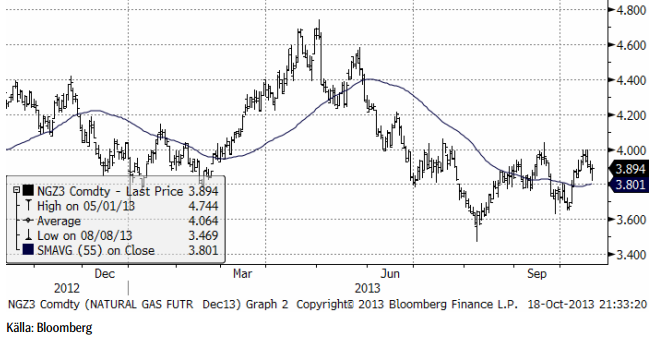
Vi har neutral rekommendation.
Guld & Silver
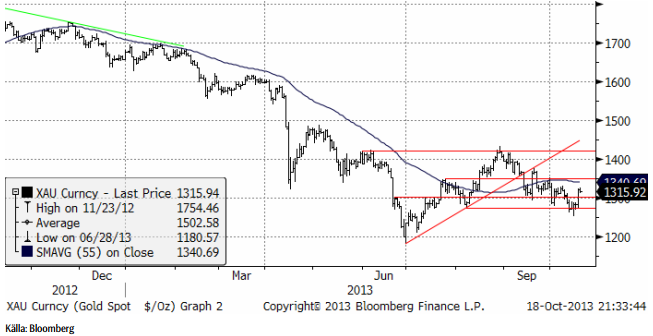
Guldpriset (i dollar) steg när dollarn föll efter uppgörelsen i Washington om en höjning av skuldtaket.
Stora investmentbanker som Credit Suisse och Goldmans Sachs har säljrekommendation på guld. Chefen för råvaruanalysen på Goldman Sachs har kallat guld för en ”slam dunk” bear-kandidat för år 2014. I en studie gjord av Bloomberg i fredags, väntar sig de 10 mest träffsäkra analytikerna på de stora bankerna och analyshusen i världen att guldpriset kommer att falla under vart och ett av de kommande fyra åren.
Om man ska drista sig till analysera analytikerna, kan man se att Goldman Sachs har en tendens att extrapolera trender. När oljepriset år 2008 var på väg uppåt sade de t ex att priset skulle nå över 200 dollar per fat. Samma sak innan guldpriset vände ner.
När det gäller guld är analytiker av två slag – sådana som i grunden inte ser någon praktisk anledning att investera i guld på den ena sidan. ”Guld ger ingen avkastning” är ett vanligt argument från dem. Den andra sidans analytiker tillhör den grupp männskor som pekar på att guldpriset speglar en sorts försäkringspremie mot framförallt statlig förstörelse av pengars värde genom konkurs eller inflation och har uppfattningen om att detta kommer att bli värre. Det är sällan personer i grund och botten ändrar uppfattning om guldets föredömen som placering. Den sida som haft mest rätt den senaste tiden är den första halvan av analytikerkåren, men om priserna går upp bli blir det istället den andra halvan. Det är därför inte förvånande att de som haft mest rätt den senaste tiden, enligt Bloombergs survey, också har en negativ inställning till framtiden.
I veckan som gick sköts en amerikansk default på statsskulden upp och ersattes av en fortsättning av QE3 (expansion av penningmängden).
Samtidigt har faktiskt det låga priset fått effekt på produktionen. Barrick Gold Corp, världen största producent meddelade att de ska stänga eller minska produktionen i 12 guldgruvor, från Peru till Papua New Guinea.
Det har varit en trend hos guldbolagen sedan år 2000 att inte prissäkra produktionen, så som andra gruvbolag gör. Aktiemarknaden har uppmuntrat detta. Gruvbolagen har sammantaget köpt upp till 400 ton (årlig global gruvproduktion ca 2500 ton) i terminer för att avskaffa hedgarna under hela 00-talet. Gruvbolagen har alltså själva stått för en betydande ”efterfrågan” på guld. Med det mycket mer negativa sentiment kring guldpriset som råder nu, är det troligt att gruvbolagen kommer att börja prissäkra igen. Detta leder till ett stigande ”utbud” från gruvbolagen. I år väntas hedgingvolymen uppgå till blygsamma 20 ton, men kan redan nästa år ha ökat till 35 ton, enligt Barclays.
Just nu går aktiemarknaden starkt och i valet mellan guld och aktier, tycker antagligen nästan alla att guld drar det kortaste strået. All efterfrågan på guld är dock inte investeringar, utan i grund och botten efterfrågan på smycken. Den efterfrågan har minskat i takt med att priset stigit de senaste tio åren, utom i Kina och andra tillväxtländer. Framförallt kan den kinesiska efterfrågan på smycken ta fart om priset sjunker. Detta kan fungera som ett fundamentalt stöd på nedsidan i priset. En starkare tillväxt kan också leda till högre efterfrågan.
Tekniskt ser vi att priset i dollar fann stöd på 1270-nivån.
Nedan ser vi kursdiagrammet för silver i dollar per troy ounce. Det ser ut som om 20 dollar ska testas igen.
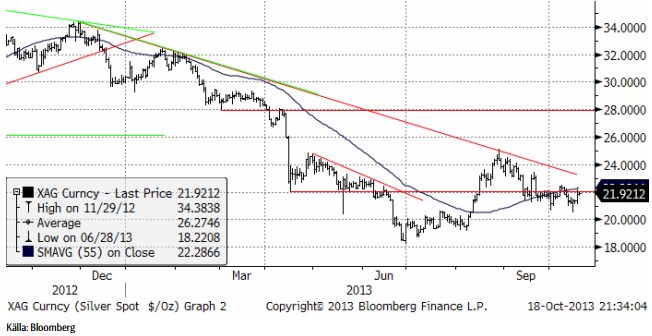
Vi fortsätter att vara neutrala guld och silver och skulle inte vilja köpa någon av dem idag.
Platina & Palladium
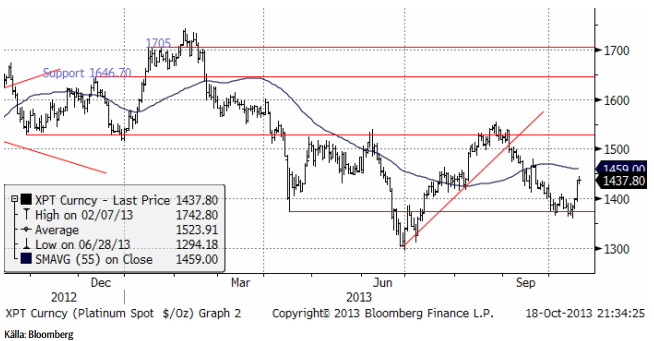
Platinapriset följde guld och silver, men fick extra skjuts av statistik som visar på högre bilförsäljning i Europa. Platina används för avgasrening i dieseldrivna bilar, och den kategorin har enligt statistiken utvecklats extra starkt.
Nedan ser vi frontmånadskontraketet på palladium. Palladium ligger fortfarande i en slags sidledes rörelse, utan trend.
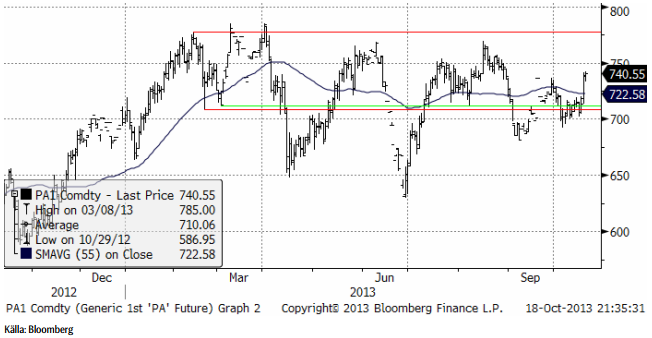
Vi fortsätter att vara neutrala palladium, men går kortsiktigt över till köp på plantina; PLATINA S.
Koppar
Statistik från Kina visade att importen av koppar steg med 16% i september (jämfört med förra året), till 458 kt. Vi anser att detta är återspeglar en fortsatt stark utveckling och återhämtning i Kinas ekonomi. I veckan publicerades BNP-tillväxten i Kina under det tredje kvartalet, som låg på 7.8%.
Tekniskt har vi ett mycket intressant läge. Det har bildats en så kallad triangelformation, med lägre toppar och högre bottnar, sedan augusti-september. Vi tror att ett utbrott uppåt eller nedåt kommer inom ett par veckor – troligtvis upåt. Man ser ofta den här sortens formationer ”halvvägs” på en rörelse uppåt eller nedåt. Prisobjektivet skulle i så fall, om den har inträffat halvvägs från botten, vara ca 8000 dollar per ton.
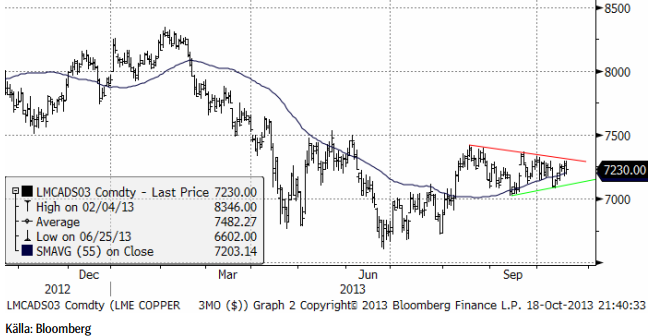
Vi rekommenderar köp av KOPPAR S.
Aluminium
Aluminiummarknaden rör sig just nu inte som de andra metallerna. Förrförra veckan steg priset på aluminium, medan de andra metallerna höll sig rätt platta. Förra veckan föll aluminiumpriset samtidigt som de andra steg. Mäklarfirman RJ O’Brien har sammanställt analytikerestimat för aluminium under LME:veckan. Det är den vecka på året då alla publicerar analyser och det är möjligt att analysera analytikerna samtidigt. För 2013 tror mediananalytikern på ett produktionsöverskott på 475 kt, faktiskt mycket mindre än vad man skulle kunna tro. Spännvidden är stor, från ett underskott på 1.2 mt till ett överskott på 1.1 mt. Undersökningen visar också en klar förbättring jämfört med LME-veckan 2012.
Fundamentalt har inget hänt i veckan som gick. Vi tror att marknaden kommer att fortsätta handla inom intervallet 1800 – 1900 dollar.
Den allmänna bilden ser dock ut som en botten som närmar sig sitt slut. Vi ser att 55-dagars glidande medelvärde börjar peka uppåt, dvs åtminstone den trendindikatorn har vänt uppåt.
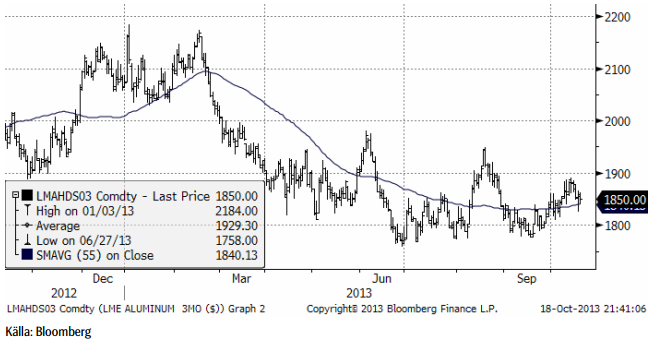
Vi har neutral rekommendation, men lutar mot en köprekommendation.
Zink
Zink fortsatte att röra sig svagt uppåt inom den bottenformation som etablerats sedan mars månad. Styrkan i den kinesiska ekonomin ger stöd för marknaden. Ett brott av 1,950 dollar skulle signalera att marknaden vill testa även 2000 dollar. Det tekniska motståndet på 1930 – 1935 dollar har emellertid inte brutits än och det är möjligt att köpare vill avvakta ännu en rekyl nedåt, mot 1900 dollar.
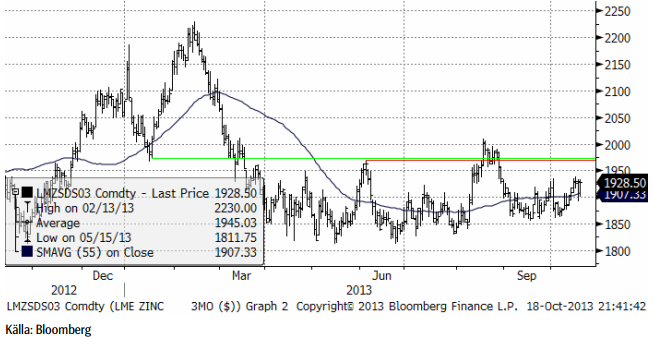
Vi fortsätter med en köprekommendation av ZINK S.
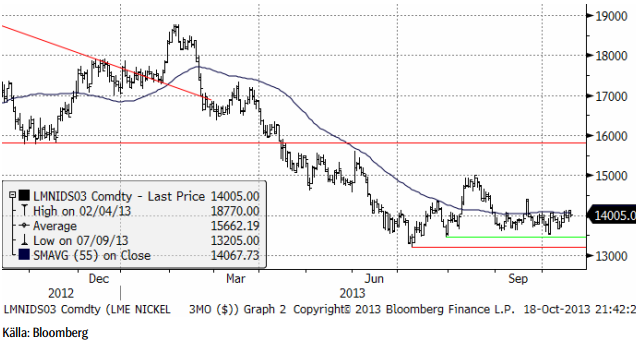
Nickel
Handeln var svag hela veckan, men bland basmetallerna stack nickel ut i fredags. Efter en paus, tog sig priset upp genom det tekniska motståndet vid 14,100. Tekniskt finns utrymme upp till septembers högsta notering på 14,400 dollar, där vi tror att säljare fortfarande väntar.
Marknaden diskuterar fortfarande sannolikheten för det eventuella kommande indonesiska exportförbudet. Vi tror att sannolikheten är lägre än andra marknadsbedömare. Om vi får rätt skjuter det upp minskningen i den kinesiska produktionen av nickeljärn till nästa år. Om det blir ett exportförbud får det sannolikt priserna att gå upp temporärt. Men vi ser också att kinesiska bolag importerar så mycket de kan nu. Enligt CRU är Kinas import av nickelmalm upp 8.9% under de åtta första månaderna i år, jämfört med 2012. En del av den ökningen är säkert en lageruppbyggnad. Mot slutet av året tror vi att priset på nickel kommer att stiga till 14,000 – 14,500 dollar per ton, dels på grund av säsongsmässigt högre efterfrågan och på grund av att tiden för ett eventuellt exportförbud rycker allt närmare.
Kaffe
Kaffepriset fortsatte ner med 2% i veckan som gick. Nyhetsflödet har talat om rekordhöga lager det kommande året, när produktionen i länder som drabbats av bladmöglet roya återtar något av sin produktionskapacitet med resistenta sorter. Brasilien väntas bärga en rekordskörd, eftersom den kommande skörden är den högre i 2-års-cykeln av höga och låga skördar. Med det sagt, är priset verkligen lågt och vändningen uppåt i sockermarknaden gör att sockerrör, som konkurrerar om areal med kaffe, kan fortsätta att vinna mark, framförallt i Brasilien.
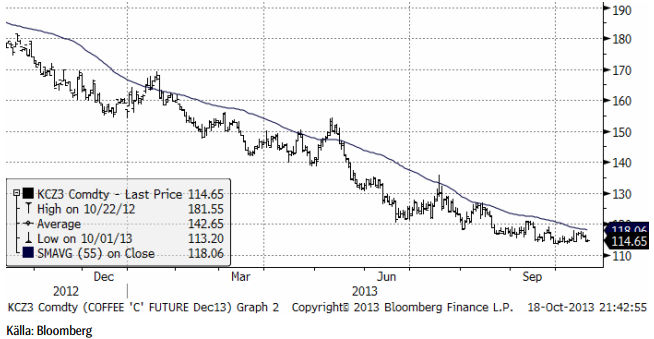
Vi behåller tills vidare neutral rekommendation, tills vi ser tecken på ett trendbrott.
För fler jordbruksråvaror se SEBs analysbrev från tidigare idag.
[box]SEB Veckobrev Veckans råvarukommentar är producerat av SEB Merchant Banking och publiceras i samarbete och med tillstånd på Råvarumarknaden.se[/box]
Disclaimer
The information in this document has been compiled by SEB Merchant Banking, a division within Skandinaviska Enskilda Banken AB (publ) (“SEB”).
Opinions contained in this report represent the bank’s present opinion only and are subject to change without notice. All information contained in this report has been compiled in good faith from sources believed to be reliable. However, no representation or warranty, expressed or implied, is made with respect to the completeness or accuracy of its contents and the information is not to be relied upon as authoritative. Anyone considering taking actions based upon the content of this document is urged to base his or her investment decisions upon such investigations as he or she deems necessary. This document is being provided as information only, and no specific actions are being solicited as a result of it; to the extent permitted by law, no liability whatsoever is accepted for any direct or consequential loss arising from use of this document or its contents.
About SEB
SEB is a public company incorporated in Stockholm, Sweden, with limited liability. It is a participant at major Nordic and other European Regulated Markets and Multilateral Trading Facilities (as well as some non-European equivalent markets) for trading in financial instruments, such as markets operated by NASDAQ OMX, NYSE Euronext, London Stock Exchange, Deutsche Börse, Swiss Exchanges, Turquoise and Chi-X. SEB is authorized and regulated by Finansinspektionen in Sweden; it is authorized and subject to limited regulation by the Financial Services Authority for the conduct of designated investment business in the UK, and is subject to the provisions of relevant regulators in all other jurisdictions where SEB conducts operations. SEB Merchant Banking. All rights reserved.


Strong rebound yesterday with further gains today. Brent crude rallied 3.2% with a close of USD 62.15/b yesterday and a high of the day of USD 62.8/b. This morning it is gaining another 0.9% to USD 62.7/b with signs that US and China may move towards trade talks.

Brent went lower on 9 April than on Monday. Looking back at the latest trough on Monday it traded to an intraday low of USD 58.5/b. In comparison it traded to an intraday low of USD 58.4/b on 9 April. While markets were in shock following 2 April (’Liberation Day’) one should think that the announcement from OPEC+ this weekend of a production increase of some 400 kb/d also in June would have chilled the oil market even more. But no.
’ Technically overbought’ may be the explanation. ’Technically overbought’ has been the main explanation for the rebound since Monday. Maybe so. But the fact that it went lower on 9 April than on Monday this week must imply that markets aren’t totally clear over what OPEC+ is currently doing and is planning to do. Is it the start of a flood or a brief period where disorderly members need to be whipped into line?
The official message is that this is punishment versus quota cheaters Iraq, UAE and Kazakhstan. Makes a lot of sense since it is hard to play as a team if the team strategy is not followed by all players. If the May and June hikes is punishment to force the cheaters into line, then there is very real possibility that they actually will fall in line. And voila. The May and June 4x jumps is what we got and then we are back to increases of 137 kb/d per month. Or we could even see a period with no increase at all or even reversals and cuts.
OPEC+ has after all not officially abandoned cooperation. It has not abandoned quotas. It is still an overall orderly agenda and message to the market. This isn’t like 2014/15 with ’no quotas’. Or like full throttle in spring 2020. The latter was resolved very quickly along with producer pain from very low prices. It is quite clear that Saudi Arabia was very angry with the quota cheaters when the production for May was discussed at the end of March. And that led to the 4x hike in May. And the same again this weekend as quota offenders couldn’t prove good behavior in April. But if the offenders now prove good behavior in May, then the message for July production could prove a very different message than the 4x for May and June.
Trade talk hopes, declining US crude stocks, backwardated Brent curve and shale oil pain lifts price. If so, then we are left with the risk for a US tariff war induced global recession. And with some glimmers of hope now that US and China will start to talk trade, we see Brent crude lifting higher today. Add in that US crude stocks indicatively fell 4.5 mb last week (actual data later today), that the Brent crude forward curve is still in front-end backwardation (no surplus quite yet) and that US shale oil production is starting to show signs of pain with cuts to capex spending and lowering of production estimates.
Rebounding from the sub-60-line for a second time. Following a low of USD 59.3/b, the Brent July contract rebounded and closed up 1.8% at USD 62.13/b. This was the second test of the 60-line with the previous on 9 April when it traded to a low of USD 58.4/b. But yet again it defied a close below the 60-line. US ISM Manufacturing fell to 48.7 in April from 49 in March. It was still better than the feared 47.9 consensus. Other oil supportive elements for oil yesterday were signs that there are movements towards tariff negotiations between the US and China, US crude oil production in February was down 279 kb/d versus December and that production by OPEC+ was down 200 kb/d in April rather than up as expected by the market and planned by the group.
All eyes on OPEC+ when they meet on Monday 5 May. What will they decide to do in June? Production declined by 200 kb/d in April (to 27.24 mb/d) rather than rising as the group had signaled and the market had expected. Half of it was Venezuela where Chevron reduced activity due to US sanctions. Report by Bloomberg here. Saudi Arabia added only 20 kb/d in April. The plan is for the group to lift production by 411 kb/d in May which is close to 3 times the monthly planned increases. But the actual increase will be much smaller if the previous quota offenders, Kazakhstan, Iraq and UAE restrain their production to compensate for previous offences.
The limited production increase from Saudi Arabia is confusing as it gives a flavor that the country deliberately aimed to support the price rather than to revive the planned supply. Recent statements from Saudi officials that the country is ready and able to sustain lower prices for an extended period instead is a message that reviving supply has priority versus the price.
OPEC+ will meet on Monday 5 May to decide what to do with production in June. The general expectation is that the group will lift quotas according to plans with 137 kb/d. But recent developments add a lot of uncertainty to what they will decide. Another triple quota increase as in May or none at all. Most likely they will stick to the original plan and decide lift by 137 kb/d in June.
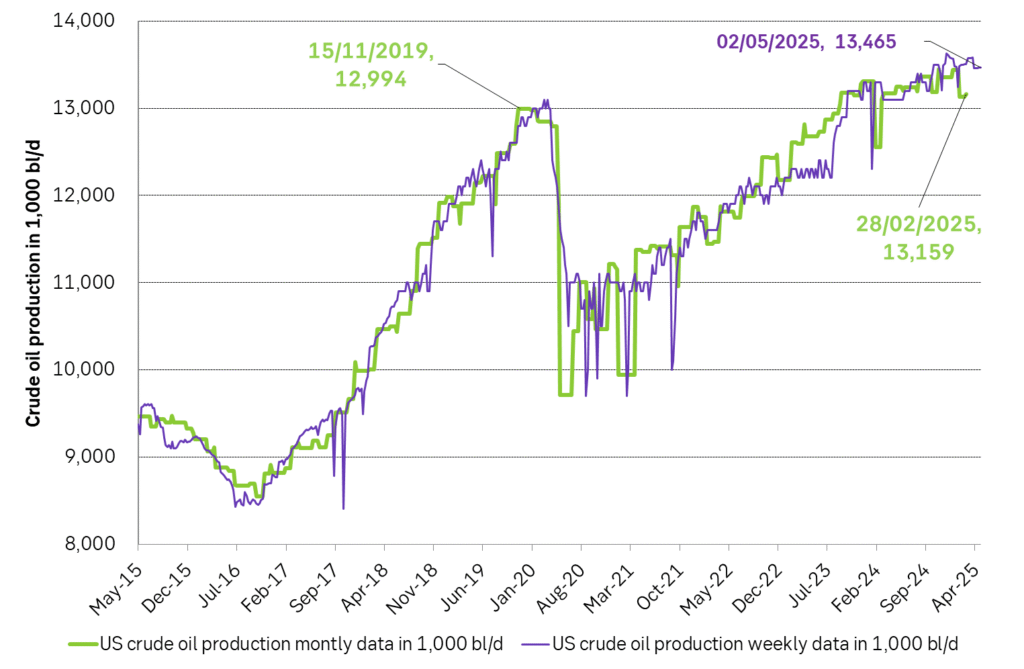
US production surprised on the downside in February. Are prices starting to bite? US crude oil production fell sharply in January, but that is often quite normal due to winter hampering production. What was more surprising was that production only revived by 29 kb/d from January to February. Weekly data which are much more unreliable and approximate have indicated that production rebounded to 13.44 mb/d after the dip in January. The official February production of 13.159 mb/d is only 165 kb/d higher than the previous peak from November/December 2019. The US oil drilling rig count has however not change much since July last year and has been steady around 480 rigs in operation. Our bet is that the weaker than expected US production in February is mostly linked to weather and that it will converge to the weekly data in March and April.
Where is the new US shale oil price pain point? At USD 50/b or USD 65/b? The WTI price is now at USD 59.2/b and the average 13 to 24 mth forward WTI price has averaged USD 61.1/b over the past 30 days. The US oil industry has said that the average cost break even in US shale oil has increased from previous USD 50/b to now USD 65/b with that there is no free cashflow today for reinvestments if the WTI oil price is USD 50/b. Estimates from BNEF are however that the cost-break-even for US shale oil is from USD 40/b to US 60/b with a volume weighted average of around USD 50/b. The proof will be in the pudding. I.e. we will just have to wait and see where the new US shale oil ”price pain point” really is. At what price will we start to see US shale oil rig count starting to decline. We have not seen any decline yet. But if the WTI price stays sub-60, we should start to see a decline in the US rig count.
US crude oil production. Monthly and weekly production in kb/d.
Brent crude falls with strong conviction that trade war will hurt demand for oil. Brent crude sold off 2.4% yesterday to USD 64.25/b along with rising concerns that the US trade war with China will soon start to visibly hurt oil demand or that it has already started to happen. Tariffs between the two are currently at 145% and 125% in the US and China respectively which implies a sharp decline in trade between the two if at all. This morning Brent crude (June contract) is trading down another 1.2% to USD 63.3/b. The June contract is rolling off today and a big question is how that will leave the shape of the Brent crude forward curve. Will the front-end backwardation in the curve evaporate further or will the July contract, now at USD 62.35/b, move up to where the June contract is today?
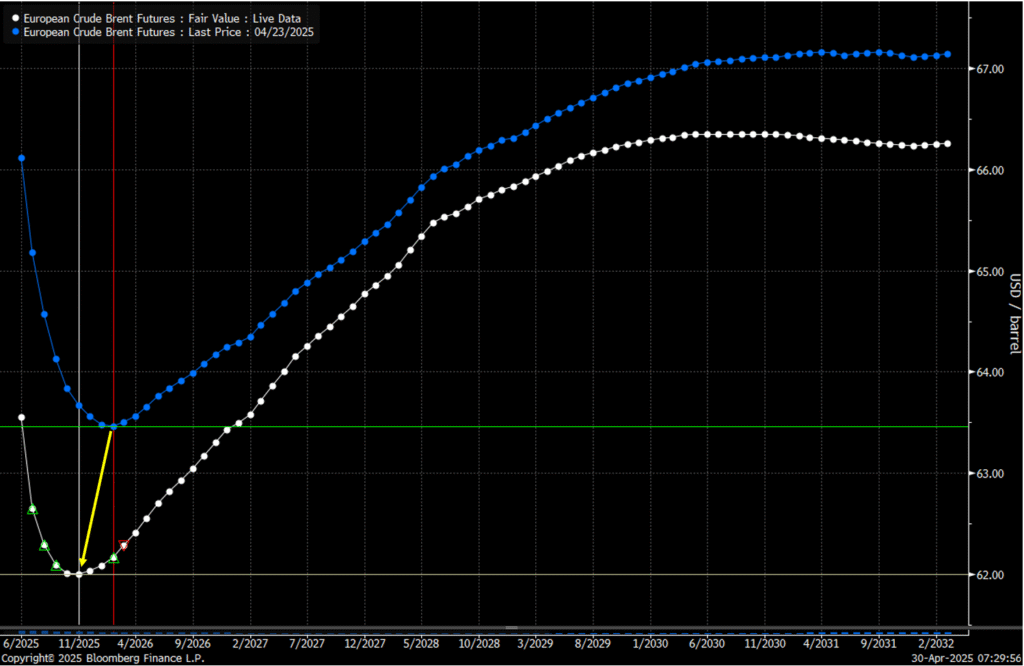
The unusual ”weird smile” of Brent forward curve implies unusual strong bearish conviction amid current prompt tightness. the The Brent crude oil forward curve has displayed a very unusual shape lately with front-end backwardation combined with deferred contango. Market pricing tightness today but weakness tomorrow. We have commented on this several times lately and Morgan Stanly highlighted how unusual historically this shape is. The reason why it is unusual is probably because markets in general have a hard time pricing a future which is very different from the present. Bearishness in the oil market when it is shifting from tight to soft balance usually comes creeping in at the front-end of the curve. A slight contango at the front-end in combination with an overall backwardated curve. Then this slight contango widens and in the end the whole curve flips to full contango. The current shape of the forward curve implies a very, very strong conviction by the market that softness and surplus is coming. A conviction so strong that it overrules the present tightness. This conviction flows from the fundamental understanding that ongoing trade war is bad for the global economy, for oil demand and for the oil price.
Will OPEC+ switch to cuts or will it leave balancing to a lower price driving US production lower? Add of course also in that OPEC+ has signaled that it will lift production more rapidly and is currently no longer in the mode of holding back to keep Brent at USD 75/b due to an internal quarrel over quotas. That stand can of course change from one day to the next. That is a very clear risk to the upside and oil consumers around should keep that in the back of their minds that this could happen. Though we are not utterly convinced of the imminent risk of this. Before such a pivot happens, Iraq and Kazakhstan probably have to prove that they can live up to their promised cuts. And that will take a few months. Also, OPEC+ might also like to see where the pain-point for US shale oil producers’ price-vise really is today. So far, we have seen no decline in the number of US oil drilling rigs in operation which have steadily been running at around 480 rigs.
With a surplus oil market on the horizon, OPEC+ will have to make a choice. How shale this coming surplus be resolved? Shall OPEC+ cut in order to balance the market or shall lower oil prices drive pain and lower production in the US which then will result in a balanced market? Maybe it is the first or maybe the latter. The group currently has a bloated surplus balance which it needs to slim down at some point. And maybe now is the time. Allowing the oil price to slide. Economic pain for US shale oil producers to rise and US oil production to fall in order to balance the market and make room OPEC+ to redeploy its previous cuts back into the market.
Surplus is not yet here. US oil inventories likely fell close to 2 mb last week. US API yesterday released indications that US crude and product inventories fell 1.8 mb last week with crude up 3.8 mb, gasoline down 3.1 mb and distillates down 2.5 mb. So, in terms of a crude oil contango market (= surplus and rising inventories) we have not yet moved to the point where US inventories are showing that the global oil market now indeed is in surplus. Though Chinese purchases to build stocks may have helped to keep the market tight. Indications that Saudi Arabia may lift June Official Selling Prices is a signal that the oil market may not be all that close to unraveling in surplus.
The low point of the Brent crude oil curve is shifting closer to present. A sign that the current front-end backwardation of the Brent crude oil curve is about to evaporate.
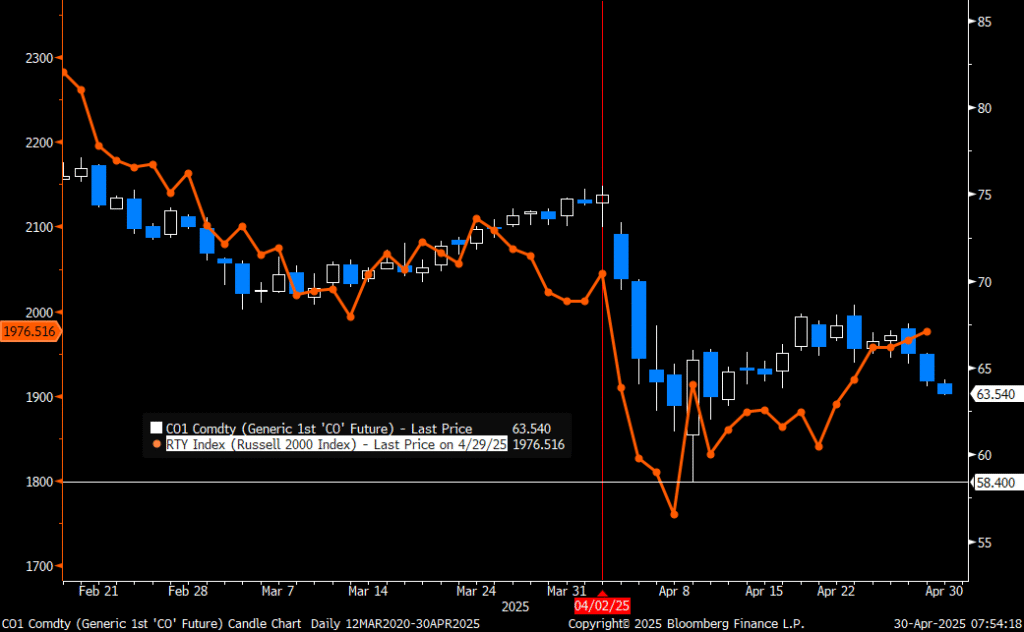
Brent crude versus US Russel 2000 equity index. Is the equity market too optimistic or the oil market too bearish?


Whipping quota cheaters into line is still the most likely explanation

Hur USA blev världens största exportör av propan

Utbudsunderskott och stigande industriell efterfrågan av silver på marknaden

Inflationsjusterat är olja nu billigare än på mitten av 1980-talet

Vad som händer med råvaror, dollar, olja, mjölk och koppar

Ingenting stoppar guldets uppgång, nu 3400 USD per uns
Crude oil comment: The forward curve is pricing tightness today and surplus tomorrow

Samtal om läget för guld, kobolt och sällsynta jordartsmetaller

Agnico Eagle siktar på toppen – två av världens största guldgruvor i sikte

Lägre elpriser och många minustimmar fram till midsommar
-
 Nyheter3 veckor sedan
Ingenting stoppar guldets uppgång, nu 3400 USD per uns
-
Analys2 veckor sedan
Crude oil comment: The forward curve is pricing tightness today and surplus tomorrow
-
 Nyheter2 veckor sedan
Samtal om läget för guld, kobolt och sällsynta jordartsmetaller
-
 Nyheter2 veckor sedan
Agnico Eagle siktar på toppen – två av världens största guldgruvor i sikte
-
 Nyheter1 vecka sedan
Lägre elpriser och många minustimmar fram till midsommar
-
 Nyheter3 veckor sedan
Kina slår nytt rekord i produktion av kol
-

 Nyheter1 vecka sedan
Saudiarabien informerar att man är ok med ett lägre oljepris
-

 Nyheter3 veckor sedan
Den viktiga råvaruvalutan USD faller kraftigt