

Analys
SEB – Råvarukommentarer, 18 mars 2013

Rekommendationer
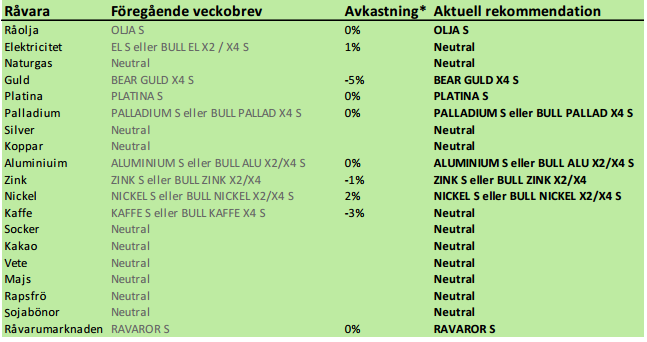
*) Avkastningen avser 1:1 råvarucertifikat där de ingår i rekommendationen. I den aktuella tabellen ovan har jag tagit prisförändringen den senaste veckan sedan det förra veckobrevet publicerades.
Inledning
Råvarumarknaden var ganska lugn och avvaktande förra veckan. Flera råvarumarknader har avslutat (?) en större prisrörelse och befinner sig i rekyl mot den tidigare trenden, som t ex majs, vete, ädelmetaller. Andra börjar närma sig psykologiskt viktiga nivåer, som t ex elektriciteten.
Den här veckan gör vi ett par ändringar av vår vy. Trots att det mesta fundamentalt pekar på att kaffepriset är lågt och borde kunna ligga högre går vi över till neutral rekommendation. Elmarknaden som vi haft köpt rekommendation på i flera månader väljer vi nu att också gå över till neutral rekommendation på. Priset börjar närma sig tidigare toppnotering och det tyska priset har fortsatt att falla.
Råvaruindex
I diagrammet nedan ser vi SEB:s råvaruindex (grön), OMX (svart) och DJUBS (röd), alla omräknade till svenska kronor. Vi ser att DJ UBS drabbats mycket av dess stora övervikt på jordbruksprodukter. SEB:s index har drabbats av detta också, men inte i lika stor utsträckning. Prisfallet på energi den senaste månaden har däremot tyngt indexet. Aktier har gått starkt sedan november. Den senaste månaden har råvaruindex sjunkit och aktier stigit.
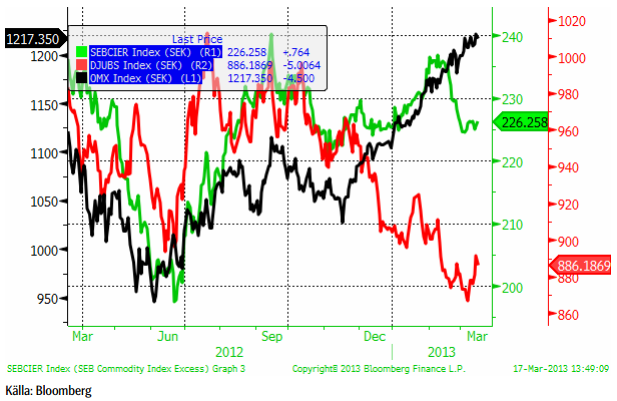
Den som vill investera i indexet och den investeringsstrategi som ligger bakom kan läsa mer certifikatet RAVAROR S.
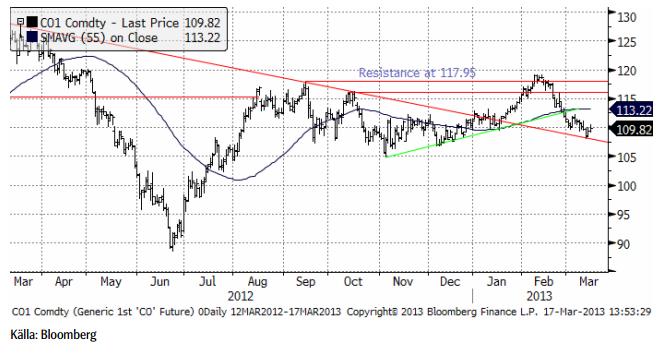
Råolja – Brent
Oljepriset har fortsatt att falla. I bankens senaste Oil Market report varnas för att den här svagheten kan komma att fortsätta
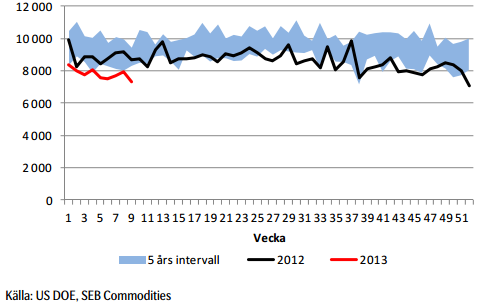
Lagren och lagerförändringarna i USA per den 8 mars ser vi nedan, enligt Department of Energy och American Petroleum Institute.
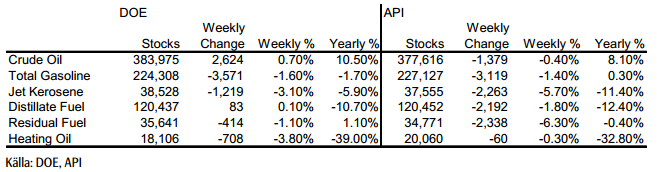
Nedan ser vi amerikanska råoljelager enligt DOE i tusen fat. Den svarta kurvan är 2012 års lagernivåer vecka för vecka och den lilla röda linjen är 2013 års nivå. Vi ser att lagernivåerna fortsätter att vara högre än de varit sedan 2007 för den här tiden på året.
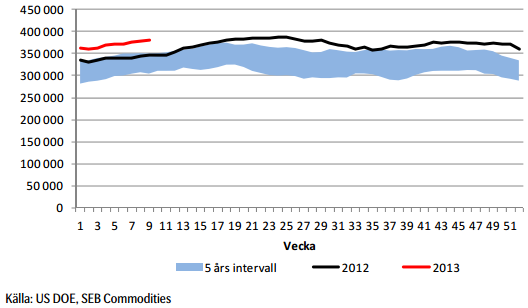
Lagren ökar samtidigt som vi ser att importen av råolja till USA fortsätter att minska. I veckans statistik minskade importtakten ytterligare.
Vi rekommenderar köp av OLJA S, men inte av BULL OLJA S. Anledningen till denna skillnad och att vi rekommenderar köp av OLJA S är för att rabatten på terminerna innebär en stadig intäkt om ca 6% till 7% per år + ränta på kapitalet.
Elektricitet
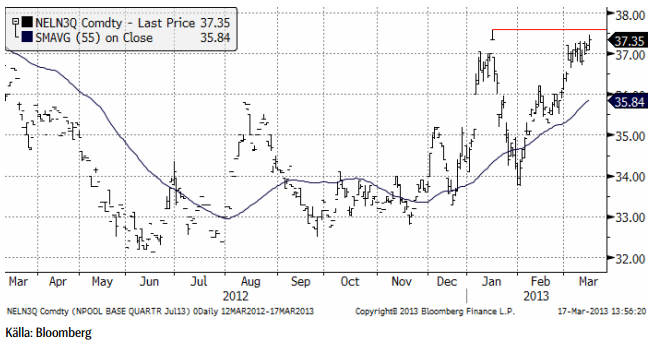
Underliggande för SEB:s certifikat på el är det tredje kvartalets terminskontrakt. Det avser alltså vad det genomsnittliga spotpriset kommer att bli under juli, augusti och september. Vi ser kursdiagrammet för det senaste året nedan.
Nedanför ser vi prisutvecklingen för det tredje kvartalets tyska elpriskontrakt (röd) och Nord Pools tredje kvartalskontrakt (grön). Det tyska priset har fortsatt att falla och det nordiska att stiga. Det är nu bara 25 eurocent som skiljer priserna åt.
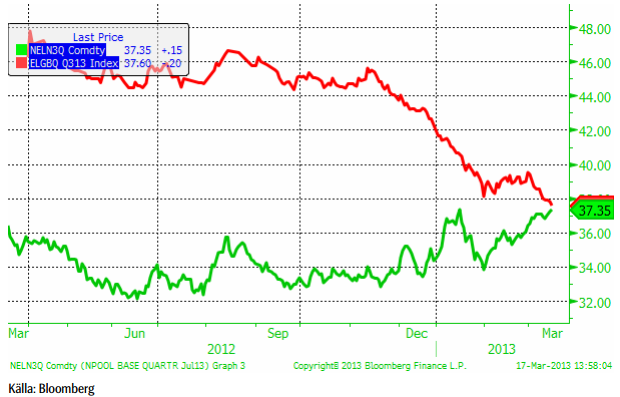
Det är en kall och torr vår gör sommaren kort, skrev Lars Wivallius år 1642. Den hydrologiska balansen för Nord Pools börsområde har sjunkit ytterligare från -14.66 TWh till -15.89 TWh.
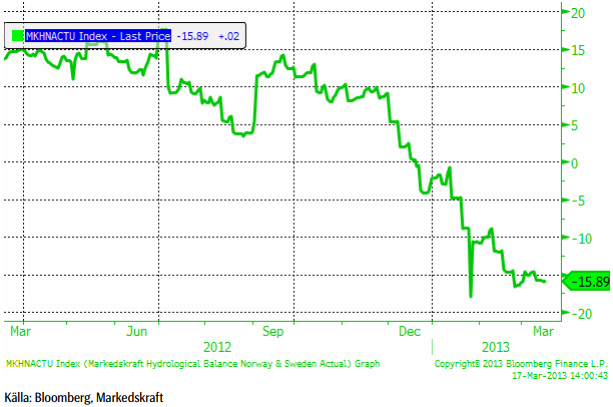
Sammanfattningsvis. En lite otydlig situation. Priset för tredje kvartalet börjar närma sig den föregående toppen vid 37.60. Det brukar kunna locka fram säljordrar. Att det tyska priset samtidigt fortsätt att falla är också ett negativt tecken. Att priset på el skulle vara högre i vattenkraftsrika Norden än i Tyskland hör till ovanligheterna även om det förekommit. Det är svårt att rekommendera köp just nu, så vi går över till neutral i avvaktan på att se om priset tar ut toppen på 37.60.
Naturgas
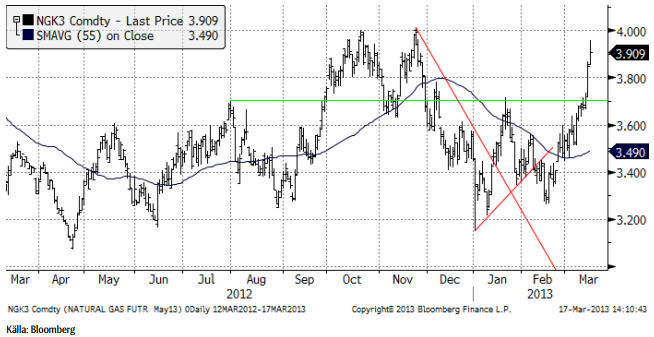
Naturgasterminen på NYMEX (maj 2013) har handlats upp ordentligt och närmar sig 4 dollar, där priset vänt ner två gånger tidigare. Vi fortsätter att hålla oss neutralt till naturgasen.
Guld & Silver
Guldpriset rekylerade upp i veckan som gick. Frågan är nu om den senaste månadens konsolidering kommer att följas av ytterligare prisfall – förbi 1550 eller om marknaden kommer att söka över 1600 och upp mot 1650?
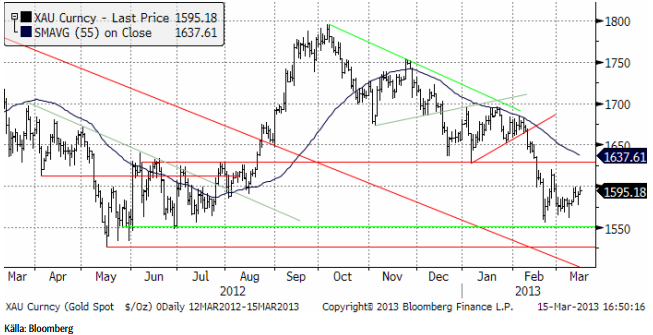
Situationen liknar den från 2008/09, när placerare sålde guld och köpte aktier. Vi har stora utflöden ur fonder med fysiskt guld. Samtidigt verkar guld bli mer populärt bland centralbanker. I veckan kom uppgifter om att den japanska centralbanken ska köpa mer guld. Det har i och för sig inte entydigt ett positivt signalvärde. Centralbanker storsålde under hela 70-talets guldprisuppgång. När de blev nettoköpare på 80-talet var boomen förbi. Konservativa och följande organisationer ligger alltså sent i cykeln – kanske så sent att de blir något av kontraindikatorer.
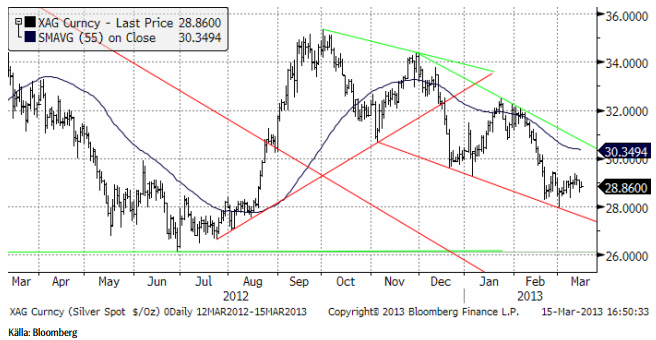
Nedan ser vi kursdiagrammet för silver i dollar per troy ounce. Även här har priset rört sig ”sidledes” den senaste månaden och bygger upp fallhöjd om priset ska följa den inslagna trenden nedåt.
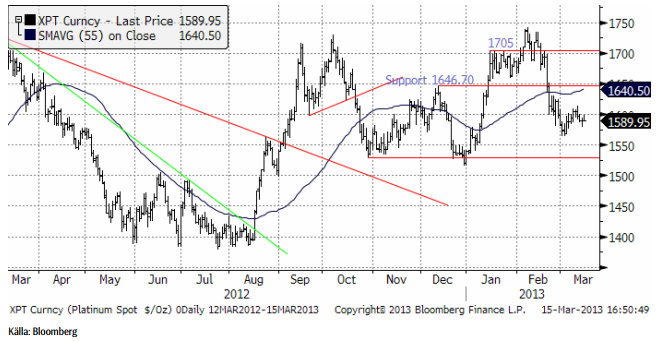
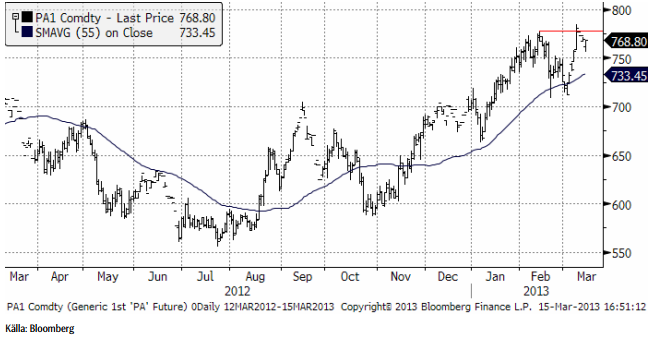
Platina & Palladium
Den sydafrikanska randen föll till nya bottennivåer mot dollarn i veckan som gick. Det ökar lönsamheten för de pressade gruvbolagen och tynger därmed priset på platina.
Palladium som rusade förrförra veckan, har konsoliderat sin uppgång. Det är förmodligen ingen dum idé att köpa palladium nu.
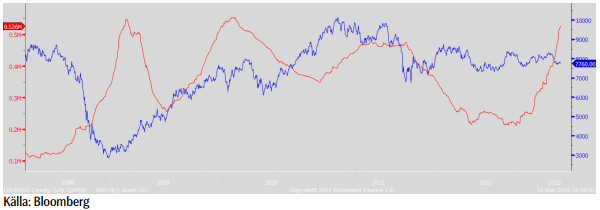
Koppar
Kopparpriset stabiliserades i veckan och noteras i skrivandes stund ca 1 % högre från veckostarten. Vi har i de senaste veckobreven uttryckt en viss försiktighet gentemot koppar med hänvisning till ett förväntat skifte, från en ”kronisk” marknad i underskott, till mer balanserad. En del tecken tyder på att utbudet nu verkligen ökar. Vi har poängterad en ökad contango (terminspremie) på de närmsta terminerna, ökade smältlöner (till förmån för smältverken, vilket indikerar ökat gruvutbud). LME-lagret är en annan indikation (se grafen nedan) som nu uppgår till 525 tton, den högsta nivån på nästa 3 år. Lagerförändringarna samvarierar ganska väl med importen till Kina (som vi skrev om förra veckan), vilket således också är en negativ indikation.
Koppar pris/lager (pris blå linje/LME-lager röd linje)
Den tekniska bilden ger stöd till vår neutrala position. Vi är positiva till basmetaller på sikt men avvaktar bättre köptillfällen på koppar, alternativt väljer någon annan basmetall. Den stora triangelformationen börjar spela ut sin roll. Stödnivåer noteras vid 7600 och 7400. Nivån 7800 fungerar nu som motstånd.
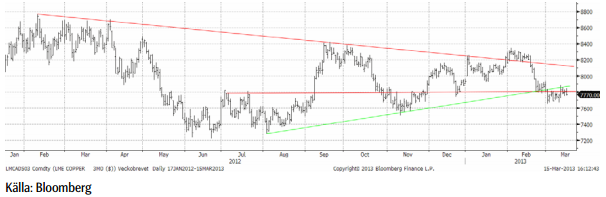
Vi ser inte den stora potentialen på koppar på uppsidan just nu. Vi rekommenderar därför en fortsatt neutral position. För den som vill satsa på ett starkare tillväxtscenario (än konsensus) i Kina är koppar däremot alltid ett intressant alternativ.
Aluminium
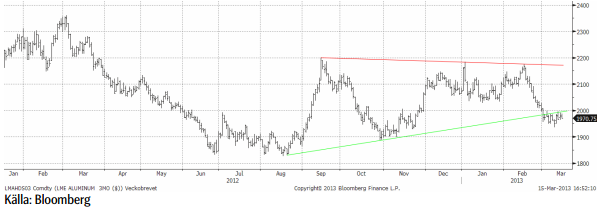
Aluminiumpriset har till stor del följt kopparn under veckan, som avslutas med en positiv veckoförändring på ca 1 %. Som vi skrivit tidigare ligger aluminium väldigt ”fast” i ett relativt stort handelsintervall. Nivåer kring $1800-1900 utgör ur ett kostnadsperspektiv starkt stöd. Samtidigt lägger det stora utbudet ett ”tak” på nivåer kring $2300. Den senaste uppgången i februari mötte stora säljordrar från producenter som passade på att ”låsa” framtida priser, vilket satte press på marknaden. Nu när priserna fallit tillbaka ser vi stora intressen från köpsidan (fysiska förbrukare). För den ”trading-benägne” utgör det stora spannet goda vinstmöjligheter.
P.g.a. den låga prisnivån i relation till marginalkostnaden är aluminium köpvärd och vi ansluter den till köprekommendationerna.
Zink
Även zinken återhämtade sig med övriga basmetaller under veckans inledning men slutar veckan i princip oförändrad. Tekniska fonder har varit säljare och tryckt tillbaka marknaden vid varje återhämtningsförsök. Priset är nu nere på nivåer då marknaden bör få stöd av förväntningar om minskat utbud. Priset skär ned i kostnadskurvan och producenterna med de högsta kostnaderna förväntas minska produktionen om priserna ligger kvar under en lägre tid. Frågan är hur lång tid det tar. Vid tidigare nedgångar har marknaden börjat diskontera utbudseffekten vilket ger stöd till priset.
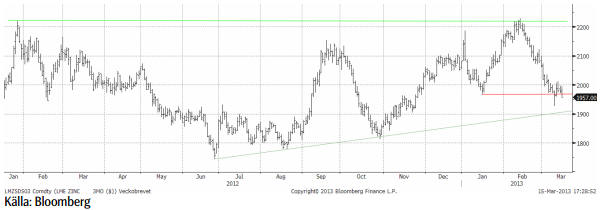
Tekniskt sett ser det svagt ut just nu och det finns risk för fortsatt press från tekniskt orienterade fonder. Det långsiktiga stödet kommer in kring $1900.
Placeringsförslaget från december med horisonten 3 månader kan summeras med en god utveckling inledningsvis. Under perioden steg priset till som högst $2250 (3 månaders LME). Vi är generellt positiva till basmetaller och återkommer eventuellt med ett nytt placeringsförslag på zink längre fram. Nu håller vi oss neutrala, och avvaktar i första hand utvecklingen nästa vecka.
Nickel
Efter den stora tillbakagången ser vi en tydlig stabilisering av priset. Ur ett kostnadsperspektiv börjar nickel bli en väldigt intressant köpkandidat. Marknaden är fortsatt tveksam till den fundamentala situationen. Vi har tidigare bl.a. hänvisat till kommentarer från fysiska aktörer som indikerar att ”det finns gott om nickel”, samtidigt som rapporter gör gällande att exporten av nickelmalm från Indonesien till Kina ökar igen, vilket riskerar att öka utbudet av s.k. Nickel Pig Iron i Kina (vilket i sin tur minskar efterfrågan på nickelbärande skrot och primärnickel). Det senare håller nu på att ”svänga om” då kinesiska producenter är snabba att ställa om produktionen. Det ger ett naturligt stöd till nickelmarknaden. Den tekniska bilden är väldigt tydlig, och marknaden vände ”där den skulle”. Priset är upp ca 3 % i veckan. Kortsiktigt finns risk/möjlighet för en tillbakagång. Om priset kommer ned mot $16500 igen är det köpläge.
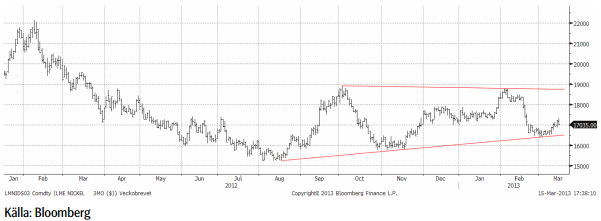
Vi rekommenderar köp av NICKEL S eller BULL NICKEL X2 / X4 S för den som vill ta mer risk. Vi varnade för en rekyl, och den kom. Priset har fallit mer än ”befarat”, men är nu på väldigt attraktiva nivåer.
Kaffe
Kaffepriset (maj 2013) bröt i fredags innan stängning under det tekniska stödet och stängde på 137.50 cent per pund. Den fallande trenden har alltså liksom vintern i Sverige, ännu övertaget. Många har liksom jag trott att priset skulle vända upp snabbare. Kortsiktigt kan de som tar sig ur positionerna för att inte små förluster ska utveckla sig till större, få priset att falla ytterligare. På längre sikt ”borde” priset finna en botten snart och handla högre. Osäkerheten gäller mer tajmingen på den botten.
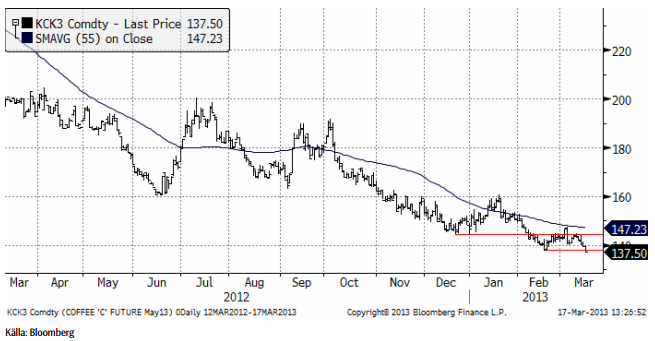
Vi går därmed över till neutral rekommendation på kaffe, eftersom vi befarar att det kan bli ytterligare prisnedgångar på kort sikt.
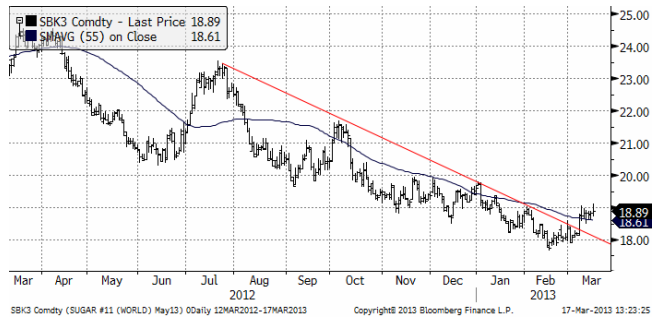
Socker
Sockerpriset (maj 2013) som brutit den nedåtgående trenden rent tekniskt fortsätter att testa 19 cent. I fredags försökte marknaden handla upp priset, men när dagen var slut stängde priset på 18.89 cent per pund. Vi har tidigare skrivit att priset på etanol i Brasilien har gått upp – vilket drar med sig priset på socker. Under majs (nedan) ser vi också att priset på etanol i USA har stigit stadigt, vilket är en faktor bakom stödet för majspriset. Det är också en stödjande faktor för sockerpriset.
Brasiliens regering vill öka användningen av etanol som drivmedel i landet. Många bilar i landet går att köra på både bensin och etanol, men priserna har varit sådana att folk har valt att tanka med bensin. Den ökade fokuseringen på etanol har fått priset att stiga, som vi ser i nedanstående diagram, som visar etanolpriset i Sao Paulo i USD per liter. Den blå linjen är priset på socker i samma delstat.
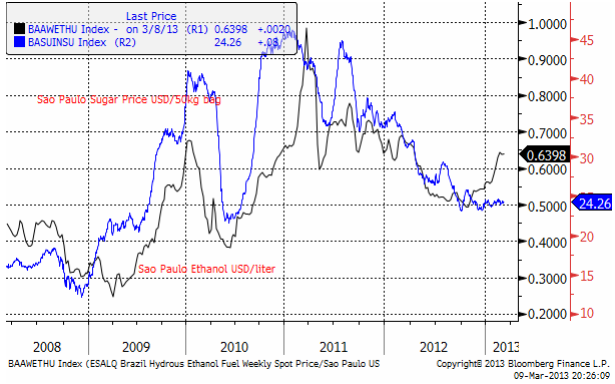
Vi ser att de två linjerna tenderar att hänga ihop och en uppgång i priset på etanol kan signalera att priset på socker också kommer att stiga framöver.
Finns tecken på att priset på socker är nära botten, men än så länge är pristrenden så stark att vi väljer att behålla neutral rekommendation ytterligare en vecka.
Vi tror att en trendvändning kan vara på gång. Prisuppgången till 19 cent, ett motstånd, är ett observandum.
[box]SEB Veckobrev Veckans råvarukommentar är producerat av SEB Merchant Banking och publiceras i samarbete och med tillstånd på Råvarumarknaden.se[/box]
Disclaimer
The information in this document has been compiled by SEB Merchant Banking, a division within Skandinaviska Enskilda Banken AB (publ) (“SEB”).
Opinions contained in this report represent the bank’s present opinion only and are subject to change without notice. All information contained in this report has been compiled in good faith from sources believed to be reliable. However, no representation or warranty, expressed or implied, is made with respect to the completeness or accuracy of its contents and the information is not to be relied upon as authoritative. Anyone considering taking actions based upon the content of this document is urged to base his or her investment decisions upon such investigations as he or she deems necessary. This document is being provided as information only, and no specific actions are being solicited as a result of it; to the extent permitted by law, no liability whatsoever is accepted for any direct or consequential loss arising from use of this document or its contents.
About SEB
SEB is a public company incorporated in Stockholm, Sweden, with limited liability. It is a participant at major Nordic and other European Regulated Markets and Multilateral Trading Facilities (as well as some non-European equivalent markets) for trading in financial instruments, such as markets operated by NASDAQ OMX, NYSE Euronext, London Stock Exchange, Deutsche Börse, Swiss Exchanges, Turquoise and Chi-X. SEB is authorized and regulated by Finansinspektionen in Sweden; it is authorized and subject to limited regulation by the Financial Services Authority for the conduct of designated investment business in the UK, and is subject to the provisions of relevant regulators in all other jurisdictions where SEB conducts operations. SEB Merchant Banking. All rights reserved.

Market is starting to take US/Iran headlines with a pinch of salt. Brent crude rose $2.8/b yesterday to an official close of $112.1/b. But after that it traded as low as $108.05/b before ending late night at around $109.7/b. Through the day it traded in a range of $106.87 – 112.72/b amid a flurry of news or rumors from Iran and the US. ”US temporary sanctions during negotiations” (falls alarm). ”We will bomb Iran” (not anyhow),… etc. While the market is still fluctuating to this kind of news flow, it is starting to take such headlines with a pinch of salt.

We’ll see. Maybe, maybe not. The Brent M1 contract is trading at $110.2/b this morning which very close to the average ticks through yesterday of $110.4/b.
Trump with bearish, verbal intervention whenever Brent trades above $110/b it seems. What seems to be a pattern is that Trump states something like ”very good negotiations going on with Iran”, ”New leaders in Iran are great,..”, ”Great progress in negotiations,…”, ”Deal in sight,..” etc whenever the Brent M1 contract trades above $110/b. An effort to cool the market. These hot air verbal interventions from Trump used to have a heavy bearish impact on prices, but they now seems to have less and less effect unless they are backed by reality.
As far as we can see there has been no real progress in the negotiations between the US and Iran with both sides still standing by their previous demands.
Iran is getting stronger while the cease fire lasts making a return to war for Trump yet harder. Iran is naturally in constant preparation for a return to war given Trump’s steady threats of bombing Iran again. Iran is naturally doing what ever is possible to prepare for a return to war. And every day the cease fire lasts it is better prepared. This naturally makes it more and more difficult and dangerous for the US to return to warring activity versus Iran as the consequences for energy infrastructure in the Persian Gulf will be more and more severe the longer the cease fire lasts. Israel seems to see it this way as well. That the war is not won and that current frozen state of a cease fire gives Iran opportunity to rebuild military and politically.
Global inventories are drawing down day by day. How much? In the meantime the Strait of Hormuz stays closed. There is varying measures and estimates of how much global inventories are drawing down. Our rough estimate, back of the envelope, is that global inventories are drawing down by at least some 10 mb/d or about 300 mb/d in a balance between loss of supply versus demand destruction. Other estimates we see are a monthly draw of 250-270 mb/d. The IEA only ’measured’ a draw in global observable stocks of 117 mb in April with oil on water rising 53 mb while on shore stocks fell 170 mb. But global stocks are hard to measure with large invisible, unmeasured stocks. As such a back of the envelope approach may be better.
Oil products is what the world is consuming. Oil product prices likely to rise while product stocks fall. Strategic Petroleum Reserves (SPR) are predominantly crude oil. Discharging oil from OECD SPR stocks, a sharp reduction in Chinese crude imports and a reduction in global refinery throughput of 6-7 mb/d has helped to keep crude oil markets satisfactorily supplied. But global inventories are drawing down none the less. And oil products is really what the world is consuming. So if global refinery throughput stays subdued, then demand will eventually have to match the supply of oil products. The likely path forward this summer is a steady draw down in jet fuel, diesel and gasoline. Higher prices for these. Then, if possible, higher refinery throughput and higher usage of crude in response to very profitable refinery margins. And lastly sharper draw in crude stocks and higher prices for these. But some 6 mb/d of oil products used to be exported through the Strait of Hormuz. And it may not be so easy to ramp up refinery activity across the world to compensate. Especially as Ukraine continues to damage Russian refineries as well as Russian crude production and export facilities.
Watch oil product stocks and prices as well as Brent calendar 2027. What to watch for this summer is thus oil product inventories falling and oil product premiums to crude rising. Another measure to watch is the Brent crude 2027 contract as it rises steadily day by day as the Strait of Hormuz stays closed and global oil inventories decline. The latter is close to the highest level since the start of the war and keeps rising.
The Brent M1 contract and the Brent 2027 prices and current price of jet fuel in Europe (ARA). All in USD/b

Our back of the envelope calculation of the global shortage created by the closure of the Strait of Hormuz. Note that 3.5 mb/d of discharge from SPR is also a draw. Note also that ’Forced demand loss’ of 2.5 mb/d is probably temporary and will fall back towards zero as logistics are sorted out leaving ’Price demand loss’ to do the job of balancing the market. Thus a shortfall of at least 9 mb/d created by the closure. More if SPR discharge is included and more if Forced demand loss recedes.

Brent is climbing higher. Front-month is at USD 106.3/bl this morning, close to a weekly high and a USD 9/bl jump from Mondays open. This is the move we flagged as a risk earlier in the week: the market shifting from ”a deal is around the corner” to ”this is going to take longer than we thought”.

Analyst Commodities, SEB
During April, rest-of-year Brent remained remarkably stable around USD 90/bl. A stability which rested on one single assumption: the SoH reopens around 1 May. That assumption is now slowly falling apart.
As we highlighted yesterday: every week of delay beyond 1 May adds (theoretically) ish USD 5/bl to the rest-of-year average, as global inventories draw 100 million barrels per week. i.e., a mid-May reopening implies rest-of-year Brent closer to USD 100/bl, and anything pushing into June or July takes us meaningfully higher.
What’s changed in the last 48 hours:
#1: The US military has formally warned that clearing suspected sea mines from SoH could take up to six months. That is a completely different timescale from what the financial market is pricing. Even a political deal tomorrow does not immediately reopen the strait.
#2: Trump has shifted his tone from urgency to ”strategic patience”. In yesterday’s press conference: ”Don’t rush me… I want a great deal.” The market is reading this as a president no longer feeling pressured by timelines, with the naval blockade running in the background.
#3: So far, the military activity is escalating, not de-escalating. Axios reports Iran is laying more mines in SoH. The US 3rd carrier strike group (USS George H.W. Bush) is arriving with two countermine vessels. Trump yesterday ordered the US Navy to destroy any Iranian boats caught laying mines. While CNN reports that the Pentagon is actively drawing up plans to strike Iranian SoH capabilities and individual Iranian military leaders if the ceasefire collapses. i.e., NOT a attitude consistent with an imminent deal!
Spot crude and product prices eased off the early-April highs on a combination of system rerouting and deal optimism. Both now weakening. Goldman estimates April Gulf output is reduced by 14.5 mbl/d, or 57% of pre-war supply, a number that keeps getting worse the longer this drags on.
Demand-side adaptation is ongoing: S. Korea has cut its Middle East crude dependence from 69% to 56% by pulling more from the Americas and Africa, and Japan is kicking off a second round of SPR releases from 1 May. But SPRs are finite.
Ref. to the negotiations, we should not bet on speed. The current Iranian leadership is dominated by genuine hardliners willing to absorb economic pain and run the clock to extract concessions. That is not a setup for a rapid resolution. US/Israeli media briefings keep framing the delay as ”internal Iranian divisions”, the reality is more complicated and points toward weeks and months, not days.
Our point is that the complexity is large, and higher prices have only just started (given a scenario where the negotiations drag out in time). The market spent April leaning on the USD 90/bl rest-of-year assumption; that case is diminishing by the hour. If ”early May reopening” is replaced by ”June, July or later” over the next week or two, both crude and products have meaningful room to reprice higher from here. There is a high risk being short energy and betting on any immediate political resolution(!).
Down on Friday. Up on Monday. The Brent June crude oil contract traded down 5.1% last week to a close of $90.38/b. It reached a high of $103.87/b last Monday and a low of $86.09/b on Friday as Iran announced that the Strait of Hormuz was fully open for transit. That quickly changed over the weekend as the US upheld its blockade of Iranian oil exports while Iran naturally responded by closing the SoH again. The US blew a hole in the engine room of the Iranian ship TOUSKA and took custody of the ship on Sunday. Brent crude is up 5.6% this morning to $95.4/b.
The cease-fire is expiring tomorrow. The US has said it will send a delegation for a second round of negotiations in Islamabad in Pakistan. But Iran has for now rejected a second round of talks as it views US demands as unrealistic and excessive while the US is also blocking the Strait of Hormuz.
While Brent is up 5% this morning, the financial market is still very optimistic that progress will be made. That talks will continue and that the SoH will fully open by the start of May which is consistent with a rest-of-year average Brent crude oil price of around $90/b with the market now trading that balance at around $88/b.
Financial optimism vs. physical deterioration. We have a divergence where the financial market is trading negotiations, improvements and resolution while at the same time the physical market is deteriorating day by day. Physical oil flows remain constrained by disrupted flows, longer voyage times and elevated freight and insurance costs.
Financial markets are betting that a US/Iranian resolution will save us in time from violent shortages down the road. But every day that the SoH remains closed is bringing us closer to a potentially very painful point of shortages and much higher prices.
The US blockade is also a weapon of leverage against its European and Asian allies. When Iran closed the SoH it held the world economy as a hostage against the US. The US blockade of the SoH is of course blocking Iranian oil exports. But it is also an action of disruption directed towards Europe and Asia. The US has called for the rest of the world to engaged in the war with Iran: ”If you want oil from the Persian Gulf, then go and get it”. A risk is that the US plays brinkmanship with the global oil market directed towards its European and Asian allies and maybe even towards China to force them to engage and take part. Maybe unthinkable. But unthinkable has become the norm with Trump in the White House.


Oil product price pain is set to rise as the Strait of Hormuz stays closed into summer

Solkraften pressar elpriserna dagtid

Michel Gubel ger sin syn på oljemarknaden


