

Analys
SEB – Råvarukommentarer, 17 mars 2014

Rekommendationer
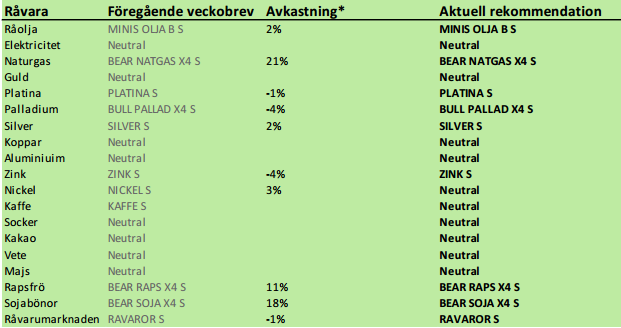
Kort sammanfattning
Råvarumarknaderna var relativt stökiga förra veckan. Koppar inledde veckan med att falla kraftigt, liksom zink. Vetepriset i USA steg med 6%, men backade med 2% i Europa. I Europa, som var soligt och varmt, men nederbördsrikt i svensk/norska fjällen, föll elpriset kraftigt och noterade en ny kontraktslägsta för det tredje kvartalet. Globalt odlingsväder har slagit om från torrt i Syd- och Nordamerika till ordentligt vått och ”rain makes grain”. Sockerpriset föll mot slutet av förra veckan och kaffepriset ser ut att vilja hänga på.
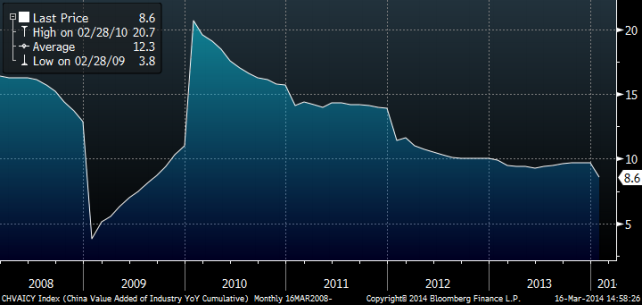
Kinas industriproduktion föll till 8.6% i årstakt i februari enligt statisktik som publicerades i torsdags. Det är ännu en bekräftelse på att landets ekonomi har problem och därmed har de flesta råvarumarknader problem. I diagrammet nedan ser vi förändringen i industriproduktion i Kina på årstakt sedan 2008.
Mot slutet av veckan kom nyheten att Kinas centralbank vidgar intervallet för den kinesiska valutan. Vi tolkar det som en önskan om svagare valuta och alltså en devalvering. Därmed sällar sig Kina till alla länder som vill devalvera sina valutor, dvs öka penningmängden. Det är positivt för ädelmetallerna.
Råolja – Brent
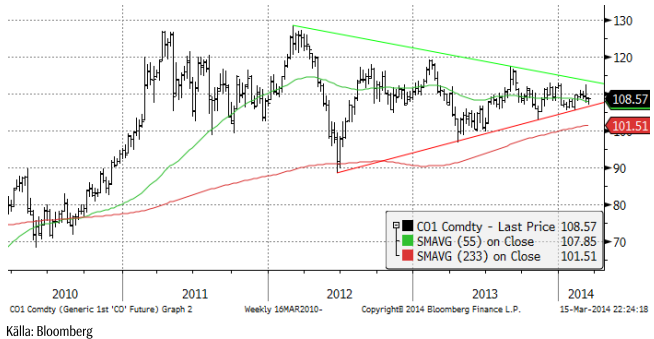
Oljepriset sjönk under lugn handel i veckan från 109 till 108.57 dollar per fat. Vi tror att det är lugnet före stormen, när oljepriset bryter stödet i den stora triangelformation som marknaden handlar inom.
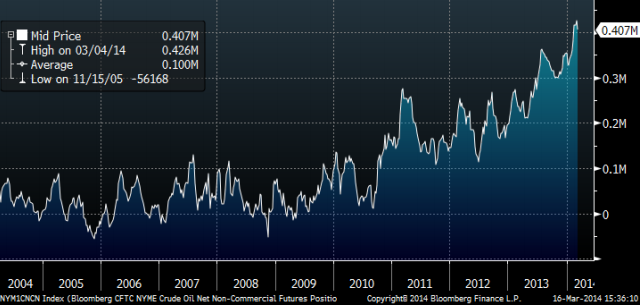
Non-commercials (investerare) är rekordköpta terminskontrakt på NYMEX i New York, enligt CFTC:s rapport i fredags. De äger terminskontrakt för 407 miljoner fat olja. År 2010 var de nästan inte köpta olja alls. Tänk om sentimentet ändrar sig!!!
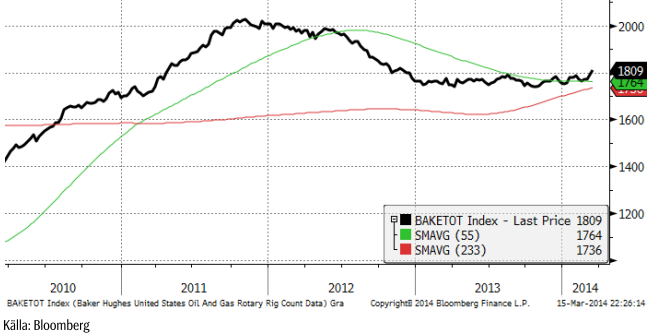
Antalet borr-riggar i USA steg i veckan till 1809 (förra veckan 1792) stycken enligt Baker Hughes. Det är återigen en ökning och bekräftar den trend vi skrev om förra veckan. Skifferboomen i USA har fått ny fart och kommer att resultera i en ännu högre produktionsökning i USA.
Årets lägsta oljepris brukar noteras i april. Förra året var det 97 dollar. I år är marknaden väsentligt svagare. Därför tror vi att priset kommer att gå ännu längre ner, kanske till 95 dollar.
Vi rekommenderar en kort position i olja, t ex med MINIS OLJA B S eller MINIS OLJA A S.
Elektricitet
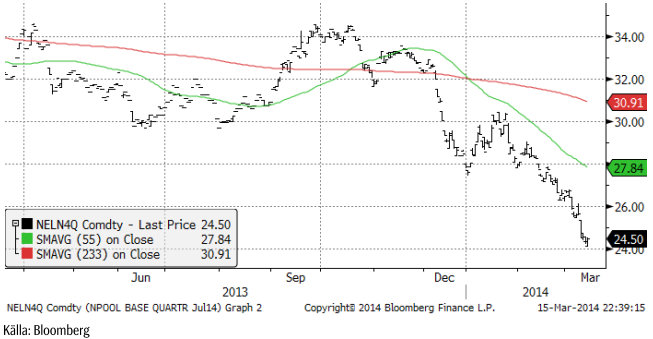
Kvartal tre fortsatte falla, och nådde nästan ner till 24 euro per MWh. Varmt väder, en prognos om rikligt med nederbörd över svensk/norska fjälltrakten och ett prisfall på 7% i utsläppsrätterna bidrog till prisfallet.
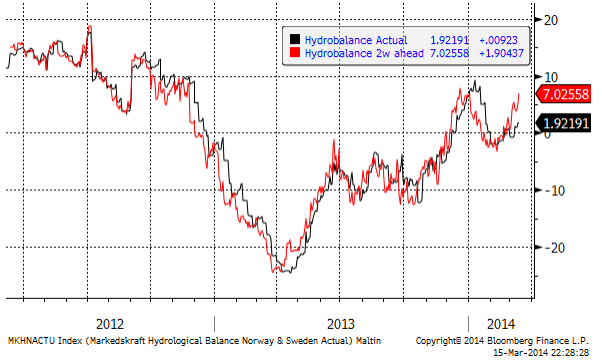
2 veckors prognos för hydrologisk balans har stigit till +7 TWh (förra veckan +5 TWh).
Priset på kol är det enda som visar styrka just nu. EU importerar kol från Ryssland och det kan vara det som påverkar priset, liksom det kan ha gjort för palladium och nickel. 80 dollar är en viktig stödnivå och det är viktigt att den inte bryts.
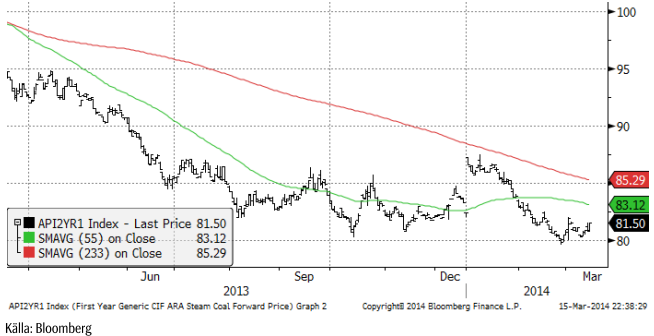
Vi fortsätter med neutral rekommendation. Trenden är tydligt nedåtriktad, men priset är mycket lågt och söker en botten.
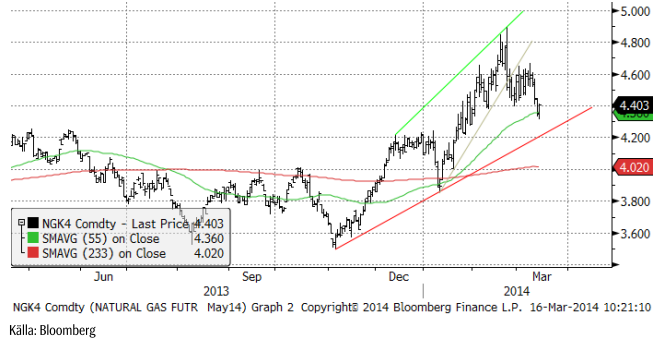
Naturgas
Förra veckan rekommenderade vi köp av BEAR NATGAS X4 S mot bakgrund av att priset stigit en längre tid på det kalla vädret i USA och att varmt väder nu ”borde” komma in i prognosfönstret. Samtidigt såg vi att antalet borr-riggar återigen ökar tydligt och de flesta av dem producerar gas. Japan drar igång sina kärnkraftverk nu och slutar därmed att importera LNG. Det har talats om, bland annat i en annons i New York Times i fredags som en privatperson (!) satt in med anledning av krisen i Ukraina, att EU skulle importera LNG från USA. Om det sker, som en del i det ”paket” som EU och USA ställer upp mot Ryssland efter söndagens ”val” i södra Ukraina, kan det verka stödjande på priset, men annars bör priset i första hand falla ner mot 4.30 – 4.20 dollar per MMBtu. Vi fortsätter med säljrekommendation och behåller BEAR NATGAS X4 S.
Koppar
Den väsentligt svagare industrikonjunkturen i Kina oroar. Priset på koppar har rasat med 13% hittills i år till den lägsta nivån sedan sommaren 2010. I ett tidigare veckobrev för någon tid sedan visade vi produktionskostnaden för Codelco, som är världens ledande producent av koppar. Den låg då ca 10% under priset och det senaste prisfallet bör alltså nu innebära att Codelco inte går runt. Det innebär att utbudet av koppar från nya gruvor kommer att minska på lite längre sikt, men på kort sikt kan priset gå under produktionskostnaden.
Värt att notera är dock att lagren vid LME fortfarande inte visar några tecken på att stiga utan fortsätter att falla.
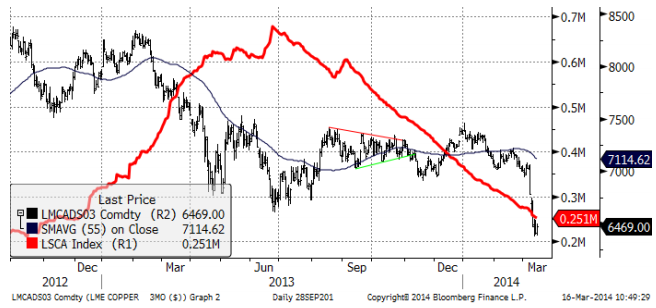
Vi rekommenderar neutral position i koppar.
Aluminium
Aluminiumpriset påverkades av svagheten i kopparmarknaden, men tycks än så länge ha det mest mesta bakom sig.
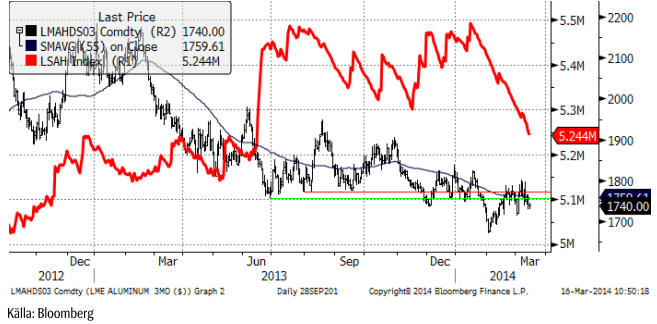
Vi fortsätter med neutral rekommendation på aluminium.
Zink
Zinkrpriset har fallit hela vägen tillbaka från toppen vid 2150. Priset är nu vid ett tekniskt stödområde och vi tror att det är ett bra tillfälle att köpa zink vid.
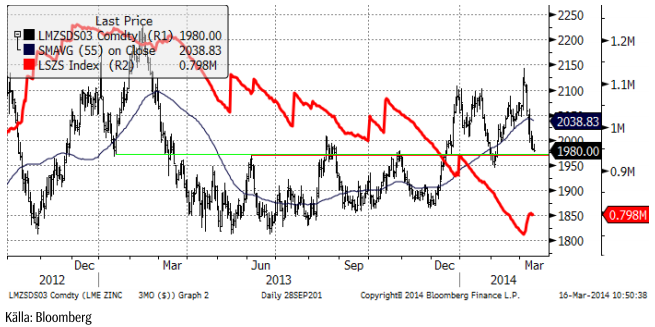
Vi rekommenderar köp av ZINK S eller BULL ZINK X4 S.
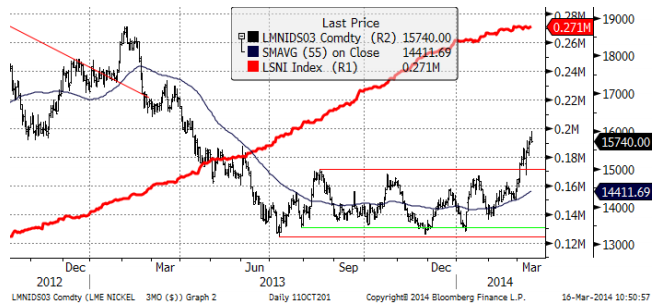
Nickel
Nickel har till skillnad från de andra basmetallerna stigit i veckan. Som vi skrivit tidigare gynnas nickelpriset av oron för Rysslands/Ukraina-krisen. Priset har dock kommit upp till 16,000 dollar och det är en motståndsnivå, där t ex marknaden fann en botten i slutet av år 2012. Vi rekommenderar därför att man går ur långa positioner nu och lägger sig neutral.
Guld
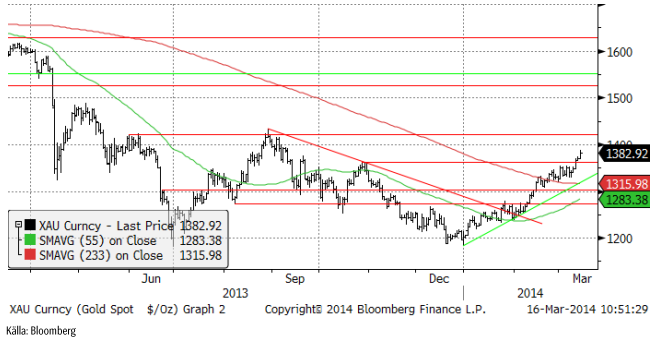
I takt med att tillväxten tvekar såväl i Kina som i USA leder det till ökade förväntningar på monetär stimulans i Kina och mindre avtrappning av den monetära stimulansen i USA. Sådana uttalanden har också kommit från FED, bland annat att takten på ”tapering” kan diskuteras. Konflikten mellan Ryssland och Ukraina och EU:s och USA:s kostnader för att handskas med detta bidrar också till att ge stöd till guldpriset. Oron för en extrem upptrappning av konflikten, även om den har liten sannolikhet påverkar också guldpriset positivt. Guldpriset är känsligt för ändringar i sannolikheten för extrema händelser av den karaktären.
Med det sagt, börjar ändå guldpriset nå upp till tekniska motstånd. Den första passerades utan större bekymmer i veckan, men den andra vid strax över 1400 dollar kan bli svårare.
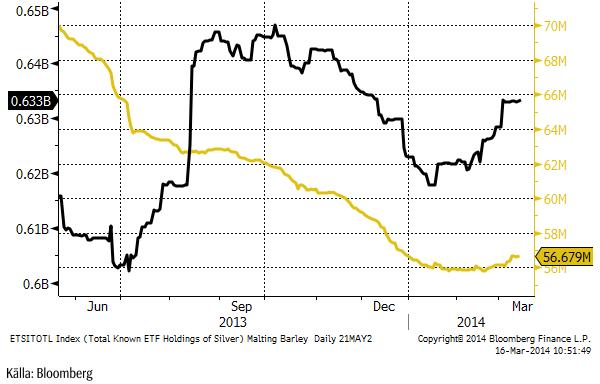
Nu har institutionella placerare börjat köpa guldfonder igen! Den gula kurvan visar antal miljoner uns som ägs via börshandlade fonder/certifikat/depåbevis. Innehaven i silver, den svarta kurvan, har ökat kraftigt sedan början av året, men förblivit oförändrad den senaste tiden.
Vi fortsätter tills vidare med neutral vy på guld. Vi skulle vilja köpa om det kommer en rekyl.
Silver
Silverpriset steg även det lite grand i veckan men befinner sig alltjämt mellan 20.50 och 22. Ett brott på uppsidan av 22 ger en teknisk köpsignal om den skulle inträffa. Det finns just nu ingen trend i silverpriset.
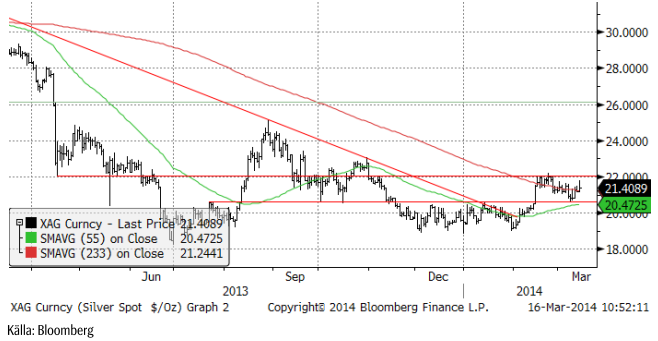
Nedan ser vi guldpriset angivet i silver (istället för dollar). Vi ser att guld är relativt dyrt i förhållande till silver, såväl i det korta perspektivet som i det långa. Vi föredrar därför att köpa silver, hellre än guld, men silverpriset ligger, som vi nämnde, fast under ett tekniskt motstånd på 22 dollar.
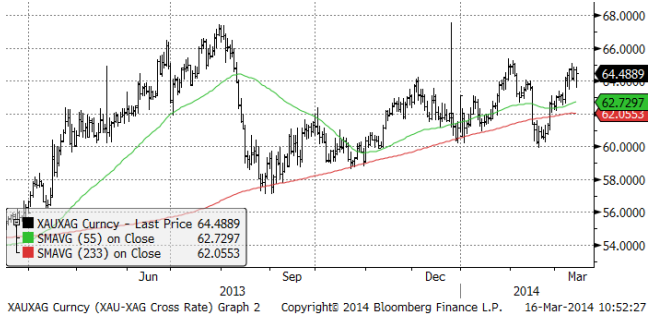
Vi anser att silver är mer köpvärt än guld och skulle vilja köpa på de här nivåerna, i synnerhet efter den rekyl som inträffat de senaste veckorna.
Platina & Palladium
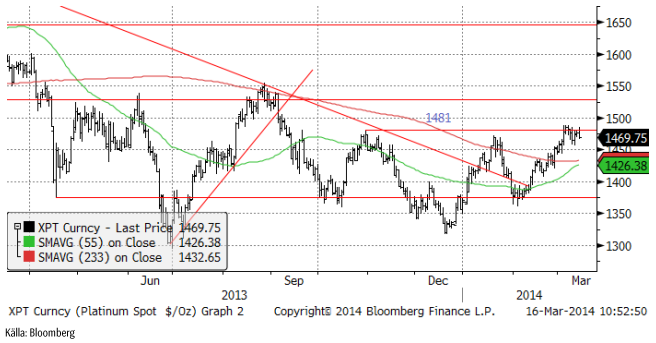
Platina har problem att gå över det tekniska motståndet på 1481 dollar. Den senaste utvecklingen antyder att det finns en risk för en rekyl nedåt.
Palladiumpriset tog en paus efter utbrottet förra veckan. Det är ett vanligt marknadsbeteende och man kan dessutom då och då se en rekyl ner tillbaka till utbrottsnivån. Vi tror att palladiumpriset kan stå inför en större prisrörelse uppåt och väntar oss att se bekräftelser på det först genom att passera 785 dollar som var toppnoteringen under 2013.
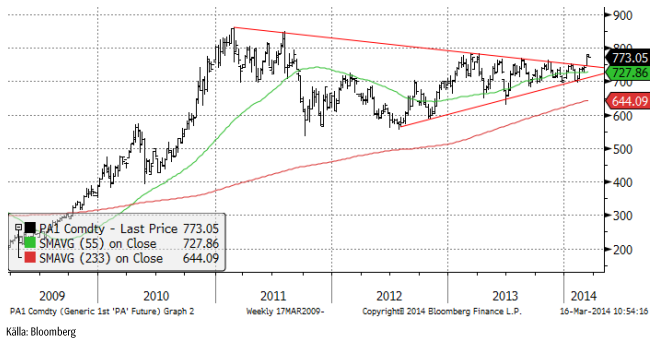
Vi rekommenderar alltså en neutral position i platina och en köpt position i palladium.
Kaffe
Torkan i Brasilien är av allt att döma slut. Det har regnat i veckan som gått. Prognosen från GFS-modellen för de kommande två veckorna visar onormalt mycket nederbörd över Minas Gerais. Allra mest väntas falla över den södra delen, där kaffeproduktionen är som mest intensiv.
Tekniskt noterar vi att priset har brutit stödet för den allra mest intensiva uppgången, vilket signalerar en förestående rekyl. Tekniskt stöd finns i första hand på ca 180 cent.
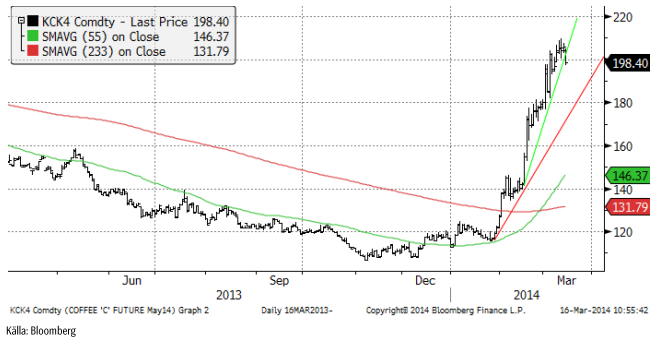
Vi rekommenderar neutral position i kaffe, eller möjligtvis en mycket kortsiktig kort position.
Kakao
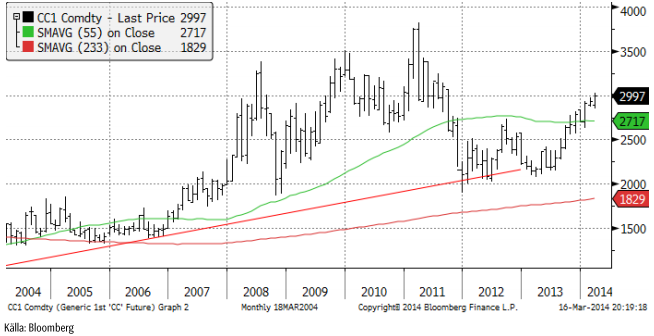
Priset på kakao i New York har gått upp från 2709 dollar per ton till 2997 sedan årsskiftet, alltså plus 10%. Uppgången är framförallt driven av en stark efterfrågan. Som vi ser i diagrammet nedan är priset på kakao återigen uppe vid 3000 dollar per ton, som är den nivå som priserna pendlade kring vid slutet av 00-talets råvaruboom åren 2009 – 2011. Det är möjligt att priset kan gå högre, men uppgångens momentum bör mattas av på de nuvarande höga nivåerna.
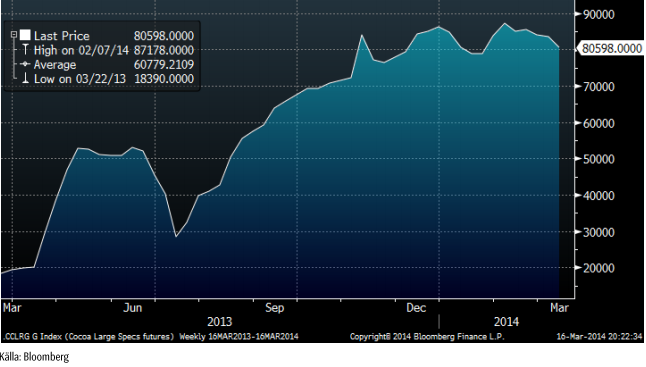
Kakaoterminsmarknaden präglas av en stor kort position i producentledet. Enligt fredagens Commitment of Traders – rapport från CFTC, som visar läget per i tisdags, var producenter korta över 90,000 kontrakt i det amerikanska kontraktet på kakao. Investerare var köpta 80,598 kontrakt. Investerarkategorin har börjat minska sin köpta position, som vi ser i diagrammet nedan. Alla tester visar att kausaliteten går från prisrörelse till agerande hos investerare och inte tvärt om, men bilden visar i vart fall att det positiva sentimentet hos aktörer som inte enbart är ute efter att bli av med risk, utan på att försöka förutspå prisutvecklingen, har blivit lite mindre positivt (även om de fortfarande är mycket positiva).
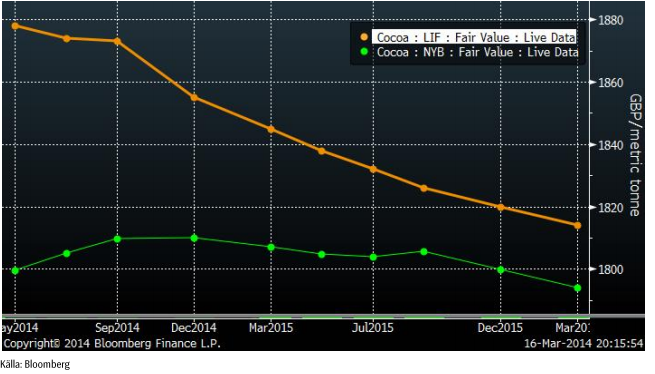
Kakaoterminerna på LIFFE i London handlas normalt sett högre än terminerna på NYBOT i New York. I diagrammet nedan har vi kvoten mellan London-kakao och New York-kakao, omräknat till brittiska pund per ton. Det är spotkontraktet vi ser.
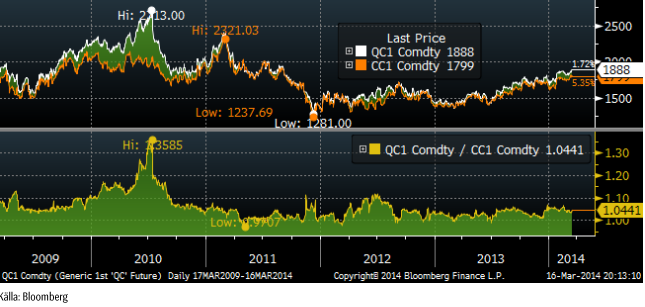
Öppen balans är ungefär lika stor för både LIFFE och NYBOT, men NYBOT har nästan hela sin handel frontmånadskontraktet, vilket återspeglar positioner från indexfonder, som har valt det kontraktet och inte London-kontraktet. Londonkontraktet har en mer spridd handel och används av företag i Europa för prissäkring. Vi ser också att det råder contango i NYBOT-kontraktet för korta löptider (kanske pga long-only-indexfonder) medan det är backwardation i London-kontraktet. Även kakao följer alltså samma mönster som t ex vete, där det råder contango i USA, men backwardation i Europa.
Vi rekommenderar en neutral position vid dagens situation.
[box]SEB Veckobrev Veckans råvarukommentar är producerat av SEB Merchant Banking och publiceras i samarbete och med tillstånd på Råvarumarknaden.se[/box]
Disclaimer
The information in this document has been compiled by SEB Merchant Banking, a division within Skandinaviska Enskilda Banken AB (publ) (“SEB”).
Opinions contained in this report represent the bank’s present opinion only and are subject to change without notice. All information contained in this report has been compiled in good faith from sources believed to be reliable. However, no representation or warranty, expressed or implied, is made with respect to the completeness or accuracy of its contents and the information is not to be relied upon as authoritative. Anyone considering taking actions based upon the content of this document is urged to base his or her investment decisions upon such investigations as he or she deems necessary. This document is being provided as information only, and no specific actions are being solicited as a result of it; to the extent permitted by law, no liability whatsoever is accepted for any direct or consequential loss arising from use of this document or its contents.
About SEB
SEB is a public company incorporated in Stockholm, Sweden, with limited liability. It is a participant at major Nordic and other European Regulated Markets and Multilateral Trading Facilities (as well as some non-European equivalent markets) for trading in financial instruments, such as markets operated by NASDAQ OMX, NYSE Euronext, London Stock Exchange, Deutsche Börse, Swiss Exchanges, Turquoise and Chi-X. SEB is authorized and regulated by Finansinspektionen in Sweden; it is authorized and subject to limited regulation by the Financial Services Authority for the conduct of designated investment business in the UK, and is subject to the provisions of relevant regulators in all other jurisdictions where SEB conducts operations. SEB Merchant Banking. All rights reserved.

Down 4.4% last week with more from OPEC+, a possible truce in Ukraine and weak US data. Brent crude fell 4.4% last week with a close of the week of USD 66.59/b and a range of USD 65.53-69.98/b. Three bearish drivers were at work. One was the decision by OPEC+ V8 to lift its quotas by 547 kb/d in September and thus a full unwind of the 2.2 mb/d of voluntary cuts. The second was the announcement that Trump and Putin will meet on Friday 15 August to discuss the potential for cease fire in Ukraine (without Ukraine). I.e. no immediate new sanctions towards Russia and no secondary sanctions on buyers of Russian oil to any degree that matters for the oil price. The third was the latest disappointing US macro data which indicates that Trump’s tariffs are starting to bite. Brent is down another 1% this morning trading close to USD 66/b. Hopes for a truce on the horizon in Ukraine as Putin meets with Trump in Alaska in Friday 15, is inching oil lower this morning.

Trump – Putin meets in Alaska. The potential start of a process. No disruption of Russian oil in sight. Trump has invited Putin to Alaska on 15 August to discuss Ukraine. The first such invitation since 2007. Ukraine not being present is bad news for Ukraine. Trump has already suggested ”swapping of territory”. This is not a deal which will be closed on Friday. But rather a start of a process. But Trump is very, very unlikely to slap sanctions on Russian oil while this process is ongoing. I.e. no disruption of Russian oil in sight.
What OPEC+ is doing, what it is saying and what we are hearing. OPEC+ V8 is done unwinding its 2.2 mb/d in September. It doesn’t mean production will increase equally much. Since it started the unwind and up to July (to when we have production data), the increase in quotas has gone up by 1.4 mb/d, while actual production has gone up by less than 0.7 mb/d. Some in the V8 group are unable to increase while others, like Russia and Iraq are paying down previous excess production debt. Russia and Iraq shouldn’t increase production before Jan and Mar next year respectively.
We know that OPEC+ has spare capacity which it will deploy back into the market at some point in time. And with the accelerated time-line for the redeployment of the 2.2 mb/d voluntary cuts it looks like it is happening fast. Faster than we had expected and faster than OPEC+ V8 previously announced.
As bystanders and watchers of the oil market we naturally combine our knowledge of their surplus spare capacity with their accelerated quota unwind and the combination of that is naturally bearish. Amid this we are not really able to hear or believe OPEC+ when they say that they are ready to cut again if needed. Instead we are kind of drowning our selves out in a combo of ”surplus spare capacity” and ”rapid unwind” to conclude that we are now on a highway to a bear market where OPEC+ closes its eyes to price and blindly takes back market share whatever it costs. But that is not what the group is saying. Maybe we should listen a little.
That doesn’t mean we are bullish for oil in 2026. But we may not be on a ”highway to bear market” either where OPEC+ is blind to the price.
Saudi OSPs to Asia in September at third highest since Feb 2024. Saudi Arabia lifted its official selling prices to Asia for September to the third highest since February 2024. That is not a sign that Saudi Arabia is pushing oil out the door at any cost.
Saudi Arabia OSPs to Asia in September at third highest since Feb 2024

Lower as OPEC+ keeps fast-tracking redeployment of previous cuts. Brent closed down 1.3% yesterday to USD 68.76/b on the back of the news over the weekend that OPEC+ (V8) lifted its quota by 547 kb/d for September. Intraday it traded to a low of USD 68.0/b but then pushed higher as Trump threatened to slap sanctions on India if it continues to buy loads of Russian oil. An effort by Donald Trump to force Putin to a truce in Ukraine. This morning it is trading down 0.6% at USD 68.3/b which is just USD 1.3/b below its July average.
Only US shale can hand back the market share which OPEC+ is after. The overall picture in the oil market today and the coming 18 months is that OPEC+ is in the process of taking back market share which it lost over the past years in exchange for higher prices. There is only one source of oil supply which has sufficient reactivity and that is US shale. Average liquids production in the US is set to average 23.1 mb/d in 2025 which is up a whooping 3.4 mb/d since 2021 while it is only up 280 kb/d versus 2024.
Taking back market share is usually a messy business involving a deep trough in prices and significant economic pain for the involved parties. The original plan of OPEC+ (V8) was to tip-toe the 2.2 mb/d cuts gradually back into the market over the course to December 2026. Hoping that robust demand growth and slower non-OPEC+ supply growth would make room for the re-deployment without pushing oil prices down too much.
From tip-toing to fast-tracking. Though still not full aggression. US trade war, weaker global growth outlook and Trump insisting on a lower oil price, and persistent robust non-OPEC+ supply growth changed their minds. Now it is much more fast-track with the re-deployment of the 2.2 mb/d done already by September this year. Though with some adjustments. Lifting quotas is not immediately the same as lifting production as Russia and Iraq first have to pay down their production debt. The OPEC+ organization is also holding the door open for production cuts if need be. And the group is not blasting the market with oil. So far it has all been very orderly with limited impact on prices. Despite the fast-tracking.
The overall process is nonetheless still to take back market share. And that won’t be without pain. The good news for OPEC+ is of course that US shale now is cooling down when WTI is south of USD 65/b rather than heating up when WTI is north of USD 45/b as was the case before.
OPEC+ will have to break some eggs in the US shale oil patches to take back lost market share. The process is already in play. Global oil inventories have been building and they will build more and the oil price will be pushed lower.
A Brent average of USD 60/b in 2026 implies a low of the year of USD 45-47.5/b. Assume that an average Brent crude oil price of USD 60/b and an average WTI price of USD 57.5/b in 2026 is sufficient to drive US oil rig count down by another 100 rigs and US crude production down by 1.5 mb/d from Dec-25 to Dec-26. A Brent crude average of USD 60/b sounds like a nice price. Do remember though that over the course of a year Brent crude fluctuates +/- USD 10-15/b around the average. So if USD 60/b is the average price, then the low of the year is in the mid to the high USD 40ies/b.
US shale oil producers are likely bracing themselves for what’s in store. US shale oil producers are aware of what is in store. They can see that inventories are rising and they have been cutting rigs and drilling activity since mid-April. But significantly more is needed over the coming 18 months or so. The faster they cut the better off they will be. Cutting 5 drilling rigs per week to the end of the year, an additional total of 100 rigs, will likely drive US crude oil production down by 1.5 mb/d from Dec-25 to Dec-26 and come a long way of handing back the market share OPEC+ is after.
The OPEC+ subgroup V8 this weekend decided to fully unwind their voluntary cut of 2.2 mb/d. The September quota hike was set at 547 kb/d thereby unwinding the full 2.2 mb/d. This still leaves another layer of voluntary cuts of 1.6 mb/d which is likely to be unwind at some point.
Higher quotas however do not immediately translate to equally higher production. This because Russia and Iraq have ”production debts” of cumulative over-production which they need to pay back by holding production below the agreed quotas. I.e. they cannot (should not) lift production before Jan (Russia) and March (Iraq) next year.
Argus estimates that global oil stocks have increased by 180 mb so far this year but with large skews. Strong build in Asia while Europe and the US still have low inventories. US Gulf stocks are at the lowest level in 35 years. This strong skew is likely due to political sanctions towards Russian and Iranian oil exports and the shadow fleet used to export their oil. These sanctions naturally drive their oil exports to Asia and non-OECD countries. That is where the surplus over the past half year has been going and where inventories have been building. An area which has a much more opaque oil market. Relatively low visibility with respect to oil inventories and thus weaker price signals from inventory dynamics there.
This has helped shield Brent and WTI crude oil price benchmarks to some degree from the running, global surplus over the past half year. Brent crude averaged USD 73/b in December 2024 and at current USD 69.7/b it is not all that much lower today despite an estimated global stock build of 180 mb since the end of last year and a highly anticipated equally large stock build for the rest of the year.
What helps to blur the message from OPEC+ in its current process of unwinding cuts and taking back market share, is that, while lifting quotas, it is at the same time also quite explicit that this is not a one way street. That it may turn around make new cuts if need be.
This is very different from its previous efforts to take back market share from US shale oil producers. In its previous efforts it typically tried to shock US shale oil producers out of the market. But they came back very, very quickly.
When OPEC+ now is taking back market share from US shale oil it is more like it is exerting a continuous, gradually increasing pressure towards US shale oil rather than trying to shock it out of the market which it tried before. OPEC+ is now forcing US shale oil producers to gradually back off. US oil drilling rig count is down from 480 in Q1-25 to now 410 last week and it is typically falling by some 4-5 rigs per week currently. This has happened at an average WTI price of about USD 65/b. This is very different from earlier when US shale oil activity exploded when WTI went north of USD 45/b. This helps to give OPEC+ a lot of confidence.
Global oil inventories are set to rise further in H2-25 and crude oil prices will likely be forced lower though the global skew in terms of where inventories are building is muddying the picture. US shale oil activity will likely decline further in H2-25 as well with rig count down maybe another 100 rigs. Thus making room for more oil from OPEC+.


NKT tillverkar elkablar som kan överföra 1 GW, har orderstock på 10 miljarder euro

CATL pausar stor litiumgruva, kan ge prishöjningar på marknaden

Omgående mångmiljardfiasko för Equinors satsning på Ørsted och vindkraft
What OPEC+ is doing, what it is saying and what we are hearing

Guld stiger till över 3500 USD på osäkerhet i världen

USA inför 93,5 % tull på kinesisk grafit

Fusionsföretag visar hur guld kan produceras av kvicksilver i stor skala – alkemidrömmen ska bli verklighet

Westinghouse planerar tio nya stora kärnreaktorer i USA – byggstart senast 2030

Kopparpriset i fritt fall i USA efter att tullregler presenterats

Ryska militären har skjutit ihjäl minst 11 guldletare vid sin gruva i Centralafrikanska republiken
-
 Nyheter3 veckor sedan
USA inför 93,5 % tull på kinesisk grafit
-
 Nyheter3 veckor sedan
Fusionsföretag visar hur guld kan produceras av kvicksilver i stor skala – alkemidrömmen ska bli verklighet
-
 Nyheter4 veckor sedan
Westinghouse planerar tio nya stora kärnreaktorer i USA – byggstart senast 2030
-
 Nyheter2 veckor sedan
Kopparpriset i fritt fall i USA efter att tullregler presenterats
-
 Nyheter3 veckor sedan
Ryska militären har skjutit ihjäl minst 11 guldletare vid sin gruva i Centralafrikanska republiken
-
 Nyheter4 veckor sedan
Eurobattery Minerals förvärvar majoritet i spansk volframgruva
-
 Nyheter2 veckor sedan
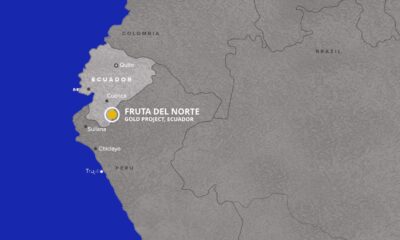
Lundin Gold rapporterar enastående borrresultat vid Fruta del Norte
-

 Nyheter3 veckor sedan
Kina skärper kontrollen av sällsynta jordartsmetaller, vill stoppa olaglig export