

Analys
SEB – Råvarukommentarer, 17 februari 2015

Geopolitisk oro och negativa räntor
MARKNADEN I KORTHET
 Veckan som gick präglades i mångt och mycket av makrohändelser och data. Riksbanken sänkte som bekant reporäntan till historiskt låga -0,10 procent och som en följd försvagades kronan ytterligare, statslåneräntor gick ned liksom Stibor, interbankräntan, som antog ett negativt värde. Utvecklingen i Ukraina är också i fokus. Vapenvilan som förhandlades fram i Minsk i torsdags av ledarna för Ukraina, Ryssland, Frankrike och Tyskland mottogs naturligtvis positivt och fick metallpriserna att stiga, men den visade sig vara skör – redan efter några timmar kom rapporter om raketbeskjutningar och det rapporterades om fortsatta strider på söndagen. Ryssland, som fortfarande hävdar att man inte stöder separatisterna, kan drabbas av utökade sanktioner om inte avtalet från Minsk respekteras. Ökad volatilitet är ett sannolikt resultat för råvarumarknaden av att situationen böljar fram och tillbaka och vi skriver om implikationerna både i avsnitten om metaller och sojabönor.
Situationen i Grekland, med diskussioner som också går fram och tillbaka med trojkan, är också ett ämne för oro. Varje gång en förhandling tar en negativ vändning börjar marknaden fundera på sannolikheten för ett Grexit och implikationerna inte minst för guldet är påtagliga. Mot bakgrund av vad vi konstaterar ovan justeras också en del av våra rekommendationer – läs mer i respektive avsnitt!
TRENDER I SAMMANDRAG
- Räntor strävar nedåt
- Geopolitisk oro skapar volatilitet
- Zinklager stora, men minskar snabbt
- Global produktion av vete rekordhög och justeras upp
REKOMMENDATIONER
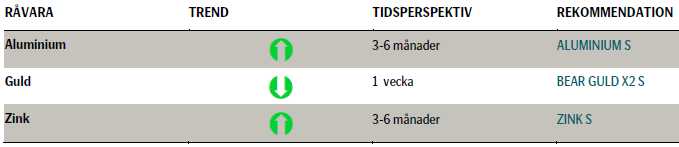
ZINK
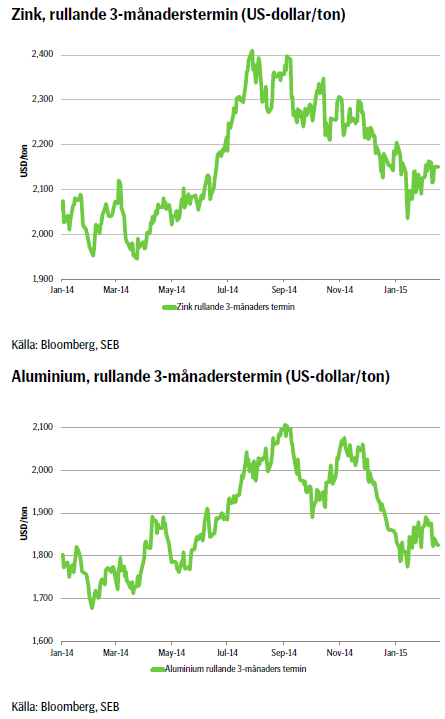 Stämningsläget på metallmarknaden följde i stort sett övriga finansiella marknader under förra veckan. Ukraina och Grekland var i fokus. Miljön med låg inflation är naturligtvis i fokus (något som vi inte minst i Sverige får känna av med en negativ reporänta). Men det är inte bara i vår del av världen som man oroas av den alltför låga inflationen. Kinas KPI kom in lägre än väntat i förra veckan (lägsta på fem år) vilket påminner marknaden om den avmattning som sker i den kinesiska ekonomin. Svaga Kina-siffror har tidigare stärkt metallpriserna på förväntan om ytterligare penningpolitiska stimulanser. Men så blev inte fallet under förra veckan, som inleddes med svaga priser. Vapenvila i Ukraina och positiva signaler från förhandlingarna om Grekland vände stämningsläget åt det positiva hållet mot slutet av veckan, vilket också fick metallpriserna att stiga. Sett över hela veckan slutade dock metallerna överlag marginellt på minus. I veckans brev lyfter vi fram zink som en alternativ köpkandidat vid sidan av aluminium (köpvärd på 3-6 månaders sikt). Den fundamentala situationen för zink påminner om den för aluminium. Lagren är stora, men minskar i snabb takt just nu. Marknader noterade redan under förra året ett underskott, något som förväntas förstärkas under innevarande år. Flera stora gruvor som är uttjänta kommer att stänga i år och under de närmaste åren. I fokus är bl.a. den gigantiska Century-gruvan i Australien. Bortfallet förväntas ersättas av nya gruvor som dock i regel är små vilket gör marknaden mer fragmenterad. Marknaden befarar även att det nya utbudet knappast fullt ut kommer att kunna ersätta bortfallet. Det finns en överhängande risk för brist på zink, om inte i år, så sannolikt nästa år. Frågan är när markandens aktörer börjar diskontera detta. Vi bedömer att detta redan kommer att ske under kv1/kv2 i år. Zink är köpvärd på 3-6 månaders sikt. På lång sikt är prispotentialen mycket stor. För 2015 prognostiserar SEB ett genomsnittligt pris på 2280 US-dollar/ton, och för 2016 2500 US-dollar/ton att jämföra med dagens 2150 US-dollar.
TREND
- I takt med att den fundamentala balansen förbättras bedöms priset successivt stärkas under året.
- Flera gruvstängningar i år och nästa, kommer inte fullt ut att ersättas. Risk för brist 2016.
- Terminskurvan är ovanligt ”billig”, dvs terminspremien (contangon) är endast 1,5 % sett 12 månader framåt.
- Attraktivt tillfälle för investerare att få exponering mot zink.
- Avvaktande inför det kinesiska nyåret.
REKOMMENDATION
- Köp ZINK S och ALUMINIUM S
NORDISK EL
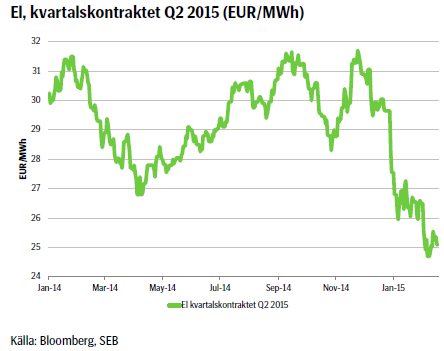 Sedan senaste elkommentaren (två veckor sedan) har marknaden fallit ytterligare. Större delen av fallet var i början av perioden, därefter har det egentligen mest varit sidledes. I stort är fundamental input oförändrad. Spotpriset följer temperaturen och ”svarar” bra med stigande pris så snart temperaturen faller nedåt. Någon långvarig vinterkyla syns däremot inte i prognoserna och för varje dag som passerar minskar risken för ”price spikes”. Den korta änden av kurvan är fortsatt mest påverkad av den i huvudsak milda vintern och god tillgång på snömagasin. Längre ut på kurvan (som inte våra certifikat replikerar) har däremot handlat högre under en period med stöd av högre kontinentala elpriser. Elmarknaden i Tyskland har drivits upp på högre konsumtion som stigit på både bättre industriförbrukning och, under en period, även av kallare väder i Centraleuropa. Dessutom har både kol- och CO2 priser samt US-dollar stärkts. Terminen som SEB:s certifikat följer, Q215, stängde igår på 25,15 euro/MWh
TREND
- Den korta änden av kurvan är i fallande men trend har mattats av. Q215-terminen befinner sig mycket nära tidigare bottnar.
REKOMMENDATION
- I nuläget saknas nödvändiga incitament för en väsentlig/varaktig prisuppgång. Samtidigt handlas terminerna mycket nära gamla bottnar. Brott av dessa öppnar för ytterligare nedsida. Dynamiken i marknaden för den kommande veckan finns därför fortsatt på nedsidan men denna är begränsad. För investerare som redan är korta rekommenderar vi att hålla kvar åtminstone en del av positionen i väntan på brott av stödet. För de som inte redan investerat, så rekommenderar vi neutral position i väntan på nya prissignaler.
GULD
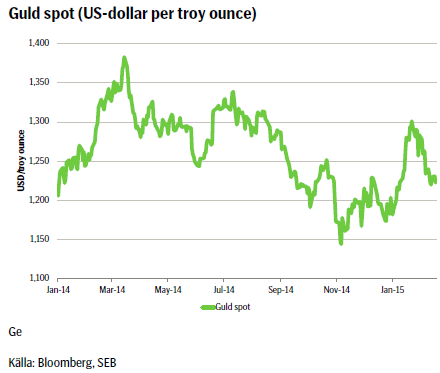 Förra veckan rekommenderade vi våra läsare att gå kort guld. Guld i dollartermer sjönk under veckan. En starkare dollar och uppgångar i aktieindex har lett till en minskad efterfrågan för guld. Efterfrågan på guld från Kina har också minskat i takt med att den kinesiska ekonomin bromsar in. Till exempel föll kinesiska bostadspriser i januari något snabbare jämfört med månaden innan. Det kinesiska nyårsfirandet som inleds denna vecka dämpar också efterfrågan på råvaror. Oron för Grekland har ökat. Grekerna vill inte acceptera de villkor som gäller för fortsatt stöd från euroländerna och IMF. Skulle man gå med på eftergifter till grekerna vad gäller offentliga besparingar och reformer lär ett antal euroländer stå på kö för att bryta mot budgetreglerna framöver. Även om Grekland kan klara sig en viss tid utan ytterligare stödutbetalningar är bankerna beroende av centralbankslikviditet som kan stoppas av ECB om utvecklingen anses ohållbar.
TREND
- Trots Greklandsoro behåller vi vår korta position i guld även under innevarande vecka.
REKOMMENDATION
- Behåll/köp BEAR GULD X2 S
VETE
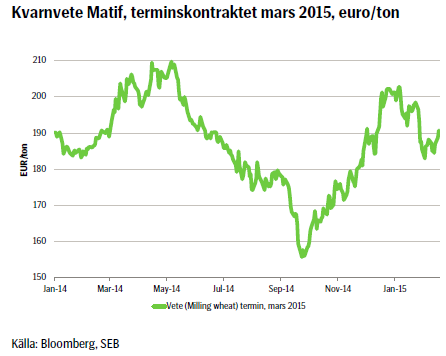 Vete på Matif inledde veckan svagt. Tisdagens månadsrapport (WASDE) från det amerikanska jordbruksdepartementet USDA fick vete att reagera negativt med fallande priser som följd.
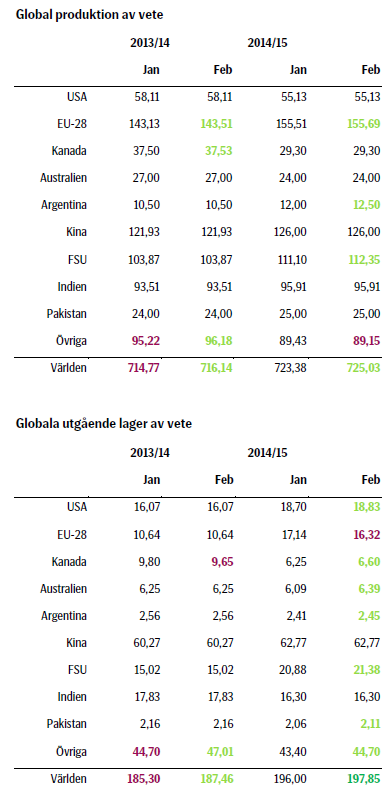
USDA justerade upp utgående lager av vete i USA med 5 miljoner bushel till 692 miljoner bushel till följd av en reducerad export som mer än väl uppväger en lägre import. Exporten väntas minska med 25 miljoner bushel till 900 miljoner bushel som en följd av ökad konkurrens från EU samt den senaste tidens stärkning av dollarn som gör amerikansk export mindre konkurrenskraftig. Marknaden hade dock väntat sig en lagernivå på 694 miljoner bushel vilket begränsade nedsidan.
Den globala produktionen av vete kvarstår på en rekordhög nivå och justeras dessutom upp med ytterligare 1,7 miljoner ton till 725,03 miljoner ton, framförallt till följd av revideringar för Argentina och Kazakstan.
Global konsumtion justeras upp med 1,5 miljoner till följd av ökad human- och foderanvändning, samtidigt som vi noterar att globala utgående lager sakta men säkert närmar sig 200 miljoner ton då de nu justeras upp med ytterligare 1,9 miljoner ton till 197,85 miljoner ton.
Priserna steg dock kraftigt i slutet av veckan till följd av vinsthemtagningar, väderprognoser som indikerar kallare väder i USA samt statistik som visar att Rysslands exportrestriktioner som trädde i kraft per den 1 februari nu ger effekt.
REKOMMENDATION
- Neutral
SOJABÖNOR
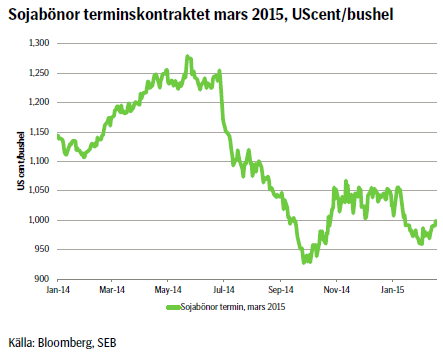 Sojabönor startade veckan med högre priser till följd av en fortsatt efterfrågan i kombination med vinsthemtagningar inför tisdagens WASDE-rapport från det amerikanska jordbruksdepartementet USDA.
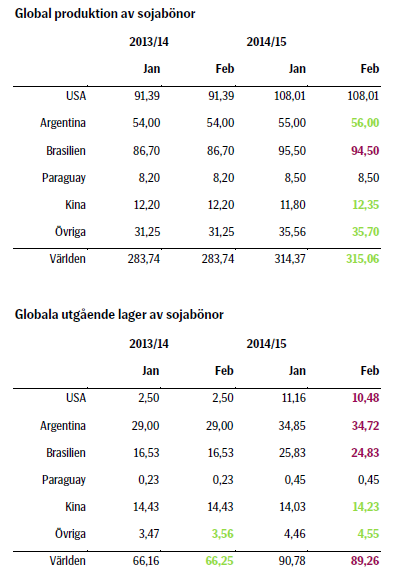
USDA justerar utgående lager av sojabönor i USA från förra månadens 410 miljoner bushel till 385 miljoner bushel, vilket var lägre än vad marknaden hade förväntat sig.
Den globala produktionen av sojabönor justeras upp med 0,7 miljoner ton till rekordhöga 315,1 miljoner ton. Utsikterna för skörden i Argentina har förbättrats som ett resultat av milda temperaturer och nederbörd vilket gör att produktionen justeras upp med 1 miljon ton till sy mycket som 56 miljoner ton. Produktionen revideras även upp för Kina, Ryssland och Ukraina. Brasiliens produktion justeras ner med 1 miljon ton sedan förra månaden till 94,5 miljoner ton då alltför lite regn i landets östra delar påverkar avkastningen negativt. Globala utgående lager justerades ner från 90,78 miljoner ton till 89,26 miljoner, vilket var mer än vad marknaden hade förväntat sig.
Även om produktionen av sojabönor i Brasiliens fortfarande förväntas bli rekordhög så är det flera privata analytiker som justerar ner sina produktionsestimat.
Veckan avslutades med en kraftig prisuppgång drivet av starka amerikanska exportsiffror, uppgången i råolja liksom en svagare dollar. Priserna fick också stöd av annonserade privata försäljningar av sojabönor till Kina.
REKOMMENDATION
- Det något stramare utbudet som visades i tisdagens WASDE-rapport gör att vi går ur vår korta position tillfälligt då priserna nu står och väger. Vi håller oss neutrala tills vi får en teknisk köp-eller säljsignal bekräftad.
[box]SEB Veckobrev Veckans råvarukommentar är producerat av SEB:s Commodities Sales desk och publiceras i samarbete och med tillstånd på Råvarumarknaden.se[/box]
Disclaimer
Detta marknadsföringsmaterial, framtaget av SEB:s Commodities Sales desk, har upprättats enbart i informationssyfte.
Även om innehållet är baserat på källor som SEB bedömt som tillförlitliga ansvarar SEB inte för fel eller brister i informationen. Den utgör inte oberoende, objektiv investeringsanalys och skyddas därför inte av de bestämmelser som SEB har infört för att förebygga potentiella intressekonflikter. Yttranden från SEB:s Commodities Sales desk kan vara oförenliga med tidigare publicerat material från SEB, då den senare hänvisas uppmanas du att läsa den fullständiga rapporten innan någon åtgärd vidtas.
Dokumentationen utgör inte någon investeringsrådgivning och tillhandahålls till dig utan hänsyn till dina investeringsmål. Du uppmanas att självständigt bedöma och komplettera uppgifterna i denna dokumentation och att basera dina investeringsbeslut på material som bedöms erforderligt. Alla framåtblickande uttalanden, åsikter och förväntningar är föremål för risker, osäkerheter och andra faktorer och kan orsaka att det faktiska resultatet avviker väsentligt från det förväntade. Historisk avkastning är ingen garanti för framtida resultat. Detta dokument utgör inte ett erbjudande att teckna några värdepapper eller andra finansiella instrument. SEB svarar inte för förlust eller skada – direkt eller indirekt, eller av vad slag det vara må – som kan uppkomma till följd av användandet av detta material eller dess innehåll.
Observera att det kan förekomma att SEB, dess ledamöter, dess anställda eller dess moder- och/eller dotterbolag vid olika tillfällen innehar, har innehaft eller kommer att inneha aktier, positioner, rådgivningsuppdrag i samband med corporate finance-transaktioner, investment- eller merchantbanking-uppdrag och/eller lån i de bolag/finansiella instrument som nämns i materialet.
Materialet är avsett för mottagaren, all spridning, distribuering mångfaldigande eller annan användning av detta meddelande får inte ske utan SEB:s medgivande.
Oaktat detta får SEB tillåta omfördelning av materialet till utvald tredje part i enlighet med gällande avtal. Materialet får inte spridas till fysiska eller juridiska personer som är medborgare eller har hemvist i ett land där sådan spridning är otillåten enligt tillämplig lag eller annan bestämmelse.
Skandinaviska Enskilda Banken AB (publ) är ett publikt aktiebolag och står under tillsyn av Finansinspektionen samt de lokala finansiella tillsynsmyndigheter i varje jurisdiktionen där SEB har filial eller dotterbolag.
Villkor
För varje enskilt certifikat finns Slutliga Villkor som anger de fullständiga villkoren. Slutliga Villkor finns tillgängligt på kurssidan för respektive certifikat på www.seb.se, Börs & finans, fliken Strukturerade placeringar.
Risker
En sammanfattning av de risker som är förknippade med Börshandlade certifikat generellt finns i Produktbroschyren för respektive certifikat som är tillgängligt på www.seb.se/cert. För en fullständig bild av riskerna behöver du ta del av SEB:s offentliggjorda Grundprospekt för Certifikat- och Warrantprogram som är publicerat på www.seb.se/cert.

Rebounding along with most markets. But concerns over solidity of Gaza peace may also contribute. Brent crude fell 0.8% yesterday to $61.91/b and its lowest close since May this year. This morning it is bouncing up 0.9% to $62.5/b along with a softer USD amid positive sentiment with both equities and industrial metals moving higher. Concerns that the peace in Gaza may be less solid than what one might hope for also yields some support to Brent. Bets on tech stocks are rebounding, defying fears of trade war. Money moving back into markets. Gold continues upwards its strong trend and a softer dollar helps it higher today as well.

US crude & products probably rose 5.6 mb last week (API) versus a normal seasonal decline of 2.4 mb. The US API last night partial and thus indicative data for US oil inventories. Their data indicates that US crude stocks rose 7.4 mb last week, gasoline stocks rose 3.0 mb while Distillate stocks fell 4.8 mb. Altogether an increase in commercial crude and product stocks of 5.6 mb. Commercial US crude and product stocks normally decline by 2.4 mb this time of year. So seasonally adjusted the US inventories rose 8 mb last week according to the indicative numbers by the API. That is a lot. Also, the counter seasonal trend of rising stocks versus normally declining stocks this time of year looks on a solid pace of continuation. If the API is correct then total US crude and product stocks would stand 41 mb higher than one year ago and 6 mb higher than the 2015-19 average. And if we combine this with our knowledge of a sharp increase in production and exports by OPEC(+) and a large increase in oil at sea, then the current trend in US oil inventories looks set to continue. So higher stocks and lower crude oil prices until OPEC(+) switch to cuts. Actual US oil inventory data today at 18:00 CET.
US commercial crude and product stocks rising to 1293 mb in week 41 if last nights indicative numbers from API are correct.

Crude oil soon coming to a port near you. OPEC has lifted production sharply higher this autumn. At the same time demand for oil in the Middle-East has fallen as we have moved out of summer heat and crude oil burn for power for air-conditioning. The Middle-East oil producers have thus been able to lift exports higher on both accounts. Crude oil and condensates on water has shot up by 177 mb since mid-August. This oil is now on its way to ports around the world. And when they arrive, it will likely help to lift stocks onshore higher. That is probably when we will lose the last bit of front-end backwardation the the crude oil curves. That will help to drive the front-month Brent crude oil price down to the $60/b line and revisit the high $50ies/b. Then the eyes will be all back on OPEC+ when they meet in early November and then again in early December.
Crude oil and condensates at sea have moved straight up by 177 mb since mid-August as OPEC(+) has produced more, consumed less and exported more.

When it starts to move lower it moves rather quickly. Gaza, China, IEA. Brent crude is down 2.1% today to $62/b after having traded as high as $66.58/b last Thursday and above $70/b in late September. The sell-off follows the truce/peace in Gaze, a flareup in US-China trade and yet another bearish oil outlook from the IEA.
A lasting peace in Gaze could drive crude oil at sea to onshore stocks. A lasting peace in Gaza would probably calm down the Houthis and thus allow more normal shipments of crude oil to sail through the Suez Canal, the Red Sea and out through the Bab-el-Mandeb Strait. Crude oil at sea has risen from 48 mb in April to now 91 mb versus a pre-Covid normal of about 50-60 mb. The rise to 91 mb is probably the result of crude sailing around Africa to be shot to pieces by the Houthis. If sailings were to normalize through the Suez Canal, then it could free up some 40 mb in transit at sea moving onshore into stocks.
The US-China trade conflict is of course bearish for demand if it continues.
Bearish IEA yet again. Getting closer to 2026. Credibility rises. We expect OPEC to cut end of 2025. The bearish monthly report from the IEA is what it is, but the closer we get to 2026, the more likely the IEA is of being ball-park right in its outlook. In its monthly report today the IEA estimates that the need for crude oil from OPEC in 2026 will be 25.4 mb/d versus production by the group in September of 29.1 mb/d. The group thus needs to do some serious cutting at the end of 2025 if it wants to keep the market balanced and avoid inventories from skyrocketing. Given that IEA is correct that is. We do however expect OPEC to implement cuts to avoid a large increase in inventories in Q1-26. The group will probably revert to cuts either at its early December meeting when they discuss production for January or in early January when they discuss production for February. The oil price will likely head yet lower until the group reverts to cuts.
Dubai: The Mid-East anchor dragging crude oil lower. Surplus emerging in Mid-East pricing. Crude oil prices held surprisingly strong all through the summer. A sign and a key source of that strength came from the strength in the front-end backwardation of the Dubai crude oil curve. It held out strong from mid-June and all until late September with an average 1-3mth time-spread premium of $1.8/b from mid-June to end of September. The 1-3mth time-spreads for Brent and WTI however were in steady deterioration from late June while their flat prices probably were held up by the strength coming from the Persian Gulf. Then in late September the strength in the Dubai curve suddenly collapsed. Since the start of October it has been weaker than both the Brent and the WTI curves. The Dubai 1-3mth time-spread now only stands at $0.25/b. The Middle East is now exporting more as it is producing more and also consuming less following elevated summer crude burn for power (Aircon) etc.
The only bear-element missing is a sudden and solid rise in OECD stocks. The only thing that is missing for the bear-case everyone have been waiting for is a solid, visible rise in OECD stocks in general and US oil stocks specifically. So watch out for US API indications tomorrow and official US oil inventories on Thursday.
No sign of any kind of fire-sale of oil from Saudi Arabia yet. To what we can see, Saudi Arabia is not at all struggling to sell its oil. It only lowered its Official Selling Prices (OSPs) to Asia marginally for November. A surplus market + Saudi determination to sell its oil to the market would normally lead to a sharp lowering of Saudi OSPs to Asia. Not yet at least and not for November.
The 5yr contract close to fixed at $68/b. Of importance with respect to how far down oil can/will go. When the oil market moves into a surplus then the spot price starts to trade in a large discount to the 5yr contract. Typically $10-15/b below the 5yr contract on average in bear-years (2009, 2015, 2016, 2020). But the 5yr contract is usually pulled lower as well thus making this approach a moving target. But the 5yr contract price has now been rock solidly been pegged to $68/b since 2022. And in the 2022 bull-year (Brent spot average $99/b), the 5yr contract only went to $72/b on average. If we assume that the same goes for the downside and that 2026 is a bear-year then the 5yr goes to $64/b while the spot is trading at a $10-15/b discount to that. That would imply an average spot price next year of $49-54/b. But that is if OPEC doesn’t revert to cuts and instead keeps production flowing. We think OPEC(+) will trim/cut production as needed into 2026 to prevent a huge build-up in global oil stocks and a crash in prices. But for now we are still heading lower. Into the $50ies/b.
Some rebound but not much. Brent crude rebounded 1.5% yesterday to $65.47/b. This morning it is inching 0.2% up to $65.6/b. The lowest close last week was on Thursday at $64.11/b.
The curve structure is almost as week as it was before the weekend. The rebound we now have gotten post the message from OPEC+ over the weekend is to a large degree a rebound along the curve rather than much strengthening at the front-end of the curve. That part of the curve structure is almost as weak as it was last Thursday.
We are still on a weakening path. The message from OPEC+ over the weekend was we are still on a weakening path with rising supply from the group. It is just not as rapidly weakening as was feared ahead of the weekend when a quota hike of 500 kb/d/mth for November was discussed.
The Brent curve is on its way to full contango with Brent dipping into the $50ies/b. Thus the ongoing weakening we have had in the crude curve since the start of the year, and especially since early June, will continue until the Brent crude oil forward curve is in full contango along with visibly rising US and OECD oil inventories. The front-month Brent contract will then flip down towards the $60/b-line and below into the $50ies/b.
At what point will OPEC+ turn to cuts? The big question then becomes: When will OPEC+ turn around to make some cuts? At what (price) point will they choose to stabilize the market? Because for sure they will. Higher oil inventories, some more shedding of drilling rigs in US shale and Brent into the 50ies somewhere is probably where the group will step in.
There is nothing we have seen from the group so far which indicates that they will close their eyes, let the world drown in oil and the oil price crash to $40/b or below.
The message from OPEC+ is also about balance and stability. The world won’t drown in oil in 2026. The message from the group as far as we manage to interpret it is twofold: 1) Taking back market share which requires a lower price for non-OPEC+ to back off a bit, and 2) Oil market stability and balance. It is not just about 1. Thus fretting about how we are all going to drown in oil in 2026 is totally off the mark by just focusing on point 1.
When to buy cal 2026? Before Christmas when Brent hits $55/b and before OPEC+ holds its last meeting of the year which is likely to be in early December.
Brent crude oil prices have rebounded a bit along the forward curve. Not much strengthening in the structure of the curve. The front-end backwardation is not much stronger today than on its weakest level so far this year which was on Thursday last week.

The front-end backwardation fell to its weakest level so far this year on Thursday last week. A slight pickup yesterday and today, but still very close to the weakest year to date. More oil from OPEC+ in the coming months and softer demand and rising inventories. We are heading for yet softer levels.


Spotpriset på guld över 4300 USD och silver över 54 USD
Crude oil soon coming to a port near you

Guld och silver stiger hela tiden mot nya höjder
The Mid-East anchor dragging crude oil lower

Samtal om sällsynta jordartsmetaller, guld och silver

OPEC+ missar produktionsmål, stöder oljepriserna

Ett samtal om guld, olja, fjärrvärme och förnybar energi
Guld nära 4000 USD och silver 50 USD, därför kan de fortsätta stiga

Goldman Sachs höjer prognosen för guld, tror priset når 4900 USD
Are Ukraine’s attacks on Russian energy infrastructure working?
-
 Nyheter3 veckor sedan
OPEC+ missar produktionsmål, stöder oljepriserna
-
 Nyheter3 veckor sedan
Ett samtal om guld, olja, fjärrvärme och förnybar energi
-
 Nyheter2 veckor sedan
Guld nära 4000 USD och silver 50 USD, därför kan de fortsätta stiga
-
Analys3 veckor sedan
Are Ukraine’s attacks on Russian energy infrastructure working?
-
 Nyheter1 vecka sedan
Goldman Sachs höjer prognosen för guld, tror priset når 4900 USD
-

 Nyheter2 veckor sedan
Blykalla och amerikanska Oklo inleder ett samarbete
-

 Nyheter4 veckor sedan
Guldpriset uppe på nya höjder, nu 3750 USD
-
Nyheter2 veckor sedan
Ett samtal om guld, olja, koppar och stål