

Analys
SEB – Råvarukommentarer, 16 september 2013

Rekommendationer
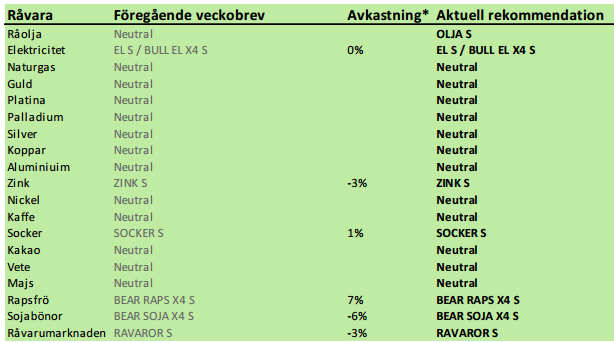
*) Avkastningen anges för 1:1 certifikaten där både BULL och 1:1 certifikat är angivna.
Inledning
Elmarknaden går kanske ner i veckan eftersom det ostadiga vädret har anlänt. Eftersom trenden är så tydligt positiv på marknaderna för kol och utsläppsrätter bör man ta ett sådant tillfälle i akt och köpa certifikat på el. Det kan bli en mycket bra affär.
De höga priserna på olja har fått oljeproducenter att sälja sin produkt på termin. Detta gör att avkastningen för dem som investerar i oljemarknaden via terminer erbjuds bra avkastning. Den rekyl nedåt som USA:s inställda angrepp på Syrien föranlett, är ett bra tillfälle att placera i oljemarknaden via certifikatet OLJA S.
USA:s jordbruksdepartement USDA publicerade sin månadsvisa uppdatering av utbud och efterfrågan på världsmarknaden. Den var negativ för priset på vete och majs, men neutral på soja. Sojapriset steg och det tror vi beror på att vissa aktörer lider av en psykologisk anspänning, snarare än något med grund i fakta. Vi upprepar vår säljrekommendation på soja och raps.
Två rapporter kom, i polemik med Czarnikows prognos om ett mindre överskott än väntat i sockermarknaden. Men kontentan var ändå att överskottet blir mindre än tidigare prognostiserats.
Råolja – Brent
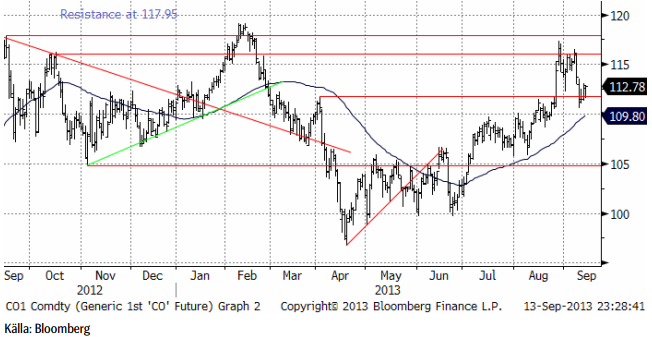
Oljepriset föll tillbaka när det gick upp för alla – även de som inte läst det här veckobrevet – att USA inte skulle eskalera konflikten med Syrien. Som vi skrev för redan två veckor sedan var det uppenbart att USA:s president inte skulle fullfölja sitt hot. Syrienkonflikten skulle kunna ha påverkat producerande länder, så att oljepriset påverkats, men det finns även andra faktorer som faktiskt har en påverkan på oljepriset och som fått verka i det tysta. Libyens produktion har haft problem och efterfrågan har fått skjuts av den ekonomiska återhämtningen som sker i hela världen. Oljepriset befinner sig i en positiv trend rent tekniskt. Priset har gott stöd vid 110 dollar per fat, men motstånd vid 118 dollar ungefär. Fortfarande handlas oljepriset inom det prisintervall som varit rådande sedan tre år tillbaka.
Terminskurvorna för Brent (den översta) och den av lager- och transportkapacitet strypta marknaden för West Texas Intermediate ligger lite lägre.
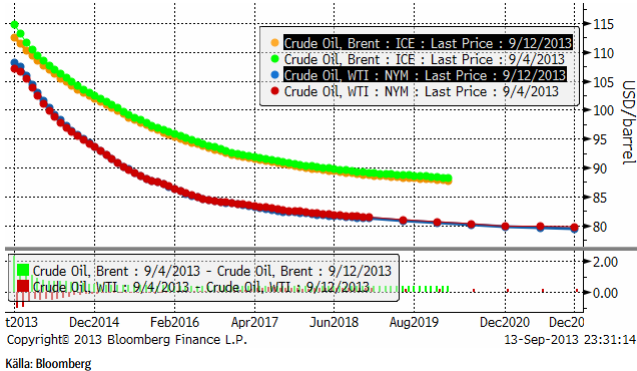
Tidningen Energy Risk skrev i fredags en artikel om att de höga priserna lockat fram en våg av prissäkring från amerikanska oljebolag. Dessa säljer framtida produktion på termin och lyckas på så sätt minska risken i sin verksamhet. De gör detta trots att terminspriserna är lägre än spotpriserna därför att de vinner i minskad osäkerhet. De är med andra ord villiga att betala försäkringspremien till dem som köper terminerna – och bär risken i deras ställe.
För råvaruinvesterare är den här rabatten nu väldigt attraktiv. Man kan tjäna ca 7 – 10% extra på att äga råoljeterminer.
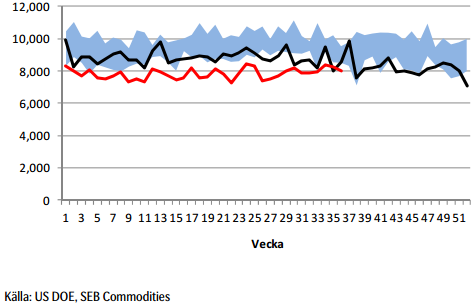
Råoljelagren fortsätter att minska i USA.
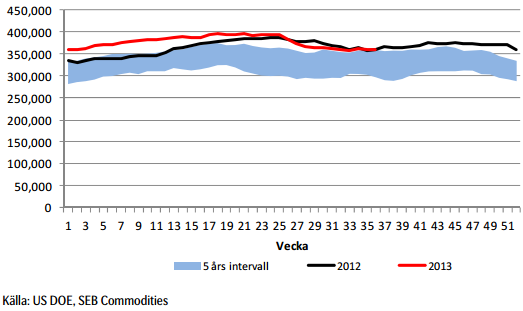
Importen år 2013 (röd) minskade i den senaste rapporten från DOE.
När nu priset fallit tillbaka och rabatten på terminer är så attraktiv, tycker vi att det är ett bra tillfälle att komma in i den lönsamma oljemarknaden och rekommenderar köp av OLJA S. Det är framförallt rabatten på terminerna vi vill komma åt och därför föredrar vi OLJA S framför t ex BULL OLJA X4 S.
Elektricitet
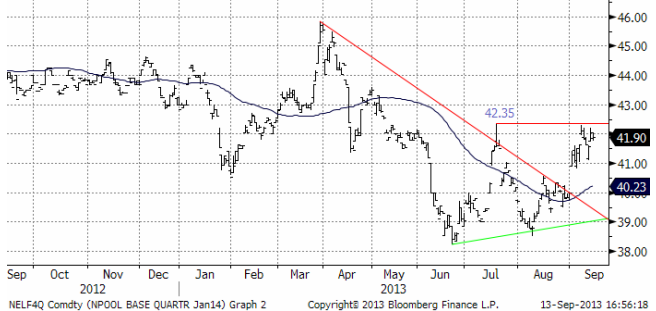
Nedan ser vi prisdiagrammet på det första kvartalets 2014 kontrakt. Det är det kontrakt som är underliggande för certifikaten sedan början på månaden.
Man har gjort försök att få igång O3:an i veckan, utan att lyckas. Finnarna har inte heller fått igång sin. Kärnkraften går just nu på halva sin installerade kapacitet.
Väderleksprognoserna visar fortsatt blött. Det ostadiga vädret väntas komma nu.
Tekniskt har motståndet vid 41.35 hållit stånd. Det är inte otänkbart att blötare väder och kärnkraftverk som kommer igång, kan få priset att rekylera ner från fredagens stängningspris på 41.90 euro per MWh. En sådan rekyl betraktar vi som ett utmärkt köptillfälle.
Som nämnt ovan, har den nordiska kärnkraften fortsätta problem. I fredags producerades endast 51% av den installerade kapaciteten. OKG kommer att starta om Oskarshamn 3 klockan 15:00 på tisdag. Reaktorn har varit avstängd sedan den 1 september och tre försök att återstarta den har misslyckats. OKG har skjutit upp starten av Orskarshamn 1 från i torsdags till måndagen. Reaktorn har varit avstängd sedan den 9 juli pga ventilproblem. PVO kommer att återstarta Olkiluoto 2 på tisdag. Reaktorn stängdes i måndags förra veckan pga en överhettad generator. Ringhals 2, Ringhals 3, Orskarshamn 2 och Loviisa 2 var avstängda för det årliga underhållet.
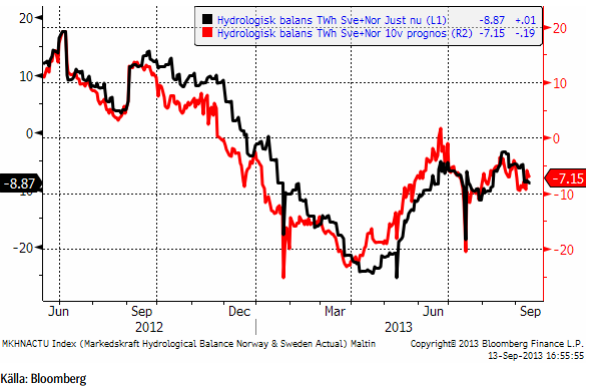
Hydrologisk balans har fortsatt att försämras, särskilt prognosen.
Marginalkostnaden för att producera el bestäms av priset på kol och priset på utsläppsrätter. Nedan ser vi priset på utsläppsrätter i euro / ton. Notera den fortsatta prisuppgången.
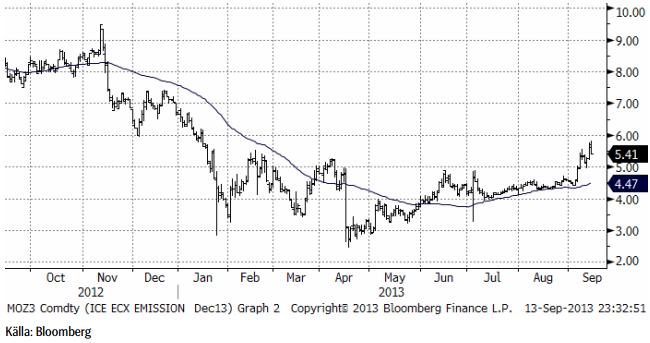
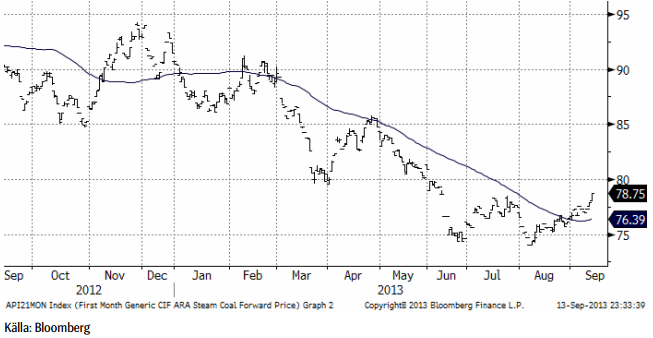
Nedan ser vi terminspriset för månaden, på energikol i Rotterdam. Vi ser att marknaden har vänt uppåt. Trenden är bruten. Detta har indirekt, men helt säkert, en påverkan på prisnivån på nordisk elektricitet. Vi väntar oss en fortsatt återhämtning i kolpriset åtminstone upp till 95 dollar per ton. Och därmed motsvarande prisuppgång på nordisk elektricitet. Dessutom tror vi på en procentuellt sett väsentligt högre prisuppgång på utsläppsrätter.
Vi rekommenderar alltså köp av el, t ex EL S eller BULL EL X4 S.
Naturgas
Naturgaspriset studsade på 3.60 i veckan och stängde i fredags på 3.75. Tekniskt motstånd ligger på 3.80.
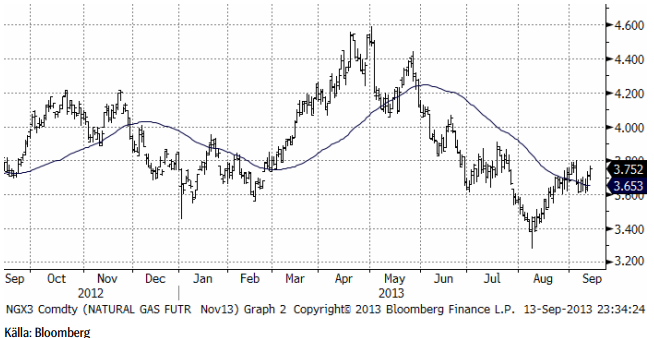
Vi har neutral rekommendation.
Guld & Silver
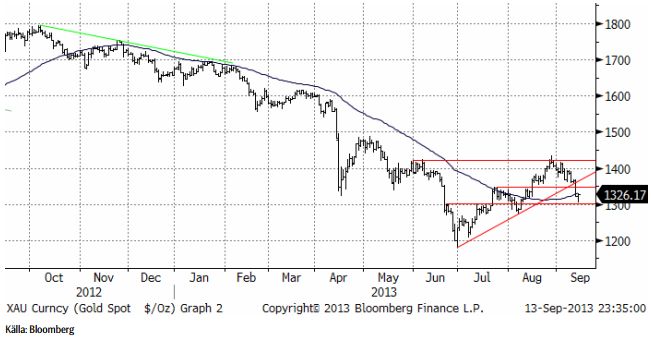
Guldpriset föll ned till stödet på 1300 dollar per troy uns, efter att ha brutit stödet för uppgången från juni / juli. Vi har tidigare sagt att vi betraktar hela uppgången från juni / juli som en rekyl mot den fallande trenden. Goldman Sachs publicerade en rapport i fredags, där de säger att priset på guld kan falla så långt som till 1000 dollar per troy uns. Goldman Sachs har emellertid en tendens att göra prognoser som påminner om rena extrapoleringar av trender. Det går sällan så långt som Goldman Sachs analytiker har förutspått. Vi delar dock vyn att priset på guld förmodligen kommer att falla vidare. I det riktigt korta perspektivet noterar vi dock att 1300 dollar är ett starkt tekniskt stöd, varifrån marknaden kan samla kraft och göra ett nytt försök uppåt.
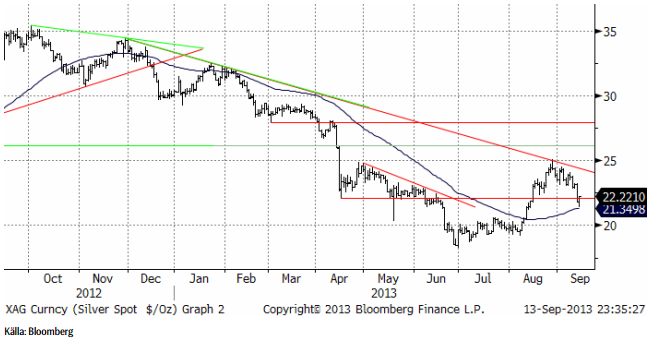
Nedan ser vi kursdiagrammet för silver i dollar per troy ounce. Då och då ser man att handlare hänger upp sig på 55-dagars glidande medelvärde och priset studsade i fredags precis på den nivå som det ligger på, som vi ser i diagrammet nedan. Går priset under den nivån, kan priset gå till 20 dollar, annars kan det gå pp mot 24 dollar. Notera att toppen i slutat av augusti inte lyckades bryta motståndet för den fallande pristrenden. Vi är alltså fortfarande i en bear market för silver.
Nedan ser vi kvoten mellan guldpriset och silverpriset.
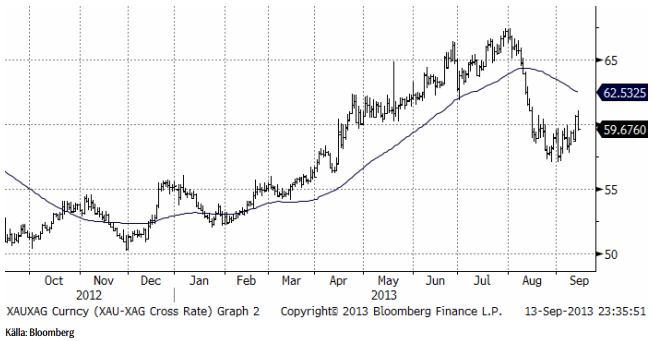
Silverpriset har i den allmänna prisnedgången, i vanlig ordning, fallit mer än guld.
Vi fortsätter att vara neutrala guld och silver och skulle inte vilja köpa någon av dem idag.
Platina & Palladium
Förra veckan skrev vi att platina då brutit stödet för uppgången. Resultatet ser vi nu, där priset fallit ordentligt, ned till nivåer som utgjorde stöd under juli – augusti. Det vore inte otänktbart med en rekyl uppåt i det riktigt korta perspektivet, men vi ser inte detta som en trendvändning, utan som en rekyl i en fallande pristrend.
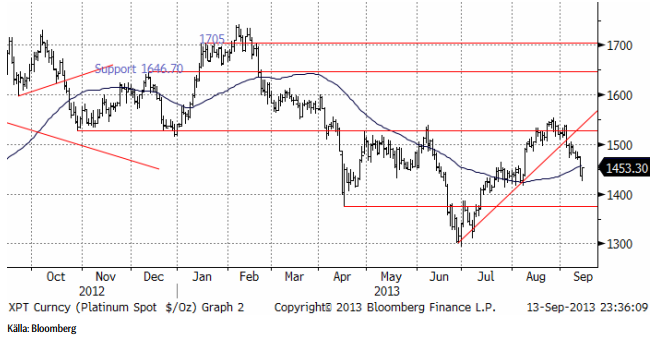
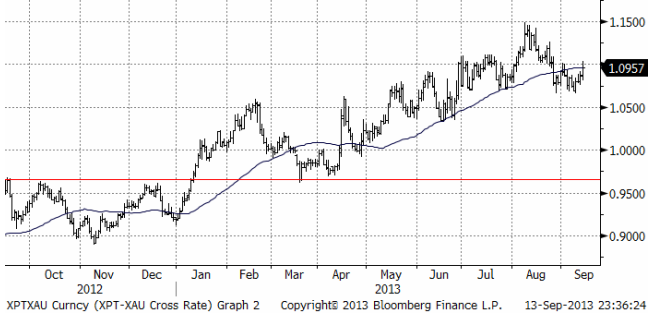
Nedan ser i kvoten mellan platina och guld. I slutet av förra veckan steg platina i förhållande till guld, men vi ser detta som en kortsiktig ”blip” och tror att platina kan falla tillbaka.
Palladiumpriset är håller på att bryta ner från den triangel vi skrivit om tidigare. Kursfallet kan bli stort.
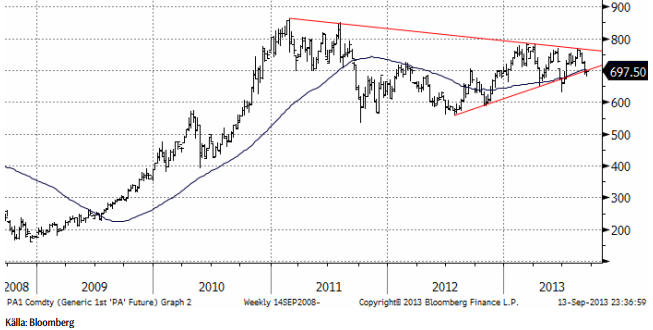
Vi är för närvarande neutrala platina och palladium, men om palladium skulle falla bara något lite ytterligare, skulle vi vilja haka på och ta en kort position via BEAR PALLAD X4 S. Vi skulle absolut inte vilja köpa någon av dem.
Koppar
Priset på koppar var i princip oförändrat i veckan som gick. Trenden är nedåtriktad, men priset är förhållandevis lågt. Vi fortsätter med neutral vy.
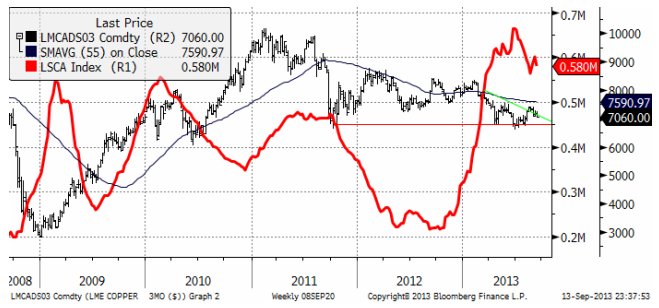
Det är en svårtolkad bild och vi rekommenderar neutral position.
Aluminium
Förra veckan noterade en marginell prisnedgång som stannade på 1812 dollar per ton. Stöd finns vid 1800 dollar. Går priset under den nivån skulle vi vilja vara korta, dvs köpta BEAR ALU X4 S.
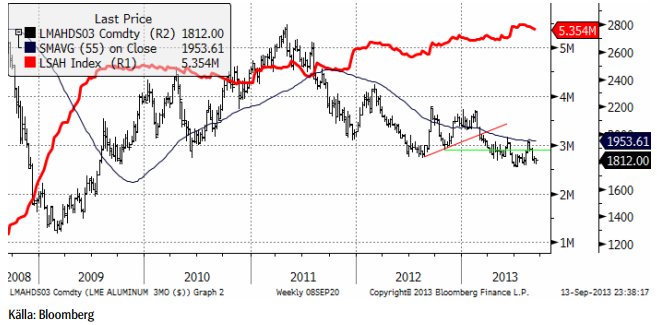
Vi har neutral rekommendation, tidigare köp.
Zink
Priset på zink har i nästan två års tid legat inom ett intervall mellan 1718.50 dollar per ton och 2200 dollar per ton, som vi ser nedan. Den röda linjen visar lagren av zink vid LME. Vi ser att marknaden börjat komma mer i balans. Detta fortsatte i veckan som gick. De rekordstora lagren har börjat minska. Det finns en förväntan om en stor inleverans till tredje onsdagen i september, den 18 september, eftersom detta skett både i maj och i juli. Analytiker har noterat att detta kan hänga ihop med lagerfinansieringsaffärer utanför LME-systemet.
Den senaste ILZG-rapporten indikerar dock att det finns en starkare efterfrågan och att balansen förbättras, vilket gör ett aluminium-scenario mindre sannolikt. Stöd finns vid 1850 dollar per ton, som vi tror att marknaden håller sig över.
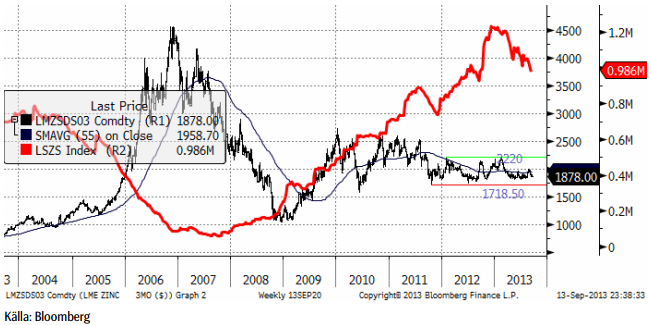
Vi fortsätter med en försiktig köprekommendation, av ZINK S.
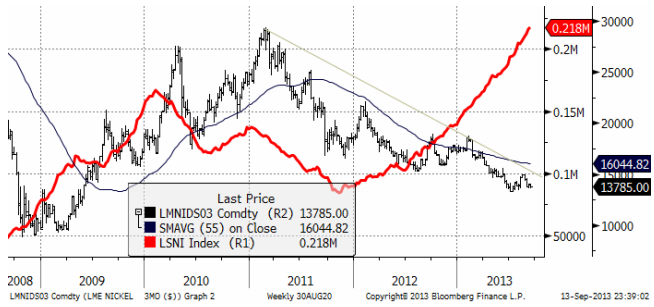
Nickel
Nickelpriset följde den generella tendensen under veckan och stängde på veckans lägsta nivå, där priset balanserar på det tekniska stödet 13675 dollar per ton. Marknaden förväntar sig en återhämtning av fysisk efterfrågan under årets sista kvartal, huvudsakligen drivet av Kina. Produktionen av rostfritt stål steg med 11% i Kina under det första halvåret i år, huvudsakligen från 300-serien, som innehåller 8 – 10% nickel, enligt CRU. Efter en långsammare takt under det tredje kvartalet, tror CRU på en återhämtning under det fjärde. Det skulle innebära en ökning av efterfrågan på 13% i årstakt. Med det stora lager som finns skulle detta verkligen behövas för att få marknaden i balans. En faktor som skulle kunna leda till ökad efterfrågan är den premie för nickel i nickel pig iron vi nämnde i förra veckans brev. Att vi ser att cancellerade warrants (lagerbevis) vid LME nu uppgår till 20% av LME:s lager, kan vara ett tecken på ökad efterfrågan på primärnickel. Nya ”cancellations” rapporteras från Malaysia, där allt nickel i lager har levererats in från Kina. Det är nu möjligt att det här lagret går tillbaka till Kina. Det finns alltså några tecken på förbättringar i marknadsläget, men nickel har förmodligen en lång väg att gå innan vi ser en rejäl återhämtning.
[box]SEB Veckobrev Veckans råvarukommentar är producerat av SEB Merchant Banking och publiceras i samarbete och med tillstånd på Råvarumarknaden.se[/box]
Disclaimer
The information in this document has been compiled by SEB Merchant Banking, a division within Skandinaviska Enskilda Banken AB (publ) (“SEB”).
Opinions contained in this report represent the bank’s present opinion only and are subject to change without notice. All information contained in this report has been compiled in good faith from sources believed to be reliable. However, no representation or warranty, expressed or implied, is made with respect to the completeness or accuracy of its contents and the information is not to be relied upon as authoritative. Anyone considering taking actions based upon the content of this document is urged to base his or her investment decisions upon such investigations as he or she deems necessary. This document is being provided as information only, and no specific actions are being solicited as a result of it; to the extent permitted by law, no liability whatsoever is accepted for any direct or consequential loss arising from use of this document or its contents.
About SEB
SEB is a public company incorporated in Stockholm, Sweden, with limited liability. It is a participant at major Nordic and other European Regulated Markets and Multilateral Trading Facilities (as well as some non-European equivalent markets) for trading in financial instruments, such as markets operated by NASDAQ OMX, NYSE Euronext, London Stock Exchange, Deutsche Börse, Swiss Exchanges, Turquoise and Chi-X. SEB is authorized and regulated by Finansinspektionen in Sweden; it is authorized and subject to limited regulation by the Financial Services Authority for the conduct of designated investment business in the UK, and is subject to the provisions of relevant regulators in all other jurisdictions where SEB conducts operations. SEB Merchant Banking. All rights reserved.

Market is starting to take US/Iran headlines with a pinch of salt. Brent crude rose $2.8/b yesterday to an official close of $112.1/b. But after that it traded as low as $108.05/b before ending late night at around $109.7/b. Through the day it traded in a range of $106.87 – 112.72/b amid a flurry of news or rumors from Iran and the US. ”US temporary sanctions during negotiations” (falls alarm). ”We will bomb Iran” (not anyhow),… etc. While the market is still fluctuating to this kind of news flow, it is starting to take such headlines with a pinch of salt.

We’ll see. Maybe, maybe not. The Brent M1 contract is trading at $110.2/b this morning which very close to the average ticks through yesterday of $110.4/b.
Trump with bearish, verbal intervention whenever Brent trades above $110/b it seems. What seems to be a pattern is that Trump states something like ”very good negotiations going on with Iran”, ”New leaders in Iran are great,..”, ”Great progress in negotiations,…”, ”Deal in sight,..” etc whenever the Brent M1 contract trades above $110/b. An effort to cool the market. These hot air verbal interventions from Trump used to have a heavy bearish impact on prices, but they now seems to have less and less effect unless they are backed by reality.
As far as we can see there has been no real progress in the negotiations between the US and Iran with both sides still standing by their previous demands.
Iran is getting stronger while the cease fire lasts making a return to war for Trump yet harder. Iran is naturally in constant preparation for a return to war given Trump’s steady threats of bombing Iran again. Iran is naturally doing what ever is possible to prepare for a return to war. And every day the cease fire lasts it is better prepared. This naturally makes it more and more difficult and dangerous for the US to return to warring activity versus Iran as the consequences for energy infrastructure in the Persian Gulf will be more and more severe the longer the cease fire lasts. Israel seems to see it this way as well. That the war is not won and that current frozen state of a cease fire gives Iran opportunity to rebuild military and politically.
Global inventories are drawing down day by day. How much? In the meantime the Strait of Hormuz stays closed. There is varying measures and estimates of how much global inventories are drawing down. Our rough estimate, back of the envelope, is that global inventories are drawing down by at least some 10 mb/d or about 300 mb/d in a balance between loss of supply versus demand destruction. Other estimates we see are a monthly draw of 250-270 mb/d. The IEA only ’measured’ a draw in global observable stocks of 117 mb in April with oil on water rising 53 mb while on shore stocks fell 170 mb. But global stocks are hard to measure with large invisible, unmeasured stocks. As such a back of the envelope approach may be better.
Oil products is what the world is consuming. Oil product prices likely to rise while product stocks fall. Strategic Petroleum Reserves (SPR) are predominantly crude oil. Discharging oil from OECD SPR stocks, a sharp reduction in Chinese crude imports and a reduction in global refinery throughput of 6-7 mb/d has helped to keep crude oil markets satisfactorily supplied. But global inventories are drawing down none the less. And oil products is really what the world is consuming. So if global refinery throughput stays subdued, then demand will eventually have to match the supply of oil products. The likely path forward this summer is a steady draw down in jet fuel, diesel and gasoline. Higher prices for these. Then, if possible, higher refinery throughput and higher usage of crude in response to very profitable refinery margins. And lastly sharper draw in crude stocks and higher prices for these. But some 6 mb/d of oil products used to be exported through the Strait of Hormuz. And it may not be so easy to ramp up refinery activity across the world to compensate. Especially as Ukraine continues to damage Russian refineries as well as Russian crude production and export facilities.
Watch oil product stocks and prices as well as Brent calendar 2027. What to watch for this summer is thus oil product inventories falling and oil product premiums to crude rising. Another measure to watch is the Brent crude 2027 contract as it rises steadily day by day as the Strait of Hormuz stays closed and global oil inventories decline. The latter is close to the highest level since the start of the war and keeps rising.
The Brent M1 contract and the Brent 2027 prices and current price of jet fuel in Europe (ARA). All in USD/b

Our back of the envelope calculation of the global shortage created by the closure of the Strait of Hormuz. Note that 3.5 mb/d of discharge from SPR is also a draw. Note also that ’Forced demand loss’ of 2.5 mb/d is probably temporary and will fall back towards zero as logistics are sorted out leaving ’Price demand loss’ to do the job of balancing the market. Thus a shortfall of at least 9 mb/d created by the closure. More if SPR discharge is included and more if Forced demand loss recedes.

Brent is climbing higher. Front-month is at USD 106.3/bl this morning, close to a weekly high and a USD 9/bl jump from Mondays open. This is the move we flagged as a risk earlier in the week: the market shifting from ”a deal is around the corner” to ”this is going to take longer than we thought”.

Analyst Commodities, SEB
During April, rest-of-year Brent remained remarkably stable around USD 90/bl. A stability which rested on one single assumption: the SoH reopens around 1 May. That assumption is now slowly falling apart.
As we highlighted yesterday: every week of delay beyond 1 May adds (theoretically) ish USD 5/bl to the rest-of-year average, as global inventories draw 100 million barrels per week. i.e., a mid-May reopening implies rest-of-year Brent closer to USD 100/bl, and anything pushing into June or July takes us meaningfully higher.
What’s changed in the last 48 hours:
#1: The US military has formally warned that clearing suspected sea mines from SoH could take up to six months. That is a completely different timescale from what the financial market is pricing. Even a political deal tomorrow does not immediately reopen the strait.
#2: Trump has shifted his tone from urgency to ”strategic patience”. In yesterday’s press conference: ”Don’t rush me… I want a great deal.” The market is reading this as a president no longer feeling pressured by timelines, with the naval blockade running in the background.
#3: So far, the military activity is escalating, not de-escalating. Axios reports Iran is laying more mines in SoH. The US 3rd carrier strike group (USS George H.W. Bush) is arriving with two countermine vessels. Trump yesterday ordered the US Navy to destroy any Iranian boats caught laying mines. While CNN reports that the Pentagon is actively drawing up plans to strike Iranian SoH capabilities and individual Iranian military leaders if the ceasefire collapses. i.e., NOT a attitude consistent with an imminent deal!
Spot crude and product prices eased off the early-April highs on a combination of system rerouting and deal optimism. Both now weakening. Goldman estimates April Gulf output is reduced by 14.5 mbl/d, or 57% of pre-war supply, a number that keeps getting worse the longer this drags on.
Demand-side adaptation is ongoing: S. Korea has cut its Middle East crude dependence from 69% to 56% by pulling more from the Americas and Africa, and Japan is kicking off a second round of SPR releases from 1 May. But SPRs are finite.
Ref. to the negotiations, we should not bet on speed. The current Iranian leadership is dominated by genuine hardliners willing to absorb economic pain and run the clock to extract concessions. That is not a setup for a rapid resolution. US/Israeli media briefings keep framing the delay as ”internal Iranian divisions”, the reality is more complicated and points toward weeks and months, not days.
Our point is that the complexity is large, and higher prices have only just started (given a scenario where the negotiations drag out in time). The market spent April leaning on the USD 90/bl rest-of-year assumption; that case is diminishing by the hour. If ”early May reopening” is replaced by ”June, July or later” over the next week or two, both crude and products have meaningful room to reprice higher from here. There is a high risk being short energy and betting on any immediate political resolution(!).
Down on Friday. Up on Monday. The Brent June crude oil contract traded down 5.1% last week to a close of $90.38/b. It reached a high of $103.87/b last Monday and a low of $86.09/b on Friday as Iran announced that the Strait of Hormuz was fully open for transit. That quickly changed over the weekend as the US upheld its blockade of Iranian oil exports while Iran naturally responded by closing the SoH again. The US blew a hole in the engine room of the Iranian ship TOUSKA and took custody of the ship on Sunday. Brent crude is up 5.6% this morning to $95.4/b.
The cease-fire is expiring tomorrow. The US has said it will send a delegation for a second round of negotiations in Islamabad in Pakistan. But Iran has for now rejected a second round of talks as it views US demands as unrealistic and excessive while the US is also blocking the Strait of Hormuz.
While Brent is up 5% this morning, the financial market is still very optimistic that progress will be made. That talks will continue and that the SoH will fully open by the start of May which is consistent with a rest-of-year average Brent crude oil price of around $90/b with the market now trading that balance at around $88/b.
Financial optimism vs. physical deterioration. We have a divergence where the financial market is trading negotiations, improvements and resolution while at the same time the physical market is deteriorating day by day. Physical oil flows remain constrained by disrupted flows, longer voyage times and elevated freight and insurance costs.
Financial markets are betting that a US/Iranian resolution will save us in time from violent shortages down the road. But every day that the SoH remains closed is bringing us closer to a potentially very painful point of shortages and much higher prices.
The US blockade is also a weapon of leverage against its European and Asian allies. When Iran closed the SoH it held the world economy as a hostage against the US. The US blockade of the SoH is of course blocking Iranian oil exports. But it is also an action of disruption directed towards Europe and Asia. The US has called for the rest of the world to engaged in the war with Iran: ”If you want oil from the Persian Gulf, then go and get it”. A risk is that the US plays brinkmanship with the global oil market directed towards its European and Asian allies and maybe even towards China to force them to engage and take part. Maybe unthinkable. But unthinkable has become the norm with Trump in the White House.


Oil product price pain is set to rise as the Strait of Hormuz stays closed into summer

Solkraften pressar elpriserna dagtid

Michel Gubel ger sin syn på oljemarknaden


