

Analys
SHB Råvarubrevet 13 september 2013

 Råvaror allmänt
I väntan på Fed
Det närmar sig den 18:e september då amerikanska centralbanken väntas ge besked om nedskalningen av obligationsköparprogrammen. Det har skrivits spaltmeter om detta ämne och det råder en bred konsensus om att Fed kommer minska köpen med 10-15 miljarder USD per månad. Vi har argumenterat för att detta är så gott som inprisat och tror inte att senaste tidens risker kring Mellanöstern kommer påverka Feds beslut. Intressant blir det däremot att se vad Fed signalerar kring framtida ränteläget. På onsdag får vi veta.
Vårt scenario med en global konjunkturbotten som ligger bakom oss fick fortsatt stöd under veckan med augustidata från Kina som var bättre än väntat. Industriproduktion, investeringar och återförsäljning stiger alla och pekar på en vändning under Q3 i Kina. Vår tro på att Q3:s BNP kommer överraska på uppsidan står fast och vi tycker att den synen har fått stöd i augusti månads barometerdata. Risken för en militär aktion från USA har minskat under veckan efter mötet i Genève. 4 dollar av riskpremien i Brentolja också pyst ut. LME metallerna har tappat sitt starka momentum från augusti. De positiva kinanyheterna klarar inte att vidhålla något rally utan negativa nyheter tar överhanden. Vi tror trots det att makrotrenden i Kina kommer vända trenden snart.
Basmetaller
Motigt trots starkt Kina
Trots positiv kinadata har basmetallerna fallit tillbaka något under veckan på oro för Fed´s tapering. Även Syrienoro kvarstår och gynnar inte risktillgångar som basmetaller och till det lägger vi till sämre än väntad industriproduktion från EU som pressade metallerna, främst kopparn, under veckan. Vi upprepar vår tro att den starka makrotrenden i Kina kommer vända trenden för metallerna snart.
Tenn, som steg kraftigt förra veckan efter nya exportregler i Indonesien, faller denna vecka med 2,3 %. Utbudstörningar i form av exportbegränsningar från världens största producent väntas fortsätta ge stöd åt priset. Då tenn används i tillverkningen av tv, datorer och telefoner visar prognoser samtidigt på ökad efterfråga. Stark makrodata bör ge stöd åt metallerna och vi behåller en positiv vy för denna sektor.
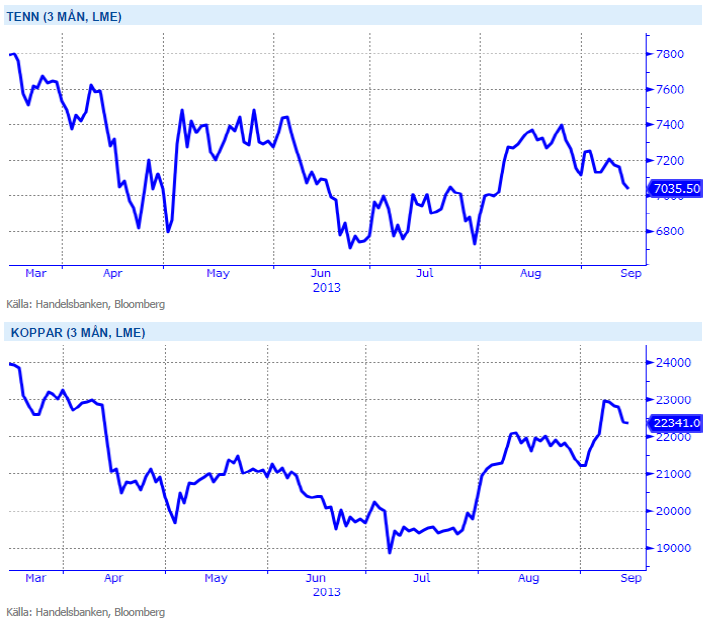
Kinas kopparimport har återigen ökat och såväl inhemska som globala lager har minskat samtidigt som investerare täckt sina korta positioner. Vi tror på: LONG KOPPAR
Ädelmetaller
Guldet fortsätter ned
Guldet har tappat ganska rejält under veckan som gått, drivet av USA:s mildrade retorik i Syrien-frågan. Hela fem procents nedgång på en vecka noterar vi, även om det är väldigt långt från rörelsen i april då det föll nästan 15 procent på bara två dagar. Vår kortsiktigt positiva syn kvarstår, även om det nu börjar kännas utmanande givet vår mer negativa långsiktiga syn. Vi tror dock att det är för tidigt att kasta in handduken på långa guldpositioner, av ett par skäl:
- Vi ser tecken på att inflationen kan komma att stiga, och att det är anledningen till att Fed kommer att guida mot högre räntor (tapering). Inflation är ingen långsiktig drivkraft för guldet, det har vi argumenterat tidigare, men den kortsiktiga effekten kan ge guldet en knuff uppåt.
- Även om retoriken mildrats runt Syrien-situationen så kommer det att kvarstå en hög risk för att något händer, vilket kommer att kunna leda till ”safe haven”-köp av guld.
- Vi ser ett generellt positivt momentum runt råvaror i den makromiljö vi har nu med stigande tillväxt och stigande inflation. Om övriga råvaror stiger tror vi att guldet kommer att följa med, åtminstone på kort sikt.
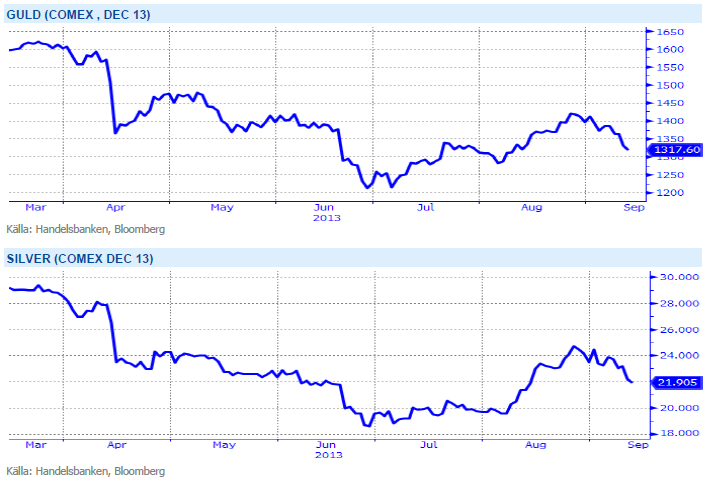
I ett läge där råvaror generellt har viktats ned av institutionella placerare kan guld och silver få en ”omotiverad” uppgång när dessa indexköpare återvänder till råvaror drivit av bättre utsikter för Kina och USA. Vi tror på: LONG GULD H och LONG SILVER H
Energi
Riskpremien pyser ut
Oljan föll med över 4 procent som mest efter att risken för en amerikansk intervention och upptrappning av konflikten kring Syrien minskat. Marknaden finner dock stöd mot slutet av veckan då Libyen deklarerat force majeure på ytterligare tre terminaler som dragits med problem under flera veckor. Även om Saudiarabien bör kunna täcka upp för detta bortfall de kommande månaderna tär det på en redan ansträngd reservkapacitet och vi anser att det ger fog för nuvarande riskpremie med potential på uppsidan. IEA reviderar dessutom upp sina tillväxtsiffror för global efterfrågan nästa år med 1.1 miljoner fat (+1.2 procent) till 92 miljoner fat. Intressant att notera att IEA även räknar med att USA passerar Ryssland om man ser till produktion av flytande bränslen. Slår vi ihop Olja och NGL förväntas USA nå 10.2 miljoner fat per dag att jämföra med Rysslands produktion om 10.8 mfpd men lägger vi även till den stora andelen av biobränslen bör USA passare Ryssland och nå en bit över 11 miljoner fat.
Elmarknaden och kvartalet Q1 2014 handlas i princip oförändrad under veckan och vi ligger kvar med vår rekommendation om köp då flertalet faktorer fortsatt pekar upp. Spotpriset överraskar på uppsidan men denna vecka är det främst utsläppsrätterna som stärks vilket drar med sig den tyska elmarknaden.
Kolet ångar på om än i måttlig takt vilket i kombination med en starkare dollar (mot euron) innebär ett något högre brytpris för kolgenererad kraft. Väderprognoserna visar på blött väder i mitten av perioden men en något torrare avslutning gör att energibalansen pekar på ett fortsatt underskott om ca 10 TWh.
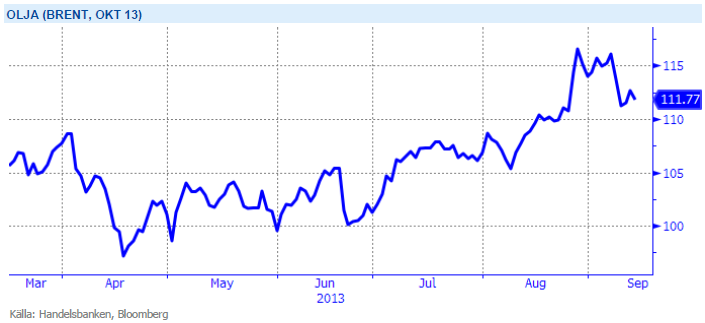
Oroligheterna i mellanöstern med risk för ytterligare produktionsbortfall ger stöd till oljepriset. Vi tror på: LONG OLJA
Livsmedel
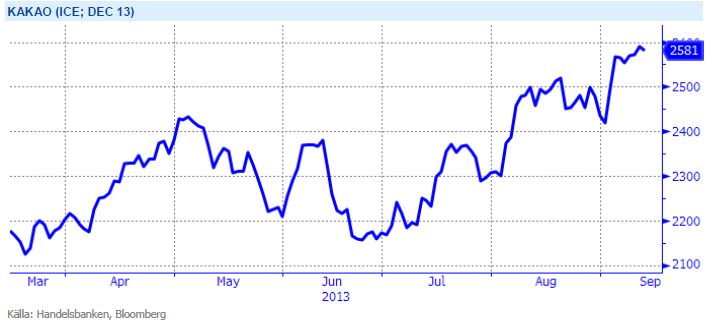
Kakao på årshögsta
Majsskörden går framåt i både USA och EU med bättre än väntad avkastning och kvalitet. Torsdagens rapport från amerikanska jordbruksdepartementet, USDA, visade på högre än väntad produktion av majs vilket pressade priset. Det ser ut att finnas gott om majs framöver i världen och svårt att se priserna gå upp från dagens nivåer. Det blir klart intressant att följa den fortsatta avkastningsnivån för den amerikanska majsen när skörden går norrut men några större överraskningar blir allt svårare att se. Torsdagens rapport visade dock lägre amerikanska lager än förväntat på sojabönor som fick priset att stiga med 4 %. Brist på nederbörd i kombination med varmt väder under augusti månad justerades avkastningen för de amerikanska sojabönorna ned igår och risken för ytterligare sänkningar är inte över än. Vi väntar oss därför en fortsatt nervös marknad kommande veckor tills faktiska avkastningsnivåer blivit mer känt. Uppsidan bedöms dock som ganska begränsad nu som följd av att en stor kommande brasiliansk skörd väntas – dock några månader tills dess. Brasilianska lantbrukare kan idag sälja kommande skörd på termin till rekordhöga priser hjälpt av en svag inhemsk valuta – vilket väntas leda till en rekordhög areal.
Den senaste tidens stigande Lean Hogspriser (gris) är drivet att dyrare priser på nötkött i USA. Fler och fler väljer därför fläsk, vilket har pressat upp priset till nivåer kring 90 cent/Ib. För oss som följt kakaons starka resa under året vet att den extrema hettan i juli vid Afrikas västkust följt av nederbörd under normalen i augusti hotar produktionen från Elfenbenskusten och Ghana. I skrivande stund handlas decemberkontraket över 2 590 dollar/ton, vilket är årshögsta för denna lyxiga mjuka råvara. Dock väntas bättre väderförhållanden för skörden som nu går mot slutfasen. Kaffe-priset däremot fortsätter att backa och har under veckan handlats till fyra års lägsta.
Förväntningar på den kommande risproduktionen är stor och prognoser visar på välfyllda lager. Vi tror på: SHORT RIS
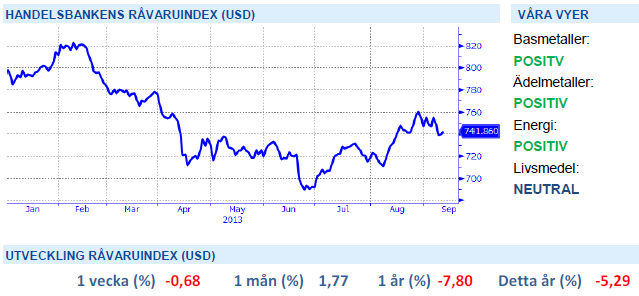
Handelsbankens Råvaruindex
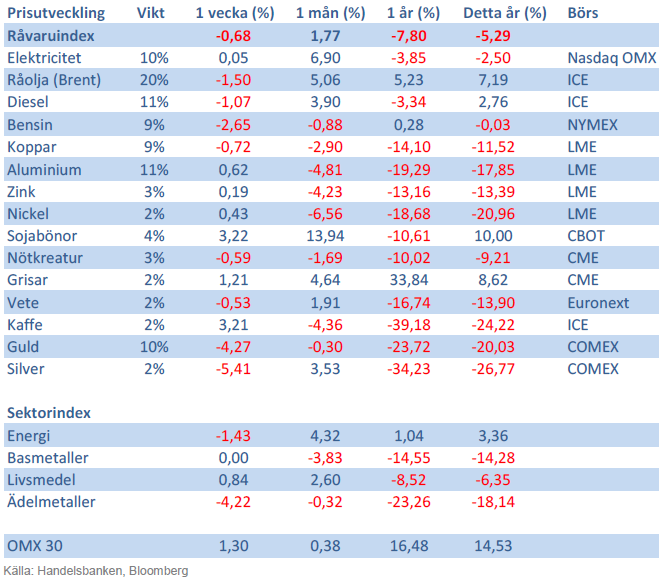
Handelsbankens råvaruindex består av de underliggande indexen för respektive råvara. Vikterna är bestämda till hälften från värdet av nordisk produktion (globala produktionen för sektorindex) och till hälften från likviditeten i terminskontrakten.
[box]SHB Råvarubrevet är producerat av Handelsbanken och publiceras i samarbete och med tillstånd på Råvarumarknaden.se[/box]
Ansvarsbegränsning
Detta material är producerat av Svenska Handelsbanken AB (publ) i fortsättningen kallad Handelsbanken. De som arbetar med innehållet är inte analytiker och materialet är inte oberoende investeringsanalys. Innehållet är uteslutande avsett för kunder i Sverige. Syftet är att ge en allmän information till Handelsbankens kunder och utgör inte ett personligt investeringsråd eller en personlig rekommendation. Informationen ska inte ensamt utgöra underlag för investeringsbeslut. Kunder bör inhämta råd från sina rådgivare och basera sina investeringsbeslut utifrån egen erfarenhet.
Informationen i materialet kan ändras och också avvika från de åsikter som uttrycks i oberoende investeringsanalyser från Handelsbanken. Informationen grundar sig på allmänt tillgänglig information och är hämtad från källor som bedöms som tillförlitliga, men riktigheten kan inte garanteras och informationen kan vara ofullständig eller nedkortad. Ingen del av förslaget får reproduceras eller distribueras till någon annan person utan att Handelsbanken dessförinnan lämnat sitt skriftliga medgivande. Handelsbanken ansvarar inte för att materialet används på ett sätt som strider mot förbudet mot vidarebefordran eller offentliggörs i strid med bankens regler.


So far this week, Brent Crude prices have strengthened by USD 1.3 per barrel since Monday’s opening. While macroeconomic concerns persist, they have somewhat abated, resulting in muted price reactions. Fundamentals predominantly influence global oil price developments at present. This week, we’ve observed highs of USD 89 per barrel yesterday morning and lows of USD 85.7 per barrel on Monday morning. Currently, Brent Crude is trading at a stable USD 88.3 per barrel, maintaining this level for the past 24 hours.

Additionally, there has been no significant price reaction to Crude following yesterday’s US inventory report (see page 11 attached):
- US commercial crude inventories (excluding SPR) decreased by 6.4 million barrels from the previous week, standing at 453.6 million barrels, roughly 3% below the five-year average for this time of year.
- Total motor gasoline inventories decreased by 0.6 million barrels, approximately 4% below the five-year average.
- Distillate (diesel) inventories increased by 1.6 million barrels but remain weak historically, about 7% below the five-year average.
- Total commercial petroleum inventories (crude + products) decreased by 3.8 million barrels last week.
Regarding petroleum products, the overall build/withdrawal aligns with seasonal patterns, theoretically exerting limited effect on prices. However, the significant draw in commercial crude inventories counters the seasonality, surpassing market expectations and API figures released on Tuesday, indicating a draw of 3.2 million barrels (compared to Bloomberg consensus of +1.3 million). API numbers for products were more in line with the US DOE.
Against this backdrop, yesterday’s inventory report is bullish, theoretically exerting upward pressure on crude prices.
Yet, the current stability in prices may be attributed to reduced geopolitical risks, balanced against demand concerns. Markets are adopting a wait-and-see approach ahead of Q1 US GDP (today at 14:30) and the Fed’s preferred inflation measure, “core PCE prices” (tomorrow at 14:30). A stronger print could potentially dampen crude prices as market participants worry over the demand outlook.
Geopolitical “risk premiums” have decreased from last week, although concerns persist, highlighted by Ukraine’s strikes on two Russian oil depots in western Russia and Houthis’ claims of targeting shipping off the Yemeni coast yesterday.
With a relatively calmer geopolitical landscape, the market carefully evaluates data and fundamentals. While the supply picture appears clear, demand remains the predominant uncertainty that the market attempts to decode.
Brent crude has fallen USD 3/b since the peak of Iran-Israel concerns last week. Still lots of talk about significant Mid-East risk premium in the current oil price. But OPEC+ is in no way anywhere close to loosing control of the oil market. Thus what will really matter is what OPEC+ decides to do in June with respect to production in Q3-24 and the market knows this very well. Saudi Arabia’s social cost-break-even is estimated at USD 100/b today. Also Saudi Arabia’s purse is hurt by 21% US inflation since Jan 2020. Saudi needs more money to make ends meet. Why shouldn’t they get a higher nominal pay as everyone else. Saudi will ask for it

Brent is down USD 3/b vs. last week as the immediate risk for Iran-Israel has faded. But risk is far from over says experts. The Brent crude oil price has fallen 3% to now USD 87.3/b since it became clear that Israel was willing to restrain itself with only a muted counter attack versus Israel while Iran at the same time totally played down the counterattack by Israel. The hope now is of course that that was the end of it. The real fear has now receded for the scenario where Israeli and Iranian exchanges of rockets and drones would escalate to a point where also the US is dragged into it with Mid East oil supply being hurt in the end. Not everyone are as optimistic. Professor Meir Javedanfar who teaches Iranian-Israeli studies in Israel instead judges that ”this is just the beginning” and that they sooner or later will confront each other again according to NYT. While the the tension between Iran and Israel has faded significantly, the pain and anger spiraling out of destruction of Gaza will however close to guarantee that bombs and military strifes will take place left, right and center in the Middle East going forward.
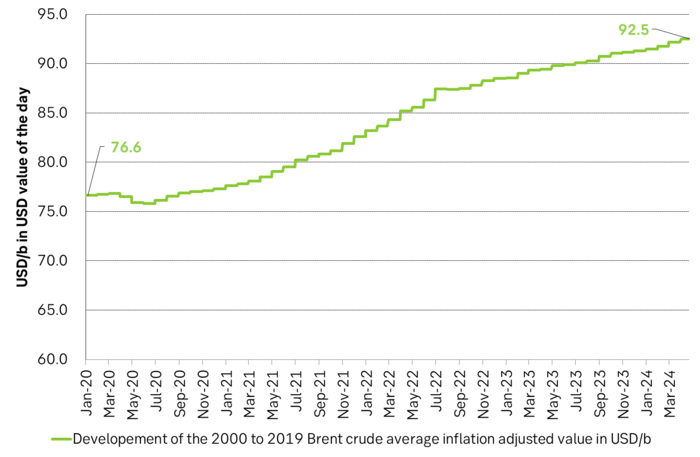
Also OPEC+ wants to get paid. At the start of 2020 the 20 year inflation adjusted average Brent crude price stood at USD 76.6/b. If we keep the averaging period fixed and move forward till today that inflation adjusted average has risen to USD 92.5/b. So when OPEC looks in its purse and income stream it today needs a 21% higher oil price than in January 2020 in order to make ends meet and OPEC(+) is working hard to get it.
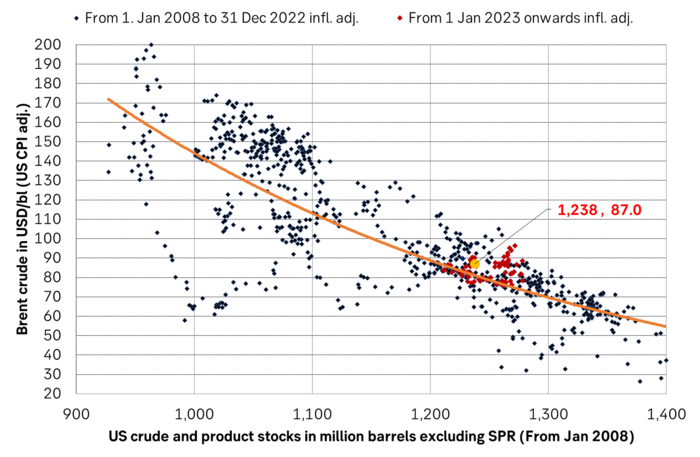
Much talk about Mid-East risk premium of USD 5-10-25/b. But OPEC+ is in control so why does it matter. There is much talk these days that there is a significant risk premium in Brent crude these days and that it could evaporate if the erratic state of the Middle East as well as Ukraine/Russia settles down. With the latest gains in US oil inventories one could maybe argue that there is a USD 5/b risk premium versus total US commercial crude and product inventories in the Brent crude oil price today. But what really matters for the oil price is what OPEC+ decides to do in June with respect to Q3-24 production. We are in no doubt that the group will steer this market to where they want it also in Q3-24. If there is a little bit too much oil in the market versus demand then they will trim supply accordingly.
Also OPEC+ wants to make ends meet. The 20-year real average Brent price from 2000 to 2019 stood at USD 76.6/b in Jan 2020. That same averaging period is today at USD 92.5/b in today’s money value. OPEC+ needs a higher nominal price to make ends meet and they will work hard to get it.
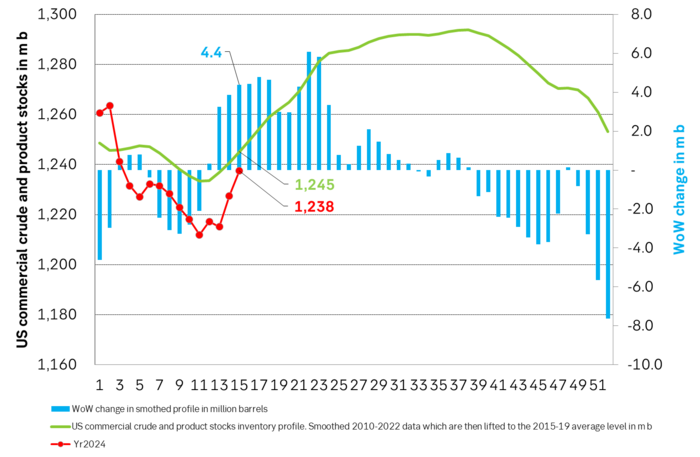
Inflation adjusted Brent crude price versus total US commercial crude and product stocks. A bit above the regression line. Maybe USD 5/b risk premium. But type of inventories matter. Latest big gains were in Propane and Other oils and not so much in crude and products
Total US commercial crude and product stocks usually rise by 4-5 m b per week this time of year. Gains have been very strong lately, but mostly in Propane and Other oils
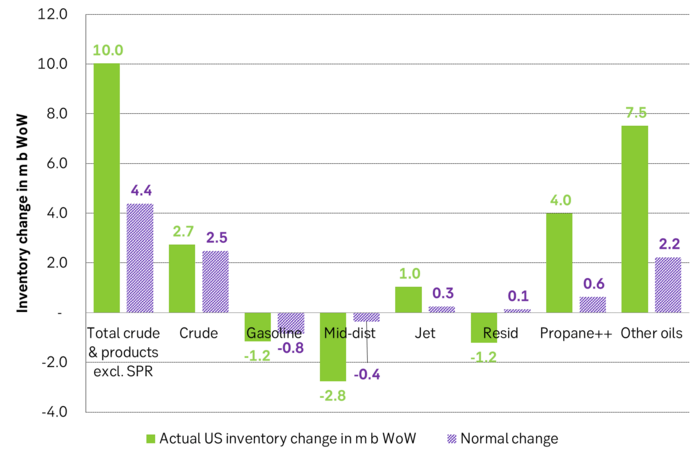
Last week’s US inventory data. Big rise of 10 m b in commercial inventories. What really stands out is the big gains in Propane and Other oils
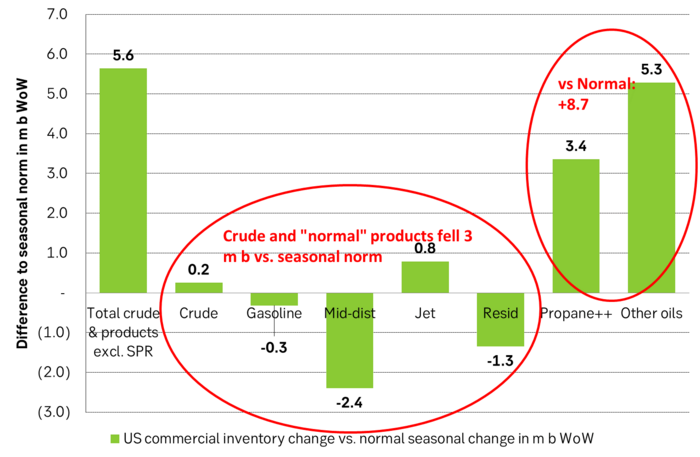
Take actual changes minus normal seasonal changes we find that US commercial crude and regular products like diesel, gasoline, jet and bunker oil actually fell 3 m b versus normal change.
Historically positive Nat gas to EUA correlation will likely switch to negative in 2026/27 onward
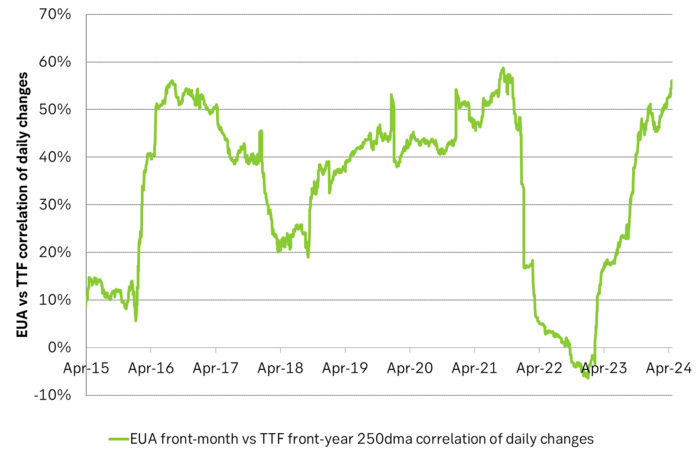
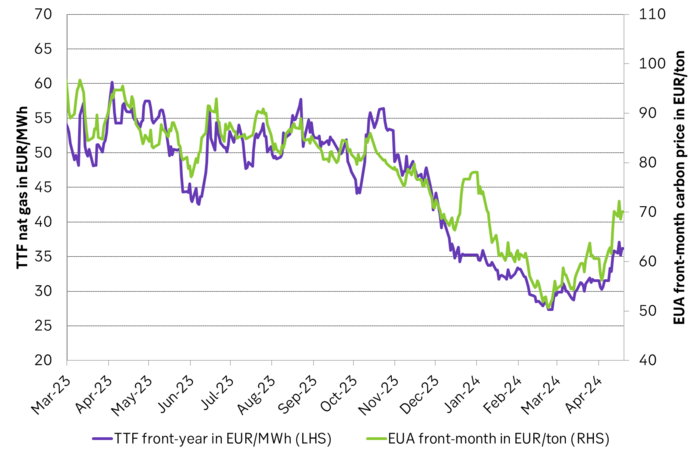
Historically there has been a strong, positive correlation between EUAs and nat gas prices. That correlation is still fully intact and possibly even stronger than ever as traders increasingly takes this correlation as a given with possible amplification through trading action.
The correlation broke down in 2022 as nat gas prices went ballistic but overall the relationship has been very strong for quite a few years.
The correlation between nat gas and EUAs should be positive as long as there is a dynamical mix of coal and gas in EU power sector and the EUA market is neither too tight nor too weak:
Nat gas price UP => ”you go black” by using more coal => higher emissions => EUA price UP
But in the future we’ll go beyond the dynamically capacity to flex between nat gas and coal. As the EUA price moves yet higher along with a tightening carbon market the dynamical coal to gas flex will max out. The EUA price will then trade significantly above where this flex technically will occur. There will still be quite a few coal fired power plants running since they are needed for grid stability and supply amid constrained local grids.
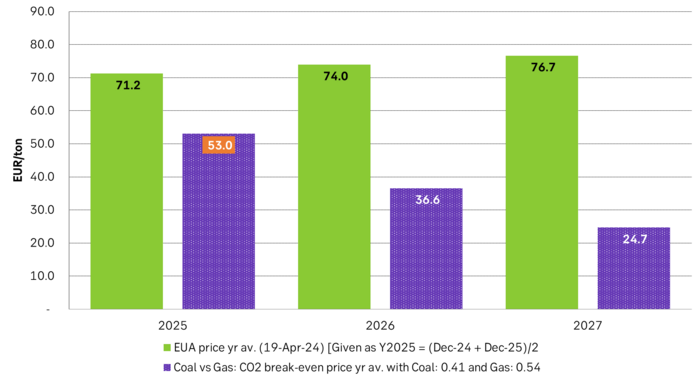
As it looks now we still have such overall coal to gas flex in 2024 and partially in 2025, but come 2026 it could be all maxed out. At least if we look at implied pricing on the forward curves where the forward EUA price for 2026 and 2027 are trading way above technical coal to gas differentials. The current forward pricing implications matches well with what we theoretically expect to see as the EUA market gets tighter and marginal abatement moves from the power sector to the industrial sector. The EUA price should then trade up and way above the technical coal to gas differentials. That is also what we see in current forward prices for 2026 and 2027.
The correlation between nat gas and EUAs should then (2026/27 onward) switch from positive to negative. What is left of coal in the power mix will then no longer be dynamically involved versus nat gas and EUAs. The overall power price will then be ruled by EUA prices, nat gas prices and renewable penetration. There will be pockets with high cost power in the geographical points where there are no other alternatives than coal.
The EUA price is an added cost of energy as long as we consume fossil energy. Thus both today and in future years we’ll have the following as long as we consume fossil energy:
EUA price UP => Pain for consumers of energy => lower energy consumption, faster implementation of energy efficiency and renewable energy => lower emissions
The whole idea with the EUA price is after all that emissions goes down when the EUA price goes up. Either due to reduced energy consumption directly, accelerated energy efficiency measures or faster switch to renewable energy etc.
Let’s say that the coal to gas flex is maxed out with an EUA price way above the technical coal to gas differentials in 2026/27 and later. If the nat gas price then goes up it will no longer be an option to ”go black” and use more coal as the distance to that is too far away price vise due to a tight carbon market and a high EUA price. We’ll then instead have that:
Nat gas higher => higher energy costs with pain for consumers => weaker nat gas / energy demand & stronger drive for energy efficiency implementation & stronger drive for more non-fossil energy => lower emissions => EUA price lower
And if nat gas prices goes down it will give an incentive to consume more nat gas and thus emit more CO2:
Cheaper nat gas => Cheaper energy costs altogether, higher energy and nat gas consumption, less energy efficiency implementations in the broader economy => emissions either goes up or falls slower than before => EUA price UP
Historical and current positive correlation between nat gas and EUA prices should thus not at all be taken for granted for ever and we do expect this correlation to switch to negative some time in 2026/27.
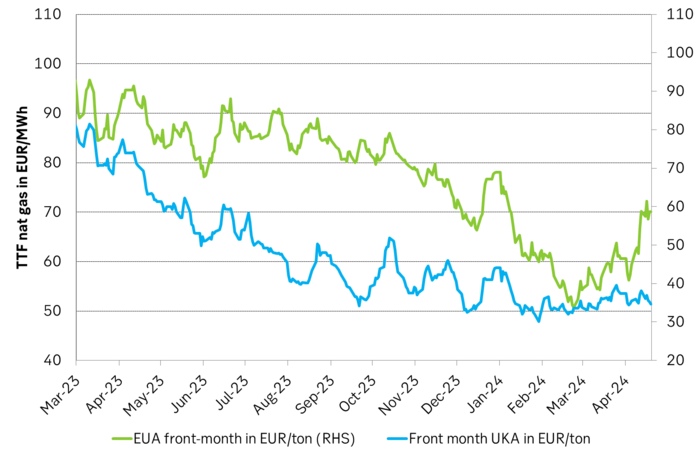
In the UK there is hardly any coal left at all in the power mix. There is thus no option to ”go black” and burn more coal if the nat gas price goes up. A higher nat gas price will instead inflict pain on consumers of energy and lead to lower energy consumption, lower nat gas consumption and lower emissions on the margin. There is still some positive correlation left between nat gas and UKAs but it is very weak and it could relate to correlations between power prices in the UK and the continent as well as some correlations between UKAs and EUAs.
Correlation of daily changes in front month EUA prices and front-year TTF nat gas prices, 250dma correlation.
EUA price vs front-year TTF nat gas price since March 2023
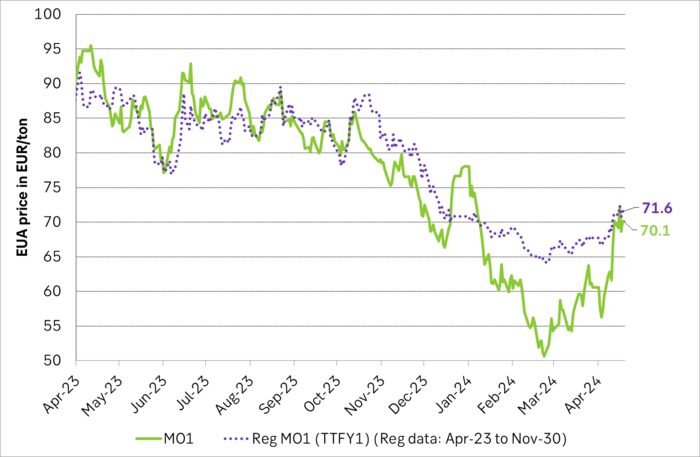
Front-month EUA price vs regression function of EUA price vs. nat gas derived from data from Apr to Nov last year.
The EUA price vs the UKA price. Correlations previously, but not much any more.
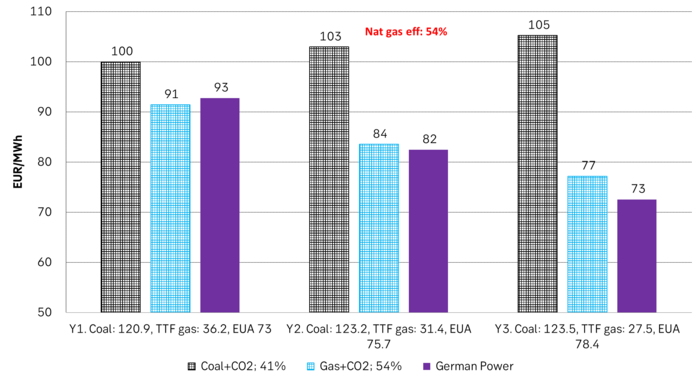
Forward German power prices versus clean cost of coal and clean cost of gas power. Coal is totally priced out vs power and nat gas on a forward 2026/27 basis.
Forward price of EUAs versus technical level where dynamical coal to gas flex typically takes place. EUA price for 2026/27 is at a level where there is no longer any price dynamical interaction or flex between coal and nat gas. The EUA price should/could then start to be negatively correlated to nat gas.
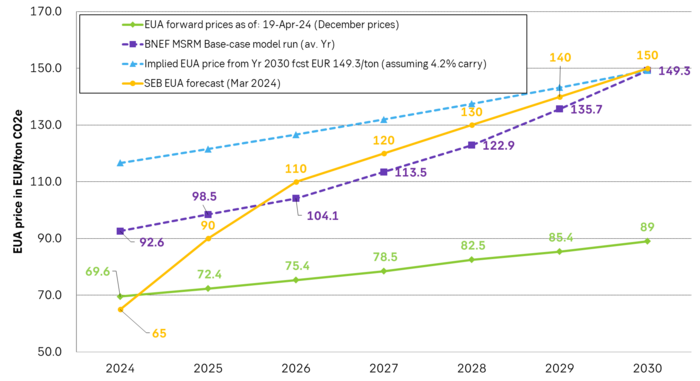
Forward EAU price vs. BNEF base model run (look for new update will come in late April), SEB’s EUA price forecast.


’wait and see’ mode
Also OPEC+ wants to get compensation for inflation

Oljan letar efter en högre botten

Börsveckan ger en köprekommendation till aktien i oljeservicebolaget Beerenberg
Nat gas to EUA correlation will likely switch to negative in 2026/27 onward

Guldpriset når nytt all time high och bryter igenom 2300 USD

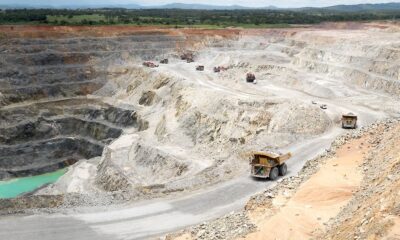
Lundin Mining får köprekommendation av BMO

Centralbanker fortsatte att köpa guld under februari

USAs stigande konsumtion av naturgas

Kakaomarknaden är extrem för tillfället
-
 Nyheter3 veckor sedan
Guldpriset når nytt all time high och bryter igenom 2300 USD
-
 Nyheter4 veckor sedan
Lundin Mining får köprekommendation av BMO
-
 Nyheter3 veckor sedan
Centralbanker fortsatte att köpa guld under februari
-
 Nyheter3 veckor sedan
USAs stigande konsumtion av naturgas
-
 Nyheter3 veckor sedan
Kakaomarknaden är extrem för tillfället
-

 Nyheter3 veckor sedan
Hur mår den svenska skogsbraschen? Två favoritaktier
-

 Nyheter4 veckor sedan
Boliden på 20 minuter
-

 Nyheter3 veckor sedan
Betydande underskott i utbudet av olja kan få priset att blossa upp