

Analys
SEB – Råvarukommentarer, 16 september 2013

Rekommendationer
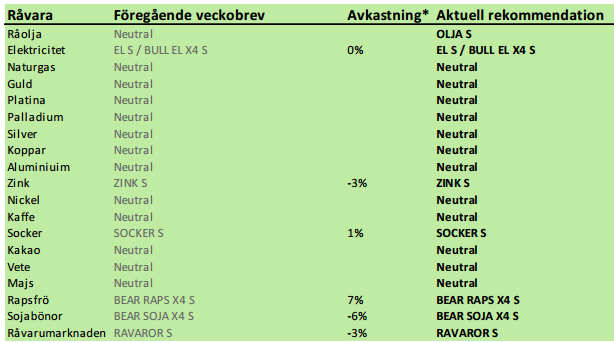
*) Avkastningen anges för 1:1 certifikaten där både BULL och 1:1 certifikat är angivna.
Inledning
Elmarknaden går kanske ner i veckan eftersom det ostadiga vädret har anlänt. Eftersom trenden är så tydligt positiv på marknaderna för kol och utsläppsrätter bör man ta ett sådant tillfälle i akt och köpa certifikat på el. Det kan bli en mycket bra affär.
De höga priserna på olja har fått oljeproducenter att sälja sin produkt på termin. Detta gör att avkastningen för dem som investerar i oljemarknaden via terminer erbjuds bra avkastning. Den rekyl nedåt som USA:s inställda angrepp på Syrien föranlett, är ett bra tillfälle att placera i oljemarknaden via certifikatet OLJA S.
USA:s jordbruksdepartement USDA publicerade sin månadsvisa uppdatering av utbud och efterfrågan på världsmarknaden. Den var negativ för priset på vete och majs, men neutral på soja. Sojapriset steg och det tror vi beror på att vissa aktörer lider av en psykologisk anspänning, snarare än något med grund i fakta. Vi upprepar vår säljrekommendation på soja och raps.
Två rapporter kom, i polemik med Czarnikows prognos om ett mindre överskott än väntat i sockermarknaden. Men kontentan var ändå att överskottet blir mindre än tidigare prognostiserats.
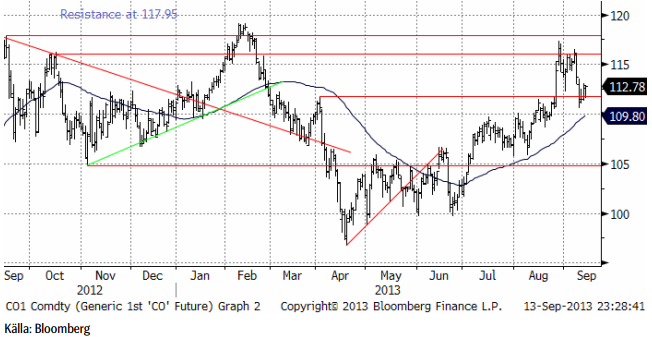
Råolja – Brent
Oljepriset föll tillbaka när det gick upp för alla – även de som inte läst det här veckobrevet – att USA inte skulle eskalera konflikten med Syrien. Som vi skrev för redan två veckor sedan var det uppenbart att USA:s president inte skulle fullfölja sitt hot. Syrienkonflikten skulle kunna ha påverkat producerande länder, så att oljepriset påverkats, men det finns även andra faktorer som faktiskt har en påverkan på oljepriset och som fått verka i det tysta. Libyens produktion har haft problem och efterfrågan har fått skjuts av den ekonomiska återhämtningen som sker i hela världen. Oljepriset befinner sig i en positiv trend rent tekniskt. Priset har gott stöd vid 110 dollar per fat, men motstånd vid 118 dollar ungefär. Fortfarande handlas oljepriset inom det prisintervall som varit rådande sedan tre år tillbaka.
Terminskurvorna för Brent (den översta) och den av lager- och transportkapacitet strypta marknaden för West Texas Intermediate ligger lite lägre.
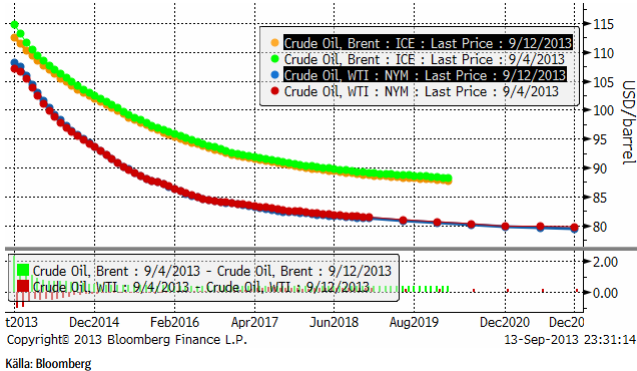
Tidningen Energy Risk skrev i fredags en artikel om att de höga priserna lockat fram en våg av prissäkring från amerikanska oljebolag. Dessa säljer framtida produktion på termin och lyckas på så sätt minska risken i sin verksamhet. De gör detta trots att terminspriserna är lägre än spotpriserna därför att de vinner i minskad osäkerhet. De är med andra ord villiga att betala försäkringspremien till dem som köper terminerna – och bär risken i deras ställe.
För råvaruinvesterare är den här rabatten nu väldigt attraktiv. Man kan tjäna ca 7 – 10% extra på att äga råoljeterminer.
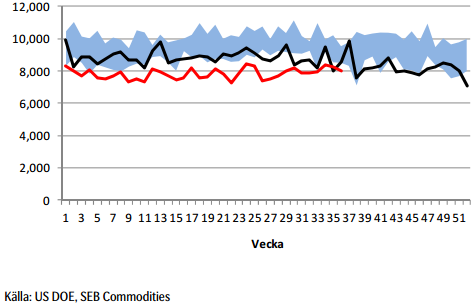
Råoljelagren fortsätter att minska i USA.
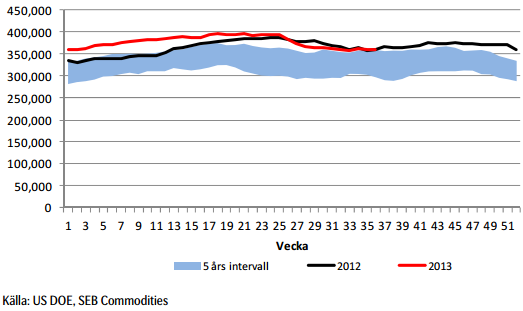
Importen år 2013 (röd) minskade i den senaste rapporten från DOE.
När nu priset fallit tillbaka och rabatten på terminer är så attraktiv, tycker vi att det är ett bra tillfälle att komma in i den lönsamma oljemarknaden och rekommenderar köp av OLJA S. Det är framförallt rabatten på terminerna vi vill komma åt och därför föredrar vi OLJA S framför t ex BULL OLJA X4 S.
Elektricitet
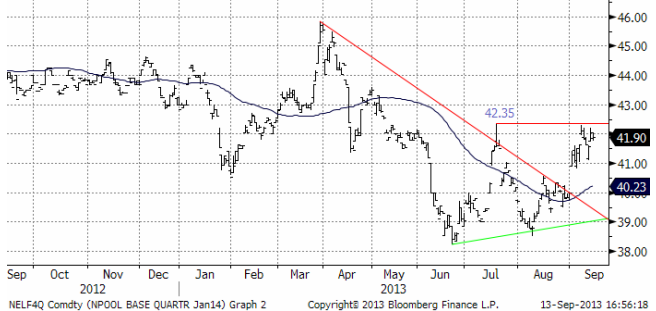
Nedan ser vi prisdiagrammet på det första kvartalets 2014 kontrakt. Det är det kontrakt som är underliggande för certifikaten sedan början på månaden.
Man har gjort försök att få igång O3:an i veckan, utan att lyckas. Finnarna har inte heller fått igång sin. Kärnkraften går just nu på halva sin installerade kapacitet.
Väderleksprognoserna visar fortsatt blött. Det ostadiga vädret väntas komma nu.
Tekniskt har motståndet vid 41.35 hållit stånd. Det är inte otänkbart att blötare väder och kärnkraftverk som kommer igång, kan få priset att rekylera ner från fredagens stängningspris på 41.90 euro per MWh. En sådan rekyl betraktar vi som ett utmärkt köptillfälle.
Som nämnt ovan, har den nordiska kärnkraften fortsätta problem. I fredags producerades endast 51% av den installerade kapaciteten. OKG kommer att starta om Oskarshamn 3 klockan 15:00 på tisdag. Reaktorn har varit avstängd sedan den 1 september och tre försök att återstarta den har misslyckats. OKG har skjutit upp starten av Orskarshamn 1 från i torsdags till måndagen. Reaktorn har varit avstängd sedan den 9 juli pga ventilproblem. PVO kommer att återstarta Olkiluoto 2 på tisdag. Reaktorn stängdes i måndags förra veckan pga en överhettad generator. Ringhals 2, Ringhals 3, Orskarshamn 2 och Loviisa 2 var avstängda för det årliga underhållet.
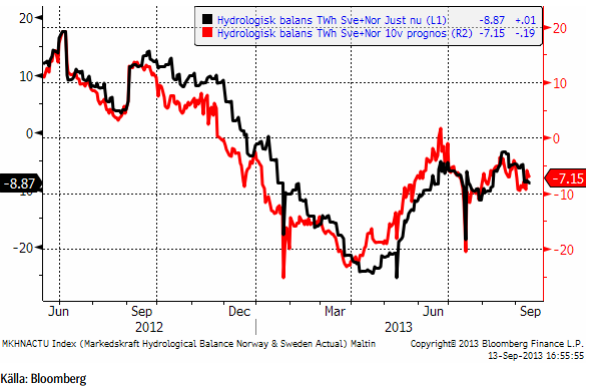
Hydrologisk balans har fortsatt att försämras, särskilt prognosen.
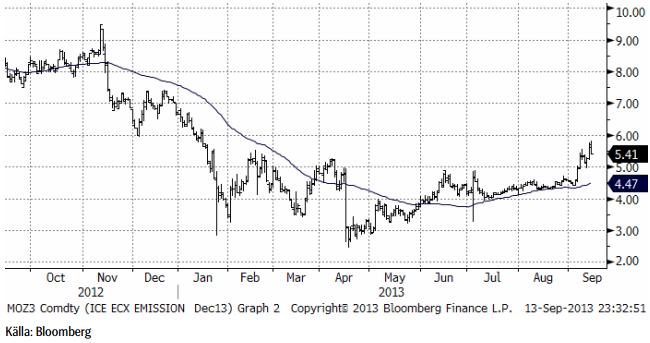
Marginalkostnaden för att producera el bestäms av priset på kol och priset på utsläppsrätter. Nedan ser vi priset på utsläppsrätter i euro / ton. Notera den fortsatta prisuppgången.
Nedan ser vi terminspriset för månaden, på energikol i Rotterdam. Vi ser att marknaden har vänt uppåt. Trenden är bruten. Detta har indirekt, men helt säkert, en påverkan på prisnivån på nordisk elektricitet. Vi väntar oss en fortsatt återhämtning i kolpriset åtminstone upp till 95 dollar per ton. Och därmed motsvarande prisuppgång på nordisk elektricitet. Dessutom tror vi på en procentuellt sett väsentligt högre prisuppgång på utsläppsrätter.
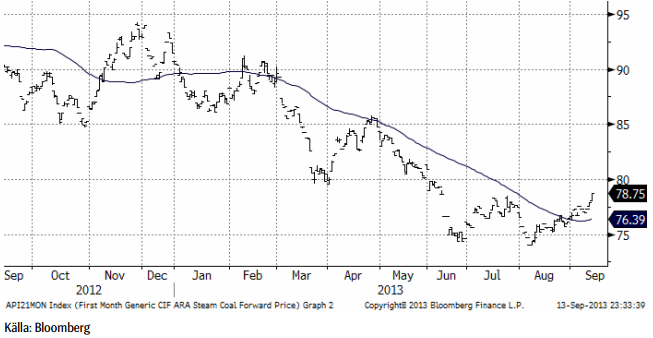
Vi rekommenderar alltså köp av el, t ex EL S eller BULL EL X4 S.
Naturgas
Naturgaspriset studsade på 3.60 i veckan och stängde i fredags på 3.75. Tekniskt motstånd ligger på 3.80.
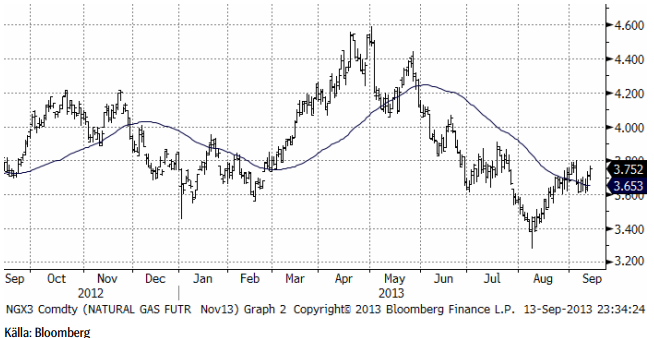
Vi har neutral rekommendation.
Guld & Silver
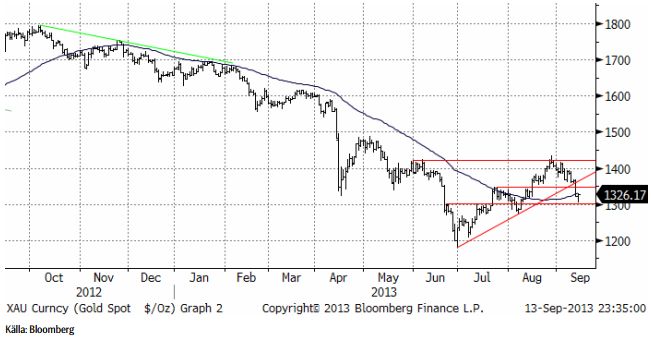
Guldpriset föll ned till stödet på 1300 dollar per troy uns, efter att ha brutit stödet för uppgången från juni / juli. Vi har tidigare sagt att vi betraktar hela uppgången från juni / juli som en rekyl mot den fallande trenden. Goldman Sachs publicerade en rapport i fredags, där de säger att priset på guld kan falla så långt som till 1000 dollar per troy uns. Goldman Sachs har emellertid en tendens att göra prognoser som påminner om rena extrapoleringar av trender. Det går sällan så långt som Goldman Sachs analytiker har förutspått. Vi delar dock vyn att priset på guld förmodligen kommer att falla vidare. I det riktigt korta perspektivet noterar vi dock att 1300 dollar är ett starkt tekniskt stöd, varifrån marknaden kan samla kraft och göra ett nytt försök uppåt.
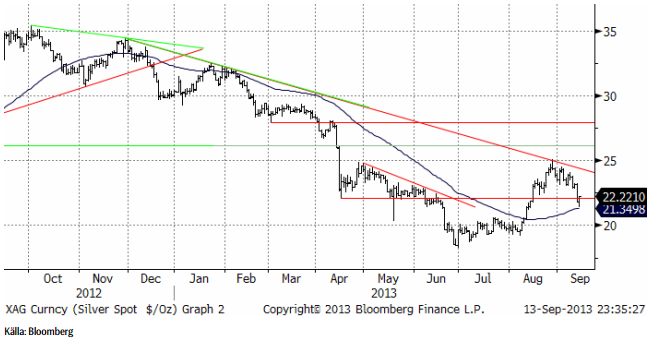
Nedan ser vi kursdiagrammet för silver i dollar per troy ounce. Då och då ser man att handlare hänger upp sig på 55-dagars glidande medelvärde och priset studsade i fredags precis på den nivå som det ligger på, som vi ser i diagrammet nedan. Går priset under den nivån, kan priset gå till 20 dollar, annars kan det gå pp mot 24 dollar. Notera att toppen i slutat av augusti inte lyckades bryta motståndet för den fallande pristrenden. Vi är alltså fortfarande i en bear market för silver.
Nedan ser vi kvoten mellan guldpriset och silverpriset.
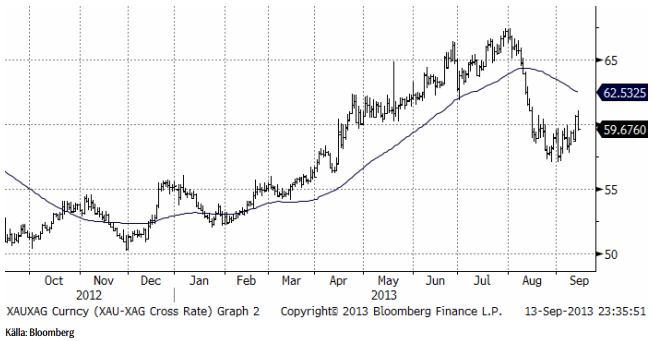
Silverpriset har i den allmänna prisnedgången, i vanlig ordning, fallit mer än guld.
Vi fortsätter att vara neutrala guld och silver och skulle inte vilja köpa någon av dem idag.
Platina & Palladium
Förra veckan skrev vi att platina då brutit stödet för uppgången. Resultatet ser vi nu, där priset fallit ordentligt, ned till nivåer som utgjorde stöd under juli – augusti. Det vore inte otänktbart med en rekyl uppåt i det riktigt korta perspektivet, men vi ser inte detta som en trendvändning, utan som en rekyl i en fallande pristrend.
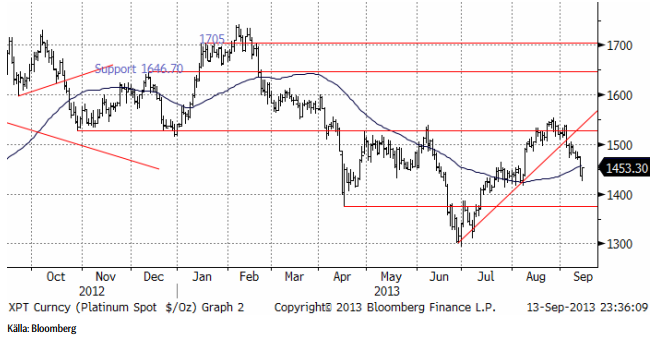
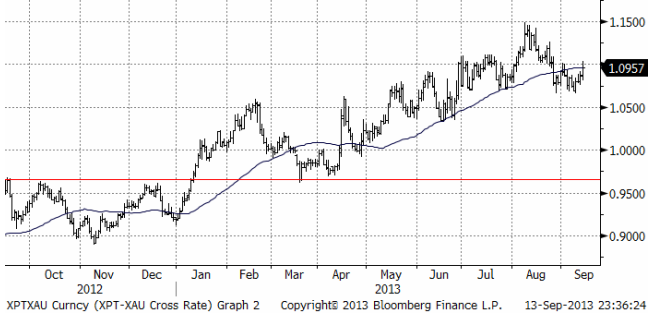
Nedan ser i kvoten mellan platina och guld. I slutet av förra veckan steg platina i förhållande till guld, men vi ser detta som en kortsiktig ”blip” och tror att platina kan falla tillbaka.
Palladiumpriset är håller på att bryta ner från den triangel vi skrivit om tidigare. Kursfallet kan bli stort.
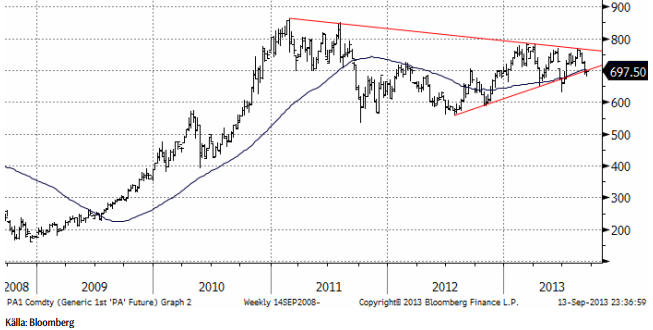
Vi är för närvarande neutrala platina och palladium, men om palladium skulle falla bara något lite ytterligare, skulle vi vilja haka på och ta en kort position via BEAR PALLAD X4 S. Vi skulle absolut inte vilja köpa någon av dem.
Koppar
Priset på koppar var i princip oförändrat i veckan som gick. Trenden är nedåtriktad, men priset är förhållandevis lågt. Vi fortsätter med neutral vy.
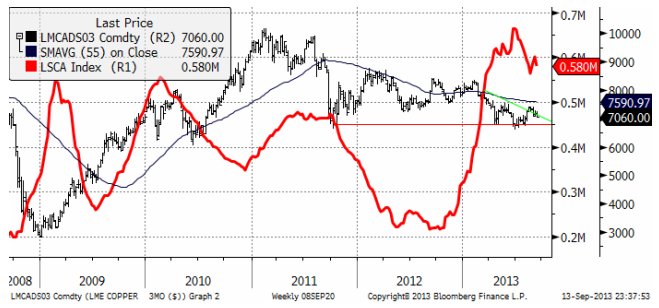
Det är en svårtolkad bild och vi rekommenderar neutral position.
Aluminium
Förra veckan noterade en marginell prisnedgång som stannade på 1812 dollar per ton. Stöd finns vid 1800 dollar. Går priset under den nivån skulle vi vilja vara korta, dvs köpta BEAR ALU X4 S.
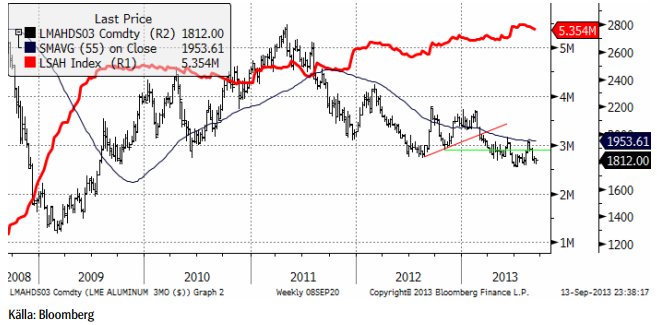
Vi har neutral rekommendation, tidigare köp.
Zink
Priset på zink har i nästan två års tid legat inom ett intervall mellan 1718.50 dollar per ton och 2200 dollar per ton, som vi ser nedan. Den röda linjen visar lagren av zink vid LME. Vi ser att marknaden börjat komma mer i balans. Detta fortsatte i veckan som gick. De rekordstora lagren har börjat minska. Det finns en förväntan om en stor inleverans till tredje onsdagen i september, den 18 september, eftersom detta skett både i maj och i juli. Analytiker har noterat att detta kan hänga ihop med lagerfinansieringsaffärer utanför LME-systemet.
Den senaste ILZG-rapporten indikerar dock att det finns en starkare efterfrågan och att balansen förbättras, vilket gör ett aluminium-scenario mindre sannolikt. Stöd finns vid 1850 dollar per ton, som vi tror att marknaden håller sig över.
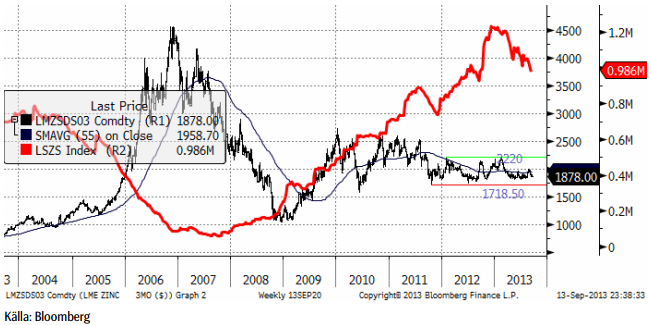
Vi fortsätter med en försiktig köprekommendation, av ZINK S.
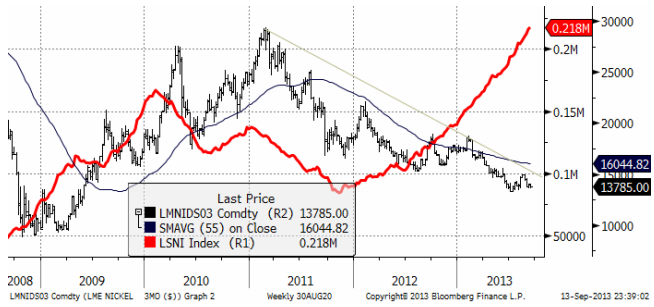
Nickel
Nickelpriset följde den generella tendensen under veckan och stängde på veckans lägsta nivå, där priset balanserar på det tekniska stödet 13675 dollar per ton. Marknaden förväntar sig en återhämtning av fysisk efterfrågan under årets sista kvartal, huvudsakligen drivet av Kina. Produktionen av rostfritt stål steg med 11% i Kina under det första halvåret i år, huvudsakligen från 300-serien, som innehåller 8 – 10% nickel, enligt CRU. Efter en långsammare takt under det tredje kvartalet, tror CRU på en återhämtning under det fjärde. Det skulle innebära en ökning av efterfrågan på 13% i årstakt. Med det stora lager som finns skulle detta verkligen behövas för att få marknaden i balans. En faktor som skulle kunna leda till ökad efterfrågan är den premie för nickel i nickel pig iron vi nämnde i förra veckans brev. Att vi ser att cancellerade warrants (lagerbevis) vid LME nu uppgår till 20% av LME:s lager, kan vara ett tecken på ökad efterfrågan på primärnickel. Nya ”cancellations” rapporteras från Malaysia, där allt nickel i lager har levererats in från Kina. Det är nu möjligt att det här lagret går tillbaka till Kina. Det finns alltså några tecken på förbättringar i marknadsläget, men nickel har förmodligen en lång väg att gå innan vi ser en rejäl återhämtning.
[box]SEB Veckobrev Veckans råvarukommentar är producerat av SEB Merchant Banking och publiceras i samarbete och med tillstånd på Råvarumarknaden.se[/box]
Disclaimer
The information in this document has been compiled by SEB Merchant Banking, a division within Skandinaviska Enskilda Banken AB (publ) (“SEB”).
Opinions contained in this report represent the bank’s present opinion only and are subject to change without notice. All information contained in this report has been compiled in good faith from sources believed to be reliable. However, no representation or warranty, expressed or implied, is made with respect to the completeness or accuracy of its contents and the information is not to be relied upon as authoritative. Anyone considering taking actions based upon the content of this document is urged to base his or her investment decisions upon such investigations as he or she deems necessary. This document is being provided as information only, and no specific actions are being solicited as a result of it; to the extent permitted by law, no liability whatsoever is accepted for any direct or consequential loss arising from use of this document or its contents.
About SEB
SEB is a public company incorporated in Stockholm, Sweden, with limited liability. It is a participant at major Nordic and other European Regulated Markets and Multilateral Trading Facilities (as well as some non-European equivalent markets) for trading in financial instruments, such as markets operated by NASDAQ OMX, NYSE Euronext, London Stock Exchange, Deutsche Börse, Swiss Exchanges, Turquoise and Chi-X. SEB is authorized and regulated by Finansinspektionen in Sweden; it is authorized and subject to limited regulation by the Financial Services Authority for the conduct of designated investment business in the UK, and is subject to the provisions of relevant regulators in all other jurisdictions where SEB conducts operations. SEB Merchant Banking. All rights reserved.

Wild moves yesterday. Brent crude traded to a high of $114.43/b and a low of $96.0/b and closed at $99.94/b yesterday.

US – Iran negotiations ongoing or not? What a day. Donald Trump announced that good talks were ongoing between Iran and the US and that the 48 hour deadline before bombing Iranian power plants and energy infrastructure was postponed by five days subject to success of ongoing meetings. Iranian media meanwhile stated that no meetings were ongoing at all.
Today we are scratching our heads trying to figure out what yesterday was all about.
Friends and family playing the market? Was it just Trump and his friends and family who were playing with oil and equity markets with $580m and $1.46bn in bets being placed by someone in oil and equity markets just 15 minutes before Trump’s announcement?
Was Trump pulling a TACO as he reached his political and economic pain point: Brent at $112/b, US Gas at $4/gal, SPX below 200dma and US 10yr above 4.4%?
Different Iranian factions with Trump talking with one of them? Are there real negotiations going on but with the US talking to one faction in Iran while another, the hardliners, are not involved and are denying any such negotiations going on?
Extending the ultimatum to attack and invade Kharg island next weekend? Or, is the five day delay of the deadline a tactical decision to allow US amphibious assault ships and marines to arrive in the Gulf in the upcoming weekend while US and Israeli continues to degrade Iranian military targets till then. And then next weekend a move by the US/Israel to attack and conquer for example the Kharg island?
We do not really know which it is or maybe a combination of these.
We did get some kind of TACO ydy. But markets have been waiting for some kind of TACO to happen and yesterday we got some kind of TACO. And Brent crude is now trading at $101.5/b as a result rather than at $112-114/b as it did no the high yesterday.
But what really matters in our view is the political situation on the ground in Iran. Will hardliners continue to hold power or will a more pragmatic faction gain power?
If the hardliners remain in power then oil pain should extend all the way to US midterm elections. The hardliners were apparently still in charge as of last week. Iran immediately retaliated and damaged LNG infrastructure in Qatar after Israel hit Iranian South Pars. The SoH was still closed and all messages coming out of Iran indicated defiance. Hardliners continues in power has a huge consequence for oil prices going forward. The regime has played its ’oil-weapon’ (closing or chocking the Strait of Hormuz). It is using it to achieve political goals. Deterrence: it needs to be so politically and economically expensive to attack Iran that it won’t happen again in the future. Or at least that the US/Israel thinks 10-times over before they attack again. The highest Brent crude oil closing price since the start of the war is $112.19/b last Friday. In comparison the 20-year inflation adjusted Brent price is $103/b. So Brent crude last Friday at $112.19/b isn’t a shockingly high price. And it is still far below the nominal high of $148/b from 2008 which is $220/b if inflation adjusted. So once in a lifetime Iran activates its most powerful weapon. The oil weapon. It needs to show the power of this weapon and it needs to reap political gains. Getting Brent to $112/b and intraday high of $119.5/b (9 March) isn’t a display of the power of that weapon. And it is not a deterrence against future attacks.
So if the hardliners remain in power in Iran, then the SoH will likely remain chocked all the way to US midterm elections and Brent crude will at a minimum go above the historical nominal high of $148/b from 2008.
Thus the outlook for the oil price for the rest of the year doesn’t depend all that much of whether Trump pulls a TACO or not. Stops bombing or not. It depends more on who is in charge in Iran. If it is the hardliners, then deterrence against future attacks via chocking of the SoH and high oil prices is the likely line of action. It is impacting the world but the Iranian ’oil-weapon’ is directed towards the US president and the the US midterm elections.
If a pragmatic faction gets to power in Iran, then a very prosperous future is possible. However, if power is shifting towards a more pragmatic faction in Iran then a completely different direction could evolve. Such a faction could possibly be open for cooperation with the US and the GCC and possibly put its issues versus Israel aside. Then the prosperity we have seen evolving in Dubai could be a possible future also for Iran.
So far it looks like the hardliners are fully in charge. As far as we can see, the hardliners are still fully in control in Iran. That points towards continued chocking of the SoH and oil prices ticking higher as global inventories (the oil market buffers) are drawn lower. And not just for a few more weeks, but possibly all the way to the US midterm elections.
A brief sigh of relief yesterday as oil infra at Kharg wasn’t damaged. But higher today. Brent crude dabbled around a bit yesterday in relief that oil infrastructure at Iran’s Kharg island wasn’t damaged. It traded briefly below the 100-line and in a range of $99.54 – 106.5/b. Its close was near the low at $100.21/b.
No easy victorious way out for Trump. So no end in sight yet. Brent is up 3.2% today to $103.4/b with no signs that the war will end anytime soon. Trump has no easy way to declare victory and mission accomplished as long as Iran is in full control of the Strait of Hormuz while also holding some 440 kg of uranium enriched to 60% and not far from weapons grade at 90%. As long as these two factors are unresolved it is difficult for Trump to pull out of the Middle East. Naturally he gets increasingly frustrated over the situation as the oil price and US retail gas prices keeps ticking higher while the US is tied into the mess in the Middle East. Trying to drag NATO members into his mess but not much luck there.
When commodity prices spike they spike 2x, 3x, 4x or 5x. Supply and demand for commodities are notoriously inflexible. When either of them shifts sharply, the the price can easily go to zero (April 2022) or multiply 2x, 3x, or even 5x of normal. Examples in case cobalt in 2025 where Kongo restricted supply and the price doubled. Global LNG in 2022 where the price went 5x normal for the full year average. Demand for tungsten in ammunition is up strongly along with full war in the middle east. And its price? Up 537%.
Why hasn’t the Brent crude oil price gone 2x, 3x, 4x or 5x versus its normal of $68/b given close to full stop in the flow of oil of the Strait of Hormuz? We are after all talking about close to 20% of global supply being disrupted. The reason is the buffers. It is fairly easy to store oil. Commercial operators only hold stocks for logistical variations. It is a lot of oil in commercial stocks, but that is predominantly because the whole oil system is so huge. In addition we have Strategic Petroleum Reserves (SPRs) of close to 2500 mb of crude and 1000 mb of oil products. The IEA last week decided to release 400 mb from global SPR. Equal to 20 days of full closure of the Strait of Hormuz. Thus oil in commercial stocks on land, commercial oil in transit at sea and release of oil from SPRs is currently buffering the situation.
But we are running the buffers down day by day. As a result we see gradually increasing stress here and there in the global oil market. Asia is feeling the pinch the most. It has very low self sufficiency of oil and most of the exports from the Gulf normally head to Asia. Availability of propane and butane many places in India (LPG) has dried up very quickly. Local prices have tripled as a result. Local availability of crude, bunker oil, fuel oil, jet fuel, naphtha and other oil products is quickly running down to critical levels many places in Asia with prices shooting up. Oman crude oil is marked at $153/b. Jet fuel in Singapore is marked at $191/b.
Oil at sea originating from Strait of Hormuz from before 28 Feb is rapidly emptied. Oil at sea is a large pool of commercial oil. An inventory of oil in constant move. If we assume that the average journey from the Persian Gulf to its destinations has a volume weighted average of 13.5 days then the amount of oil at sea originating from the Persian Gulf when the the US/Israel attacked on 28 Feb was 13.5 days * 20 mb/d = 269 mb. Since the strait closed, this oil has increasingly been delivered at its destinations. Those closest to the Strait, like Pakistan, felt the emptying of this supply chain the fastest. Propane prices shooting to 3x normal there already last week and restaurants serving cold food this week is a result of that. Some 50-60% of Asia’s imports of Naphtha normally originates from the Persian Gulf. So naphtha is a natural pain point for Asia. The Gulf also a large and important exporter of Jet fuel. That shut in has lifted jet prices above $200/b.
To simplify our calculations we assume that no oil has left the Strait since that date and that there is no increase in Saudi exports from Yanbu. Then the draining of this inventory at sea originated from the Persian Gulf will essentially look like this:
The supply chain of oil at sea originating from the Strait of Hormuz is soon empty. Except for oil allowed through the Strait of Hormuz by Iran and increased exports from Yanbu in the Red Sea. Not included here.

Oil at sea is falling fast as oil is delivered without any new refill in the Persian Gulf. Waivers for Russian crude is also shifting Russian crude to consumers. Brent crude will likely start to feel the pinch much more forcefully when oil at sea is drawn down another 200 mb to around 1000 mb. That is not much more than 10 days from here.

Oil and oil products are starting to become very pricy many places. Brent crude has still been shielded from spiking like the others.

Closing at highest since Aug 2022. Brent crude gained 9.2% yesterday. The trading range was limited to $95.2 – 101.85/b with a close at $100.46/b and higher than the Monday close of $98.96/b. Ydy close was the highest close since August 2022. This morning Brent is up 2% to $102.4/b and is trading at the highest intraday level since Monday when it high an intraday high of $119.5/b.
A military hit at Iran’s Kharg island would be a big, big bang for the oil price. The big, big risk for the weekend is that oil infrastructure could be damaged. For example Iran’s Kharg island which is Iran’s major oil export hub. If damaged we would have a longer lasting loss of supply stretching way beyond Trump’s announced ”two more weeks”. It will make the spot price spike higher and it will lift the curve. Brent crude 2027 swap would jump above $80/b immediately. An attack on Kharg island would naturally lead Iran to strike back at other oil infrastructures in the Gulf. Especially those belonging to countries who harbor US military bases. I.e. countries who essentially are supporting the attack by US and Israel towards Iran. Though if not in spirit, then in practical operational terms. An attack on Kharg island would not just lead to a lasting outage of supply from Iran until it would be repaired. It would immediately endanger other oil infrastructure in the region as well and additional lasting loss of supply.
No one in their right mind would dare to sit short oil over the coming weekend. Oil is thus set to close the week at a very strong note today.
Prepare for another 400 mb SPR release next week. This week’s announcement of a 400 mb release from Strategic Oil Reserves totally underwhelmed the market with the oil price going higher rather than lower following the announcement. For one it means that the market expects the war and the closure of the Strait of Hormuz to last longer than Trump’s recent announced ”two more weeks”. 400 mb only amounts to 20 days of lost supply to the world through Hormuz and we are already at day 14. So next week when we are getting close to the 20 day mark, we are likely to see another announcement of another 400 mb release of SPR stocks to the market. Preparing for the next 20 days of war.
Global oil logistics in total disarray. We have previously addressed the issue of the huge logistical web of the global oil market which is now in total disarray. The logistical disruption started to fry the oil market at the end of last week. Helped to spike the oil market on Monday. What we hear from our shipping clients is that the problems with supply of fuels locally in Korea, Singapore, India and Africa are getting worse with physical availability of fuels there drying up. It is getting increasingly difficult to find physical supply of bunker oil with local, physical prices shooting way higher than financial benchmarks. To the point that biofuels have become the cheap option many places. Availability of fuels in the US is still good. Not so surprising as the US is self-sufficient with crude and refineries.
The disruption in global oil logistics doesn’t seem to improve. Rather the opposite. If you cannot get fuel to run your ships, then how can you distribute fuels to where it is needed.
Buy Brent Dec-2026 calls with strike $150/b!! As the days goes by the oil price is ticking higher while Trump is getting one day closer to US midterm elections. Trump was betting that he could put this war to bead well before November. But that will probably not be up to him to decide. It will be up to Iran to decide when to reopen the Strait of Hormuz. It is very hard to imagine that Iran will let Trump easily off the hock after he has killed its Supreme Leader. This will likely go all the way to November. Buy Brent Dec-2026 calls with strike $150/b!!
Brent closed at highest since 2022 ydy. Will end this Friday at a very strong note! Consumers still dreaming of $60/b oil


Christian Kopfer om läget för oljan

Marknaden måste börja betrakta de höga kopparpriserna som det nya normala

Det fysiska spotpriset på brentolja har slagit nytt rekord

40 minuter med Javier Blas om hur världen verkligen påverkas av energikrisen

Efter tillväxten: Guldbrev satsar på expansion i Europa
40 minuter med Javier Blas om hur världen verkligen påverkas av energikrisen

Elpriserna fördubblas, stor osäkerhet inför sommaren

MP Materials, USA:s svar på Kinas dominans över sällsynta jordartsmetaller
Det fysiska spotpriset på brentolja har slagit nytt rekord

Studsvik har idag ansökt om att få bygga 1200-1600 MW kärnkraft i Valdemarsvik
-
 Nyheter2 veckor sedan
40 minuter med Javier Blas om hur världen verkligen påverkas av energikrisen
-
 Nyheter3 veckor sedan
Elpriserna fördubblas, stor osäkerhet inför sommaren
-
 Nyheter4 veckor sedan
MP Materials, USA:s svar på Kinas dominans över sällsynta jordartsmetaller
-
 Nyheter2 veckor sedan
Det fysiska spotpriset på brentolja har slagit nytt rekord
-
 Nyheter4 veckor sedan
Studsvik har idag ansökt om att få bygga 1200-1600 MW kärnkraft i Valdemarsvik
-
 Nyheter2 veckor sedan
Marknaden måste börja betrakta de höga kopparpriserna som det nya normala
-

 Nyheter4 veckor sedan
Matproduktion är beroende av gödsel, Gulfkriget skapar brist
-
Analys4 veckor sedan
TACO (or Whatever It Was) Sends Oil Lower — Iran Keeps Choking Hormuz