

Analys
SEB – Råvarukommentarer, 1 september 2014

Rekommendationer
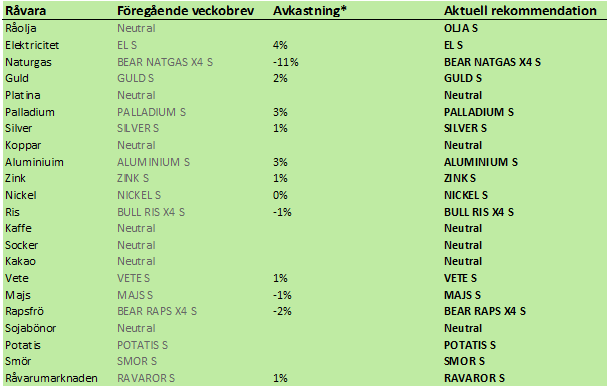
Kort sammanfattning
Pga tilltagande geopolitisk oro tror vi att ädelmetaller och olja är bra att vara köpt på råvarumarknaden. Det finns ingen uppenbar råvara att vara kort den här veckan. SILVER S och OLJA S är alltså de rekommendationer vi vill lyfta fram.
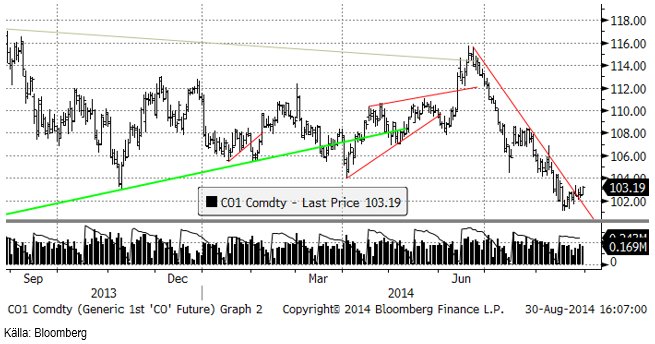
Råolja – Brent
Oljepriset har brutit motståndet för den nedgång som varit sedan juni. Vi tror att det finns potential för uppsida och det motiveras bland annat av att OPEC har producerat maximalt och det finns en viss sårbarhet med ISIS som motor i MENA. Libyen känns också skakigt då t ex den amerikanska ambassaden i Tripoli intogs i helgen. Slutligen har vi Ryssland/Ukraina-krisen och vinter på norra halvklotet på väg.
Råoljelagren i USA sjönk 2 mbbl till 360.5 mbbl. Nu är lagernivån faktiskt 1.5 mbbl lägre än samma vecka förra året.
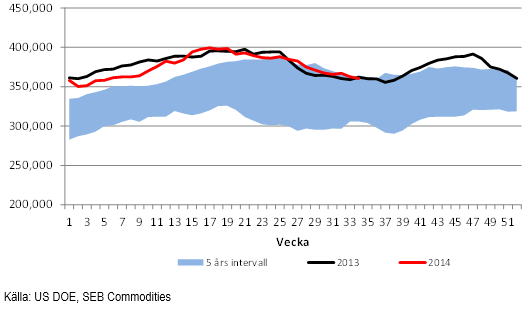
Importen av olja ökade 0.2 mbbl i veckans rapport från DOE, men ligger 0.7 mbbl under förra årets nivå samma vecka. Man brukar se en ökning av importen under juni, juli och augusti och en topp i alldeles i slutet av augusti. Under september, oktober, november och december, faktiskt ända fram till mitten av mars, minskar importen successivt. Det är möjligt att USA:s veckovisa import når ner till 6 mbbl någon gång under den här perioden. Det var väldigt nära den nivån i mitten av maj i år.
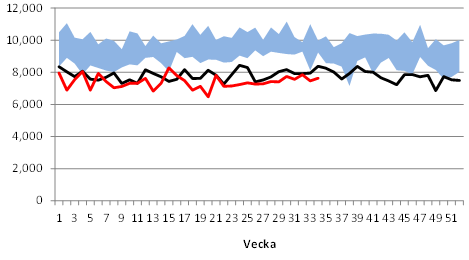
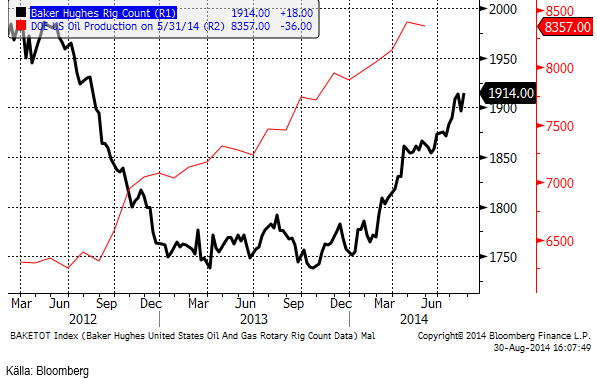
Nedan ser vi ett diagram på antalet oljeriggar i USA, enligt Baker Hughes statistik (svart) och USA:s oljeproduktion enligt US DOE på 8.357 mbpd. Antalet borr-riggar steg återigen över 1900.
Vi rekommenderar alltså på kort sikt köp i olja, t ex via OLJA S.
Elektricitet
China minskar ytterligare på koleldad elkraft. Samtidigt kämpar 50% av kolgruvorna i världen med lönsamhetsproblem. Terminerna för kol i Europa har fallit till 80 dollar per ton för kalenderår 2015. I Euro-termer har kolpriset varit stabilt, men euron har varit svag då den svaga tillväxten i EU tynger. Ukrainakrisen tynger lite extra, men vintern är i antågande och Ukrainakrisen skapar också oro för energitillförseln.
På kort sikt tror vi att elpriset faktiskt testar och troligtvis bryter motståndsnivåerna.
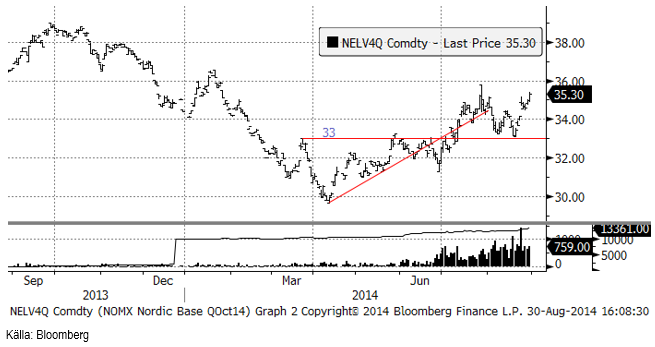
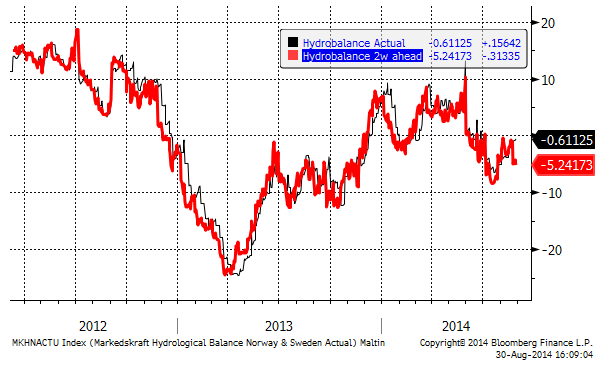
Hydrologisk balans har enligt 2-veckors prognosen försvagats.
Vi rekommenderar köp av EL S om priset kommer ner lite.
Naturgas
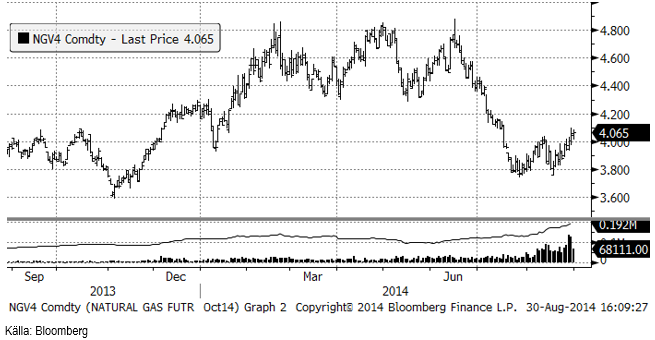
Naturgaspriset har inte alls gått åt vårt håll den senaste veckan, men rekylen uppåt borde stöta på patrull vid 4.20, som är ett tekniskt motstånd. Med viss tvekan håller vi fast vid vår investering i t ex BEAR NATGAS X4 S.
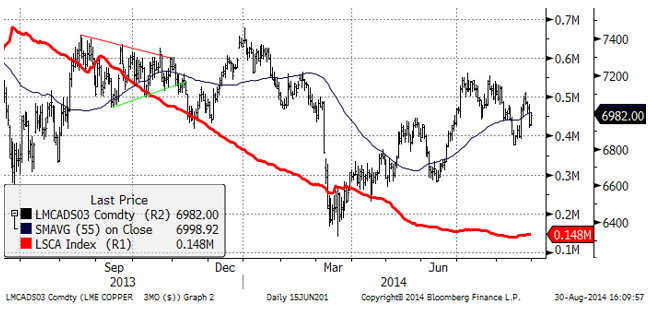
Koppar
Kopparmarknaden ägnade förra veckan åt konsolidering efter den senaste tidens prisuppgång. Kanske funderar marknadens aktörer på vad orsaken var till den plötsliga prisuppgången, om det var något annat än att några hamnade snett i en annars ganska ”tight” marknad. Marknaden har varit i backwardation hela året och det gör det dyrt att ha en kort position. Utbudet kommer dock att öka, bland annat på grund av återupptagningen av export från Grasberg-gruvan. Vi kan dock inte riktigt se att detta kommer att leda till prisfall i kopparmarknaden. Konsumtionen väntas också växa i en hygglig takt och som vi har påpekat förut – risken finns att Kina börjar köpa metall till sina strategiska lager. Det räcker med möjligheten för detta, för att stabilisera marknaden på nedsidan.
Vi rekommenderar neutral position i koppar.
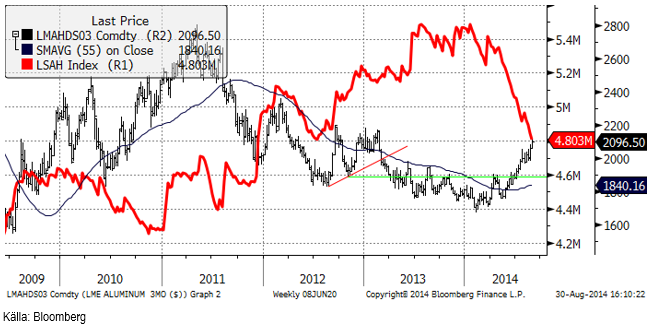
Aluminium
Konsumenterna av aluminium väntar på att priset ska falla tillbaka så att de kan prissäkra sig. Priset har dock gått upp varje dag de senaste två veckorna, bortsett från en dag. Sammantaget är prisuppgången 6% på två veckor, vilket är mycket för aluminium som vanligtvis är den minst volatila av basmetallerna. Premien för fysisk metall (US Midwest) ligger på 450 dollar per ton, vilket är 150 dollar mer än före sommaren, vilket tyder på att det finns ett oväntat sug efter metall. Många konsumenter lever antagligen ”ur hand i mun” och försöker köpa så lite som möjligt. Det betyder att nedgångar kan bli grunda, då dessa passar på att köpa.
Tekniskt ger trendkanalen motstånd vid 2175 dollar just nu, vilket är ytterligare 3% över dagens nivå. .
Vi fortsätter alltså med köprekommendation på ALUMINIUM S.
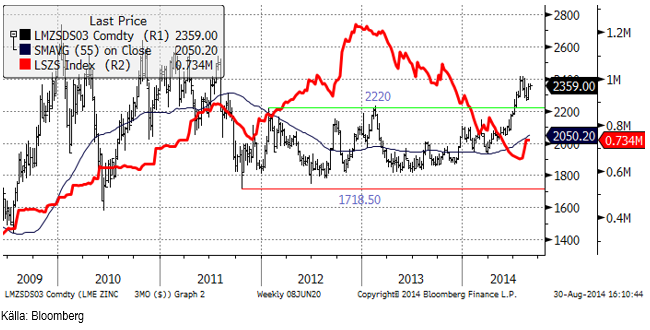
Zink
Zinkpriset närmar sig brytpunkt. Handeln var fast hela förra veckan. Vid sidan av aluminium är zink den mest populära metallen bland investerare för närvarande. Liksom i aluminium börjar en bättre fundamental balans att märkas. Ökad smältverksproduktion i Kina motverkar dock i någon mån den här processen. Trots detta är trenden klar, och det borde finnas utsikter för högre pris på zink. Tekniskt ser diagrammet ut att vilja bryta motstånden och gå högre. Ett brott av 2170 dollar / ton skulle signalera ytterligare ett kliv uppåt i prisnivå.
Vi rekommenderar köp av ZINK S.
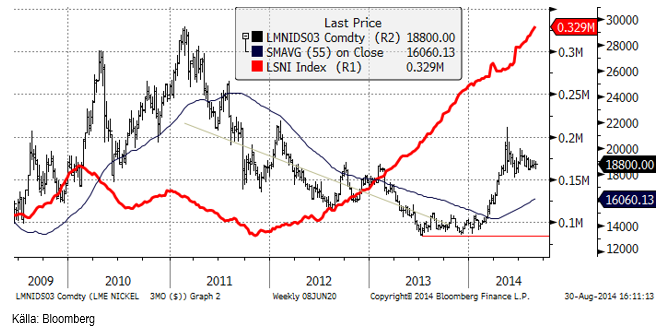
Nickel
Den indonesiska handelskammaren har föreslagit att den nya regeringen ska tillåta export av nickelmalm. Villkoret för att få exportera malm ska enligt förslaget vara att exportören förbinder sig att bygga smältverk i Indonesien och att man betalar in 10% av investeringskostnaden till en investeringsfond. Företag måste också betala en exportskatt på 50-60%.
Den här nyheten är naturligtvis negativ för nickelpriset. Däremot blir det knappast billigt att exportera, men att möjligheten finns gör att sannolikheten för stora prisuppgångar i nickel minskar. Om priset går upp kraftigt pga materialbrist, kommer det att gå att få material från Indonesien. Marknaden tyckte uppenbarligen inte att nyheten skulle förändra utbuds- och efterfrågebalansen i nuvarande läge och priset förändrade sig inte mycket av den här anledningen på fredagen.
Guld
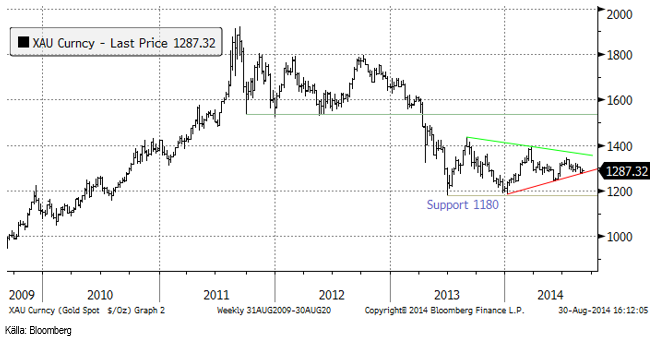
Priset på guld ligger fortfarande och testar den nedre gränsen i den triangelformation som bildats sedan mitten av förra året. Det är ännu oklart om det kommer att bli ett utbrott på nedsidan eller på uppsidan. Just nu är det som sagt väldigt nära till ett brott nedåt. Det innebär att taktiken är att köpa, men vara beredd att snabbt ta förlusten om det blir ett brott på nedsidan.
Tilltagande geopolitisk oro borde gynna guld som investering. Å andra sidan är det märkligt att guldpriset inte redan har stigit mer än det har. Om man bara tittade på prisutvecklingen på guld, skulle man tro att världen var ovanligt fridfull. Om man bor i Indien kan det kanske te sig så. Efterfrågan på guld i Indien hänger samman med monsunens utveckling. Den har varit svag hittills i år, som vi kunnat läsa tidigare. Nu kommer det dock att regna betydligt mycket mer än normalt de kommande två veckorna. Kanske kan detta ha en positiv påverkan på guldpriset.
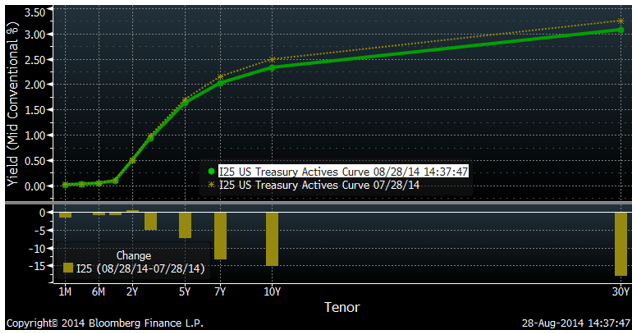
Det talas om att räntorna är på väg uppåt i USA, men detta är inte något man ser i marknaden. Nedan ser vi räntekurvorna för amerikanska statspapper, där det tydligt framgår att räntorna generellt sett är lägre än för en månad sedan med ungefär 15 räntepunkter för 10 och 30 års obligationer.
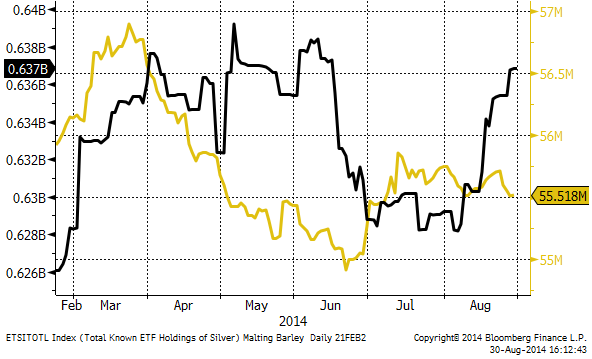
Nedan ser vi att det varit inflöde i guldfonder (gul kurva, antal uns i ETF:er) under den senare delen av augusti. Vi har även märkt av att svenska placerare köpt guld, inte bara GULD S utan även fysiskt guld, vilket vi kan hjälpa till med för våra private bankingkunder.
Nedan ser vi guldpriset i svenska kronor per uns. Guld ser mer ”bullish” ut ur ett svenskt perspektiv, än ur ett dollarperspektiv.
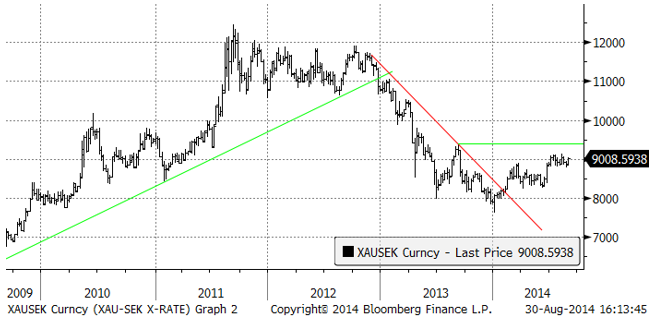
Vi rekommenderar köp av GULD S.
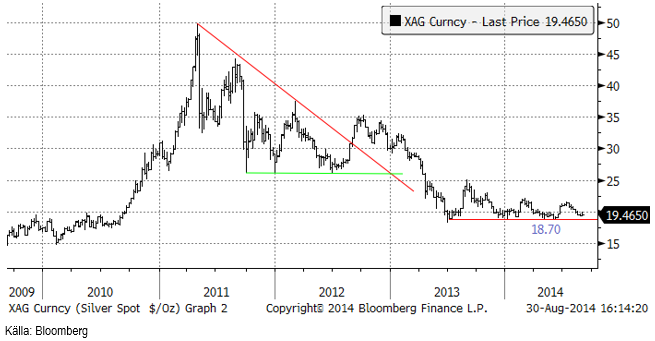
Silver
Silver är vår favorit bland alla råvaror. Dels är har priset varit i konsolidering under mer än ett års tid efter prisfallet från toppnoteringen för tre år sedan, dels gynnas ädelmetaller av den förnyade och tilltagande geopolitiska oron och slutligen är silver billigt i förhållande till guld. Motståndet för nedgången från toppen 2011 är ännu inte bruten, men om eller när det sker, kan prisuppgången bli snabb och stor.
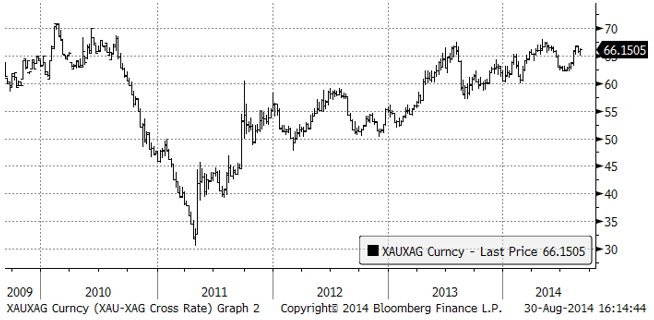
Det som särskilt lockar investerare till silver framför guld just nu är att silver är historiskt billigt jämfört med guld. Nedan ser vi ett diagram över priset på guld uttryckt i silver.
Vi anser att silver är mer köpvärt än guld och skulle vilja köpa på de här nivåerna. Vi rekommenderar köp av SILVER S.
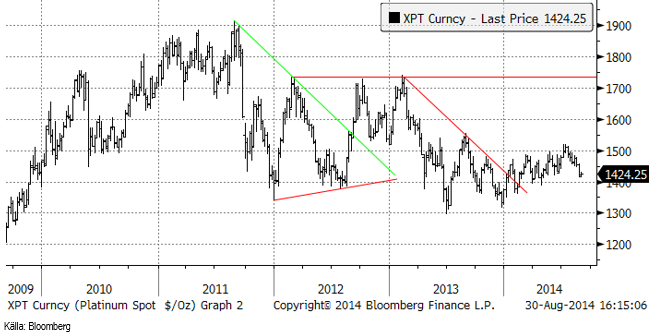
Platina & Palladium
Platinapriset fann stöd och lyckades faktiskt stiga lite förra veckan, men trenden är trots detta nedåtriktad.
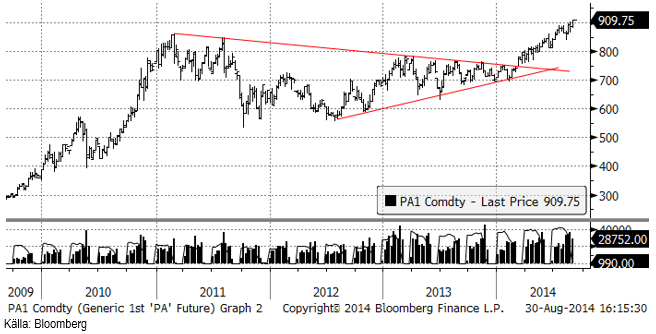
Prisdiagrammet på palladium ser vi nedan. Som vi ser gick priset över 900 dollar per uns och det talar för att prisuppgången kan fortsätta. 900 dollar var ett starkt motstånd.
Nedanför ser vi hur mycket metall som finns i börshandlade fonder för platina respektive palladium. So vi ser har folk tagit hem sina vinster i båda den senaste veckan.
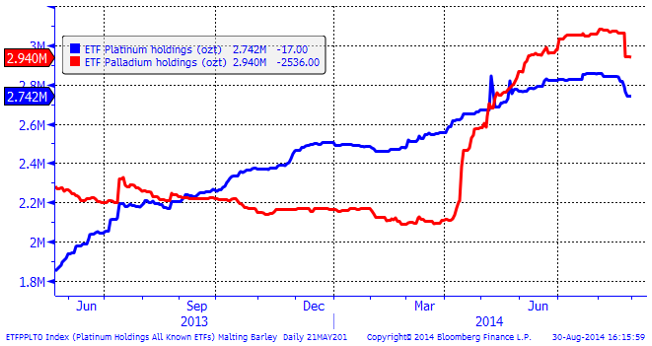
Vi är neutrala på platina men rekommenderar en köpt position i palladium.
Ris
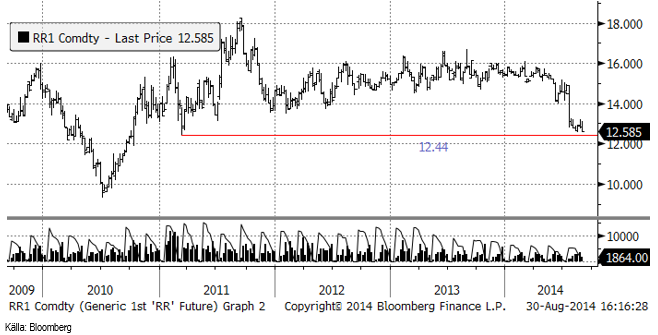
Priset på ris (novemberkontraktet på CME) steg initialt men föll sedan tillbaka. Den statistik som kommit de senaste veckorna pekar på lägre skördar av ris i år. I veckan fick vi en sådan från Kina. Kinas tidiga risskörd minskade med 0.4% jämfört med förra året till 34 mt enligt National Bureau of Statistics i fredags.
Vi tycker inte att detta talar för ett fortsatt prisfall på ris, utan rekommenderar att man snarare investerar i RIS S.
Kaffe
Det är inga större nyheter på kaffefronten. Tekniskt ser vi att priset på decemberkontraktet tagit sig upp till 200 cent. Möjligen kommer priset att gå upp till 220 cent, där ett starkt motstånd finns. Fundamentalt ser vi dock inte något som talar för högre pris på kaffe.
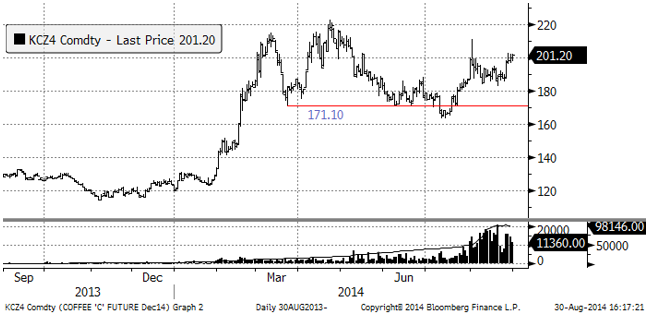
Vi rekommenderar neutral position i kaffe.
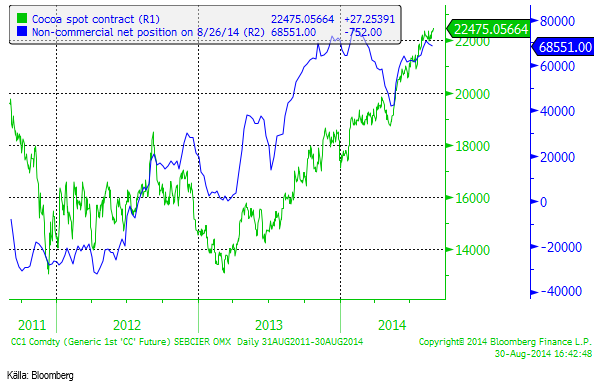
Kakao
The International Cocoa Organization (”ICCO”) meddelade i fredags att 2013/14 kommer att ha ett produktionsöverskott på 40,000 ton och inte ett produktionsunderskott. Det beror på högre produktion än väntat i Elfenbenskusten. ICCO:s tidigare estimat var ett underskott på 75,000 ton. Marknadsföringsåret för kakao löper från den 1 oktober till 30 september.
Elfenbenskusten väntas enligt ICCO få en skörd på 1.73 mt (0.12 mt högre än tidigare väntat). Det innebär ett nytt rekord, i alla fall på papperet. Skörden 2010/11 kan ha varit högre, men det smugglades till grannländerna och skörden nu kan vara mindre, pga smuggling till Elfenbenskusten, enligt ICCO.
Även Ghana och Nigeria väntas få högre skördar, medan Kamerun och Ecuador får något lägre. Sammantaget gör ICCO en uppjustering av global produktion med 0.18 mt till 4.345 mt, vilket är ett nytt rekord. ICCO ser också att de afrikanska producenterna ökar sin produktionskapacitet och väntas fortsätta öka den 2014/15.
Globala lager ökar med 1.6 procentenheter till 38.9% av årlig konsumtion.
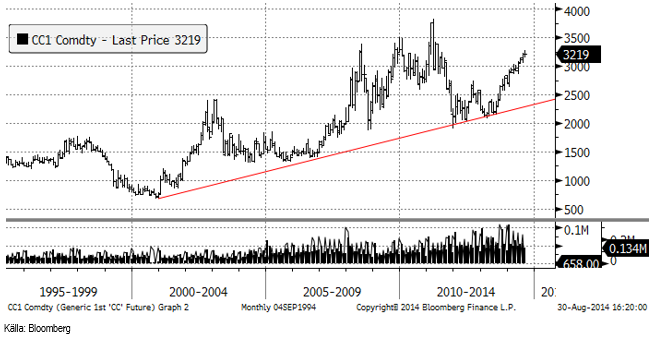
Spekulativ position ligger väldigt högt, historiskt sett.
Vi fortsätter med neutral position, men det börjar bli intressant att försöka sälja kakao om priset blir attraktivt. ”SHORT KAKAO A S” har en hävstång på -0.93 och kan vara ett lämpligt instrument att gå kort med.
För fler analyser på jordbruksråvaror se SEBs andra analysbrev.
[box]SEB Veckobrev Veckans råvarukommentar är producerat av SEB Merchant Banking och publiceras i samarbete och med tillstånd på Råvarumarknaden.se[/box]
Disclaimer
The information in this document has been compiled by SEB Merchant Banking, a division within Skandinaviska Enskilda Banken AB (publ) (“SEB”).
Opinions contained in this report represent the bank’s present opinion only and are subject to change without notice. All information contained in this report has been compiled in good faith from sources believed to be reliable. However, no representation or warranty, expressed or implied, is made with respect to the completeness or accuracy of its contents and the information is not to be relied upon as authoritative. Anyone considering taking actions based upon the content of this document is urged to base his or her investment decisions upon such investigations as he or she deems necessary. This document is being provided as information only, and no specific actions are being solicited as a result of it; to the extent permitted by law, no liability whatsoever is accepted for any direct or consequential loss arising from use of this document or its contents.
About SEB
SEB is a public company incorporated in Stockholm, Sweden, with limited liability. It is a participant at major Nordic and other European Regulated Markets and Multilateral Trading Facilities (as well as some non-European equivalent markets) for trading in financial instruments, such as markets operated by NASDAQ OMX, NYSE Euronext, London Stock Exchange, Deutsche Börse, Swiss Exchanges, Turquoise and Chi-X. SEB is authorized and regulated by Finansinspektionen in Sweden; it is authorized and subject to limited regulation by the Financial Services Authority for the conduct of designated investment business in the UK, and is subject to the provisions of relevant regulators in all other jurisdictions where SEB conducts operations. SEB Merchant Banking. All rights reserved.

Selling down on a ”deal”. Brent crude fell 6.2% last week with accelerated weakness towards the end of the week. Close of the week at $87.33/b and low of the week (and on Friday) of $85.8/b. Brent is falling another 4% this morning to $83.7/b on confirmation by Iran that a MoU text has been reached and that it will be signed on Friday this week.

So what is this ”deal” worth? Talk on the desk here this morning is that it is much like ”putting lipstick on a pig” where Trump has to sell this at home as a victory where ”the SoH has reopened”, the nuclear issue will be ironed out over the coming 60 days (or maybe 600 days?) and US consumers are getting a lower gasoline price and maybe US republicans survives the midterm elections.
The importance for Iran is that it emerges as the defacto winner of this war in the eyes of the non-US public world. That Iran now onwards is the ”ruler of the SoH” (combo of geography and new weapons systems like drones) or more softer: ”the guarantor of safe passage through the SoH”.
Iran doesn’t need nuclear weapons any more. Nuclear deterrence doesn’t work any more. Ukraine has made many attacks deep into Russia without being nuked in return. Plenty of Iranian ballistic rockets blasts over Israel but Iran wasn’t nuked in return.
There is no trust between the US and Iran. We don’t know all the details yet of the MoU. But what we do know is that there is no trust between the US and Iran what so ever. This is probably more like a descriptive text on how they can cooperate in a way where both sides keeps tactical leverage. Neither side makes irreversible concessions. Violations can be punished quickly. Cooperation produces immediate benefits.
This is a fragile structure. It can easily break down. There may be details which cannot be overcome. To be seen on Friday. The US has to show that it is willing put enough force behind managing and restraining Israel versus Hezbollah in Lebanon. We have seen that Netanyahu hasn’t listened all that much to Trump’s directives and wishes. This could be a major obstacle.
A gradual reopening is tactically preferable for Iran. A tactical leverage for Iran right now is that global oil stocks have been drawn down towards painful and increasingly dangerous levels with increasing risks for oil price spikes in mid-July to August. This together with US midterm elections on 3 November gives tactical leverage to Iran. Iran probably doesn’t want to fully give up on that leverage. A rapid, full reopening where global stocks are able to refill over the coming 60 days will significantly erode that leverage. If Iran reinstates a closure of the SoH after 60 days (if talks break down again), then the effect won’t be that impactful in terms of prices and the US midterm elections.
So a gradual and partial reopening where global markets gets the oil they need while they are unable to rebuild stocks could be a practical middle way for both parties. Trump can sell it as ”the SoH has reopened” and get affordable gasoline for US consumers. Iran can sell it as ”the SoH has fully reopened, but there is some friction” so flow is only 60-80% of normal.
Not much real demand destruction below $100/b. What we do know is that there is not much real price pain demand destruction for oil globally at an oil price below $100/b. A lot of demand-shock destruction. Fear. But demand should now come roaring back towards normal with fear for exceptionally high prices now is rapidly receding.
Sudden China demand destruction due to EVs? Bullocks. EV share of total Chinese carpool now around 13%. Share of new sales of EVs has reached 50%. This is a very gradual process. It doesn’t make oil demand fall like a rock over night. When EV new sales share reaches 100%, then the gasoline car pool will contract by some 5-10% per year. But that is only gasoline. Sudden reduction in Chinese oil demand is more about shock and risk.
Chinese crude oil imports will come roaring back. At what price? Today’s ”neutral” oil price is $70/b. That is the five year price which has steadily traded around the $70/b mark over the past 3-4 years. With still a risky picture one would think that China and the rest of the world will be big buyers of oil in the range of $70-85/b.
Global demand will likely snap back towards normal, forecasted demand and growth at such prices.
Physical reopening is a gradual process. The physical and practical reopening of the SoH will likely be gradual rather than sudden. And that probably suites Iran tactically as well.
Brent M1 price versus the Brent 5-yr (today’s ”normal” price)

Market is starting to take US/Iran headlines with a pinch of salt. Brent crude rose $2.8/b yesterday to an official close of $112.1/b. But after that it traded as low as $108.05/b before ending late night at around $109.7/b. Through the day it traded in a range of $106.87 – 112.72/b amid a flurry of news or rumors from Iran and the US. ”US temporary sanctions during negotiations” (falls alarm). ”We will bomb Iran” (not anyhow),… etc. While the market is still fluctuating to this kind of news flow, it is starting to take such headlines with a pinch of salt.
We’ll see. Maybe, maybe not. The Brent M1 contract is trading at $110.2/b this morning which very close to the average ticks through yesterday of $110.4/b.
Trump with bearish, verbal intervention whenever Brent trades above $110/b it seems. What seems to be a pattern is that Trump states something like ”very good negotiations going on with Iran”, ”New leaders in Iran are great,..”, ”Great progress in negotiations,…”, ”Deal in sight,..” etc whenever the Brent M1 contract trades above $110/b. An effort to cool the market. These hot air verbal interventions from Trump used to have a heavy bearish impact on prices, but they now seems to have less and less effect unless they are backed by reality.
As far as we can see there has been no real progress in the negotiations between the US and Iran with both sides still standing by their previous demands.
Iran is getting stronger while the cease fire lasts making a return to war for Trump yet harder. Iran is naturally in constant preparation for a return to war given Trump’s steady threats of bombing Iran again. Iran is naturally doing what ever is possible to prepare for a return to war. And every day the cease fire lasts it is better prepared. This naturally makes it more and more difficult and dangerous for the US to return to warring activity versus Iran as the consequences for energy infrastructure in the Persian Gulf will be more and more severe the longer the cease fire lasts. Israel seems to see it this way as well. That the war is not won and that current frozen state of a cease fire gives Iran opportunity to rebuild military and politically.
Global inventories are drawing down day by day. How much? In the meantime the Strait of Hormuz stays closed. There is varying measures and estimates of how much global inventories are drawing down. Our rough estimate, back of the envelope, is that global inventories are drawing down by at least some 10 mb/d or about 300 mb/d in a balance between loss of supply versus demand destruction. Other estimates we see are a monthly draw of 250-270 mb/d. The IEA only ’measured’ a draw in global observable stocks of 117 mb in April with oil on water rising 53 mb while on shore stocks fell 170 mb. But global stocks are hard to measure with large invisible, unmeasured stocks. As such a back of the envelope approach may be better.
Oil products is what the world is consuming. Oil product prices likely to rise while product stocks fall. Strategic Petroleum Reserves (SPR) are predominantly crude oil. Discharging oil from OECD SPR stocks, a sharp reduction in Chinese crude imports and a reduction in global refinery throughput of 6-7 mb/d has helped to keep crude oil markets satisfactorily supplied. But global inventories are drawing down none the less. And oil products is really what the world is consuming. So if global refinery throughput stays subdued, then demand will eventually have to match the supply of oil products. The likely path forward this summer is a steady draw down in jet fuel, diesel and gasoline. Higher prices for these. Then, if possible, higher refinery throughput and higher usage of crude in response to very profitable refinery margins. And lastly sharper draw in crude stocks and higher prices for these. But some 6 mb/d of oil products used to be exported through the Strait of Hormuz. And it may not be so easy to ramp up refinery activity across the world to compensate. Especially as Ukraine continues to damage Russian refineries as well as Russian crude production and export facilities.
Watch oil product stocks and prices as well as Brent calendar 2027. What to watch for this summer is thus oil product inventories falling and oil product premiums to crude rising. Another measure to watch is the Brent crude 2027 contract as it rises steadily day by day as the Strait of Hormuz stays closed and global oil inventories decline. The latter is close to the highest level since the start of the war and keeps rising.
The Brent M1 contract and the Brent 2027 prices and current price of jet fuel in Europe (ARA). All in USD/b

Our back of the envelope calculation of the global shortage created by the closure of the Strait of Hormuz. Note that 3.5 mb/d of discharge from SPR is also a draw. Note also that ’Forced demand loss’ of 2.5 mb/d is probably temporary and will fall back towards zero as logistics are sorted out leaving ’Price demand loss’ to do the job of balancing the market. Thus a shortfall of at least 9 mb/d created by the closure. More if SPR discharge is included and more if Forced demand loss recedes.

Brent is climbing higher. Front-month is at USD 106.3/bl this morning, close to a weekly high and a USD 9/bl jump from Mondays open. This is the move we flagged as a risk earlier in the week: the market shifting from ”a deal is around the corner” to ”this is going to take longer than we thought”.

Analyst Commodities, SEB
During April, rest-of-year Brent remained remarkably stable around USD 90/bl. A stability which rested on one single assumption: the SoH reopens around 1 May. That assumption is now slowly falling apart.
As we highlighted yesterday: every week of delay beyond 1 May adds (theoretically) ish USD 5/bl to the rest-of-year average, as global inventories draw 100 million barrels per week. i.e., a mid-May reopening implies rest-of-year Brent closer to USD 100/bl, and anything pushing into June or July takes us meaningfully higher.
What’s changed in the last 48 hours:
#1: The US military has formally warned that clearing suspected sea mines from SoH could take up to six months. That is a completely different timescale from what the financial market is pricing. Even a political deal tomorrow does not immediately reopen the strait.
#2: Trump has shifted his tone from urgency to ”strategic patience”. In yesterday’s press conference: ”Don’t rush me… I want a great deal.” The market is reading this as a president no longer feeling pressured by timelines, with the naval blockade running in the background.
#3: So far, the military activity is escalating, not de-escalating. Axios reports Iran is laying more mines in SoH. The US 3rd carrier strike group (USS George H.W. Bush) is arriving with two countermine vessels. Trump yesterday ordered the US Navy to destroy any Iranian boats caught laying mines. While CNN reports that the Pentagon is actively drawing up plans to strike Iranian SoH capabilities and individual Iranian military leaders if the ceasefire collapses. i.e., NOT a attitude consistent with an imminent deal!
Spot crude and product prices eased off the early-April highs on a combination of system rerouting and deal optimism. Both now weakening. Goldman estimates April Gulf output is reduced by 14.5 mbl/d, or 57% of pre-war supply, a number that keeps getting worse the longer this drags on.
Demand-side adaptation is ongoing: S. Korea has cut its Middle East crude dependence from 69% to 56% by pulling more from the Americas and Africa, and Japan is kicking off a second round of SPR releases from 1 May. But SPRs are finite.
Ref. to the negotiations, we should not bet on speed. The current Iranian leadership is dominated by genuine hardliners willing to absorb economic pain and run the clock to extract concessions. That is not a setup for a rapid resolution. US/Israeli media briefings keep framing the delay as ”internal Iranian divisions”, the reality is more complicated and points toward weeks and months, not days.
Our point is that the complexity is large, and higher prices have only just started (given a scenario where the negotiations drag out in time). The market spent April leaning on the USD 90/bl rest-of-year assumption; that case is diminishing by the hour. If ”early May reopening” is replaced by ”June, July or later” over the next week or two, both crude and products have meaningful room to reprice higher from here. There is a high risk being short energy and betting on any immediate political resolution(!).


Vattenfalls och Industrikrafts kärnkraftsbolag Videberg Kraft har valt Rolls-Royce SMR
Selling down on a ”deal”

Sommarväder skapar prisrally på elbörsen
Oil product price pain is set to rise as the Strait of Hormuz stays closed into summer

Solkraften pressar elpriserna dagtid
Oil product price pain is set to rise as the Strait of Hormuz stays closed into summer
Sommarväder skapar prisrally på elbörsen
Vattenfalls och Industrikrafts kärnkraftsbolag Videberg Kraft har valt Rolls-Royce SMR
Selling down on a ”deal”
-
Analys4 veckor sedan
Oil product price pain is set to rise as the Strait of Hormuz stays closed into summer
-
Nyheter2 veckor sedan
Sommarväder skapar prisrally på elbörsen
-
 Nyheter2 dagar sedan
Vattenfalls och Industrikrafts kärnkraftsbolag Videberg Kraft har valt Rolls-Royce SMR
-
Analys3 dagar sedan
Selling down on a ”deal”