

Analys
SEB – Råvarukommentarer, 1 september 2014

Rekommendationer
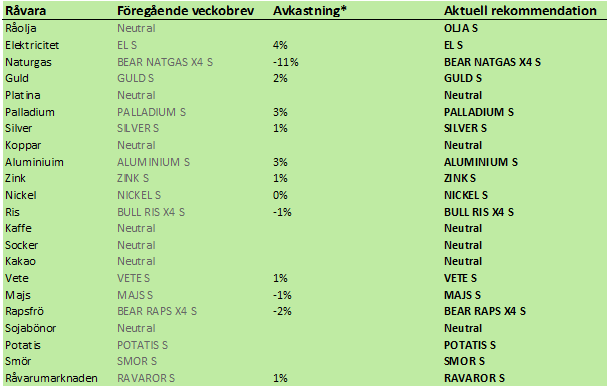
Kort sammanfattning
Pga tilltagande geopolitisk oro tror vi att ädelmetaller och olja är bra att vara köpt på råvarumarknaden. Det finns ingen uppenbar råvara att vara kort den här veckan. SILVER S och OLJA S är alltså de rekommendationer vi vill lyfta fram.
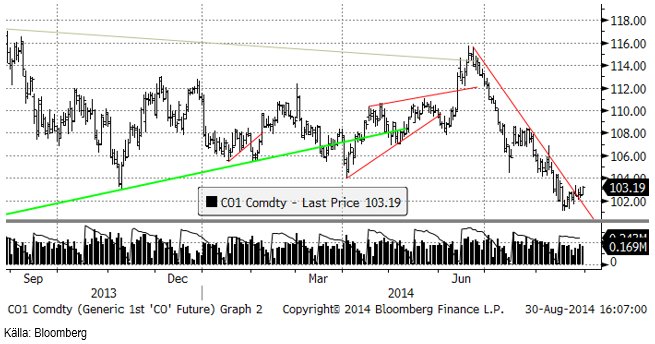
Råolja – Brent
Oljepriset har brutit motståndet för den nedgång som varit sedan juni. Vi tror att det finns potential för uppsida och det motiveras bland annat av att OPEC har producerat maximalt och det finns en viss sårbarhet med ISIS som motor i MENA. Libyen känns också skakigt då t ex den amerikanska ambassaden i Tripoli intogs i helgen. Slutligen har vi Ryssland/Ukraina-krisen och vinter på norra halvklotet på väg.
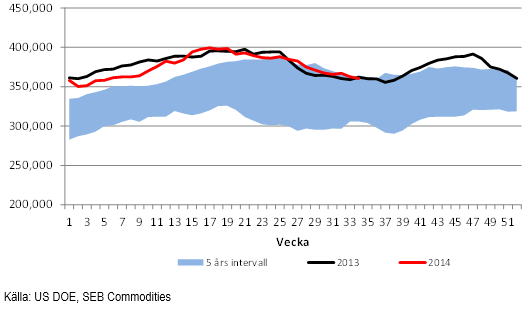
Råoljelagren i USA sjönk 2 mbbl till 360.5 mbbl. Nu är lagernivån faktiskt 1.5 mbbl lägre än samma vecka förra året.
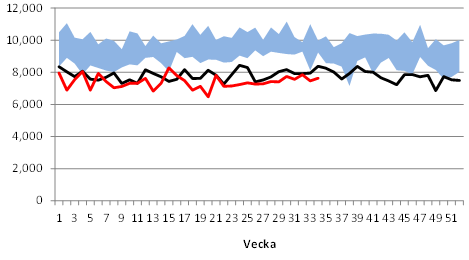
Importen av olja ökade 0.2 mbbl i veckans rapport från DOE, men ligger 0.7 mbbl under förra årets nivå samma vecka. Man brukar se en ökning av importen under juni, juli och augusti och en topp i alldeles i slutet av augusti. Under september, oktober, november och december, faktiskt ända fram till mitten av mars, minskar importen successivt. Det är möjligt att USA:s veckovisa import når ner till 6 mbbl någon gång under den här perioden. Det var väldigt nära den nivån i mitten av maj i år.
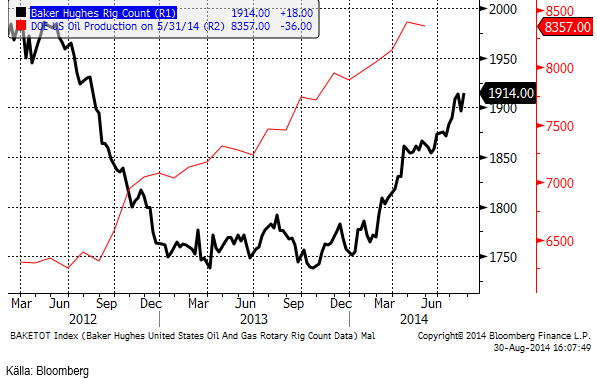
Nedan ser vi ett diagram på antalet oljeriggar i USA, enligt Baker Hughes statistik (svart) och USA:s oljeproduktion enligt US DOE på 8.357 mbpd. Antalet borr-riggar steg återigen över 1900.
Vi rekommenderar alltså på kort sikt köp i olja, t ex via OLJA S.
Elektricitet
China minskar ytterligare på koleldad elkraft. Samtidigt kämpar 50% av kolgruvorna i världen med lönsamhetsproblem. Terminerna för kol i Europa har fallit till 80 dollar per ton för kalenderår 2015. I Euro-termer har kolpriset varit stabilt, men euron har varit svag då den svaga tillväxten i EU tynger. Ukrainakrisen tynger lite extra, men vintern är i antågande och Ukrainakrisen skapar också oro för energitillförseln.
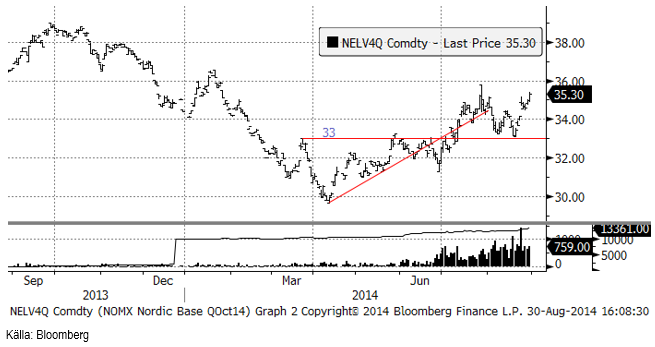
På kort sikt tror vi att elpriset faktiskt testar och troligtvis bryter motståndsnivåerna.
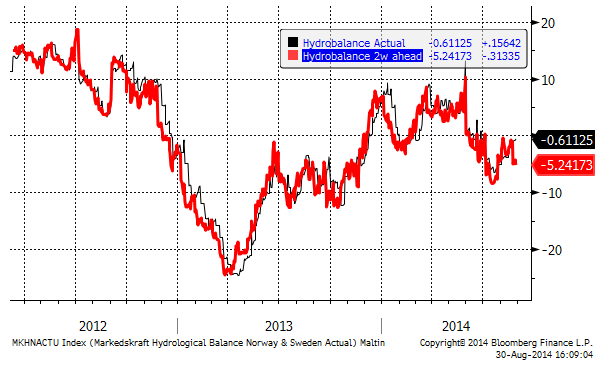
Hydrologisk balans har enligt 2-veckors prognosen försvagats.
Vi rekommenderar köp av EL S om priset kommer ner lite.
Naturgas
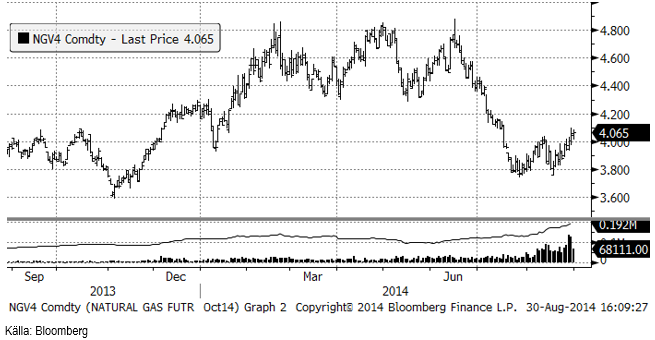
Naturgaspriset har inte alls gått åt vårt håll den senaste veckan, men rekylen uppåt borde stöta på patrull vid 4.20, som är ett tekniskt motstånd. Med viss tvekan håller vi fast vid vår investering i t ex BEAR NATGAS X4 S.
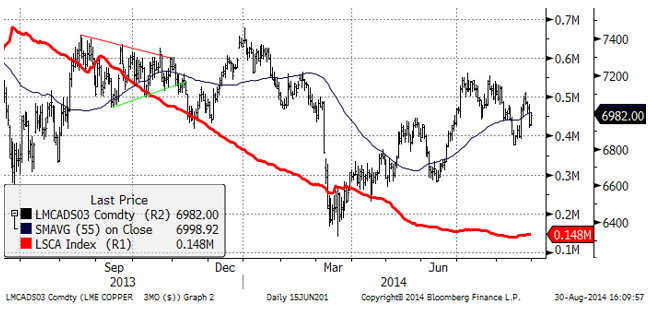
Koppar
Kopparmarknaden ägnade förra veckan åt konsolidering efter den senaste tidens prisuppgång. Kanske funderar marknadens aktörer på vad orsaken var till den plötsliga prisuppgången, om det var något annat än att några hamnade snett i en annars ganska ”tight” marknad. Marknaden har varit i backwardation hela året och det gör det dyrt att ha en kort position. Utbudet kommer dock att öka, bland annat på grund av återupptagningen av export från Grasberg-gruvan. Vi kan dock inte riktigt se att detta kommer att leda till prisfall i kopparmarknaden. Konsumtionen väntas också växa i en hygglig takt och som vi har påpekat förut – risken finns att Kina börjar köpa metall till sina strategiska lager. Det räcker med möjligheten för detta, för att stabilisera marknaden på nedsidan.
Vi rekommenderar neutral position i koppar.
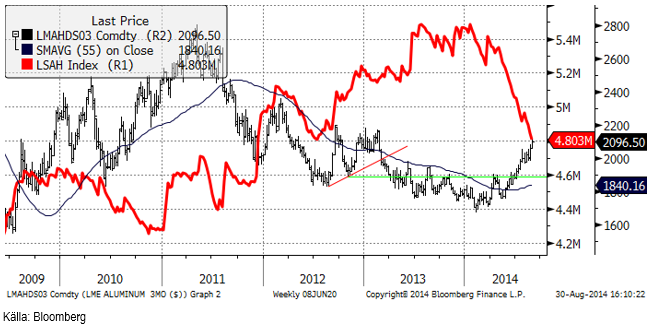
Aluminium
Konsumenterna av aluminium väntar på att priset ska falla tillbaka så att de kan prissäkra sig. Priset har dock gått upp varje dag de senaste två veckorna, bortsett från en dag. Sammantaget är prisuppgången 6% på två veckor, vilket är mycket för aluminium som vanligtvis är den minst volatila av basmetallerna. Premien för fysisk metall (US Midwest) ligger på 450 dollar per ton, vilket är 150 dollar mer än före sommaren, vilket tyder på att det finns ett oväntat sug efter metall. Många konsumenter lever antagligen ”ur hand i mun” och försöker köpa så lite som möjligt. Det betyder att nedgångar kan bli grunda, då dessa passar på att köpa.
Tekniskt ger trendkanalen motstånd vid 2175 dollar just nu, vilket är ytterligare 3% över dagens nivå. .
Vi fortsätter alltså med köprekommendation på ALUMINIUM S.
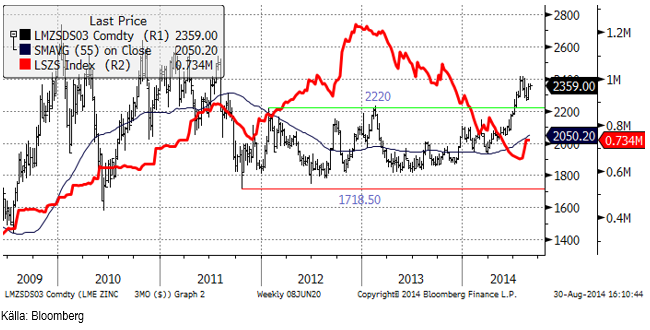
Zink
Zinkpriset närmar sig brytpunkt. Handeln var fast hela förra veckan. Vid sidan av aluminium är zink den mest populära metallen bland investerare för närvarande. Liksom i aluminium börjar en bättre fundamental balans att märkas. Ökad smältverksproduktion i Kina motverkar dock i någon mån den här processen. Trots detta är trenden klar, och det borde finnas utsikter för högre pris på zink. Tekniskt ser diagrammet ut att vilja bryta motstånden och gå högre. Ett brott av 2170 dollar / ton skulle signalera ytterligare ett kliv uppåt i prisnivå.
Vi rekommenderar köp av ZINK S.
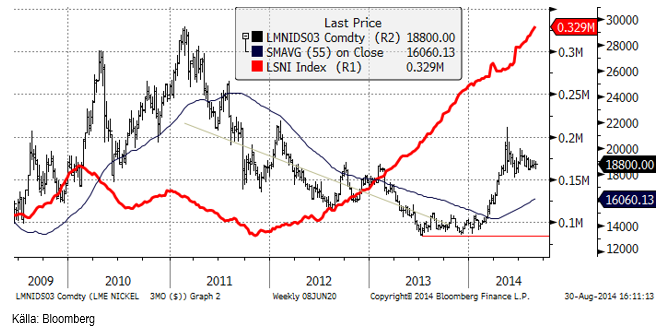
Nickel
Den indonesiska handelskammaren har föreslagit att den nya regeringen ska tillåta export av nickelmalm. Villkoret för att få exportera malm ska enligt förslaget vara att exportören förbinder sig att bygga smältverk i Indonesien och att man betalar in 10% av investeringskostnaden till en investeringsfond. Företag måste också betala en exportskatt på 50-60%.
Den här nyheten är naturligtvis negativ för nickelpriset. Däremot blir det knappast billigt att exportera, men att möjligheten finns gör att sannolikheten för stora prisuppgångar i nickel minskar. Om priset går upp kraftigt pga materialbrist, kommer det att gå att få material från Indonesien. Marknaden tyckte uppenbarligen inte att nyheten skulle förändra utbuds- och efterfrågebalansen i nuvarande läge och priset förändrade sig inte mycket av den här anledningen på fredagen.
Guld
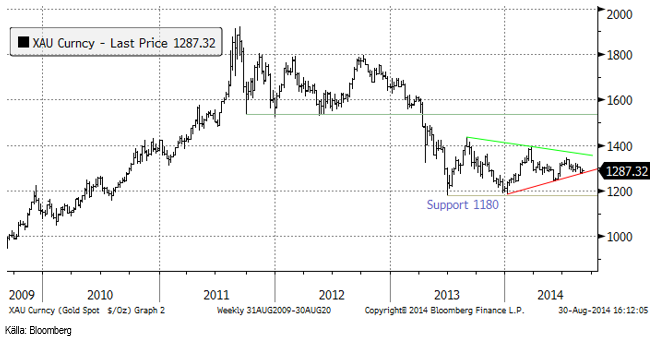
Priset på guld ligger fortfarande och testar den nedre gränsen i den triangelformation som bildats sedan mitten av förra året. Det är ännu oklart om det kommer att bli ett utbrott på nedsidan eller på uppsidan. Just nu är det som sagt väldigt nära till ett brott nedåt. Det innebär att taktiken är att köpa, men vara beredd att snabbt ta förlusten om det blir ett brott på nedsidan.
Tilltagande geopolitisk oro borde gynna guld som investering. Å andra sidan är det märkligt att guldpriset inte redan har stigit mer än det har. Om man bara tittade på prisutvecklingen på guld, skulle man tro att världen var ovanligt fridfull. Om man bor i Indien kan det kanske te sig så. Efterfrågan på guld i Indien hänger samman med monsunens utveckling. Den har varit svag hittills i år, som vi kunnat läsa tidigare. Nu kommer det dock att regna betydligt mycket mer än normalt de kommande två veckorna. Kanske kan detta ha en positiv påverkan på guldpriset.
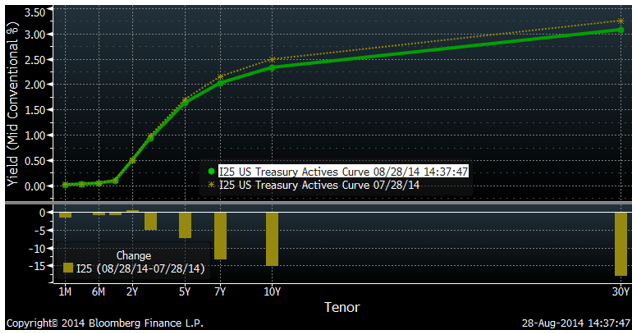
Det talas om att räntorna är på väg uppåt i USA, men detta är inte något man ser i marknaden. Nedan ser vi räntekurvorna för amerikanska statspapper, där det tydligt framgår att räntorna generellt sett är lägre än för en månad sedan med ungefär 15 räntepunkter för 10 och 30 års obligationer.
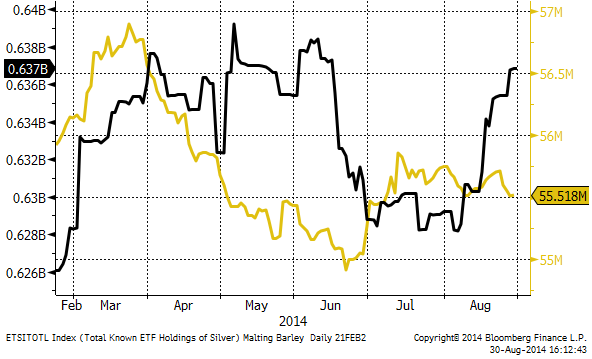
Nedan ser vi att det varit inflöde i guldfonder (gul kurva, antal uns i ETF:er) under den senare delen av augusti. Vi har även märkt av att svenska placerare köpt guld, inte bara GULD S utan även fysiskt guld, vilket vi kan hjälpa till med för våra private bankingkunder.
Nedan ser vi guldpriset i svenska kronor per uns. Guld ser mer ”bullish” ut ur ett svenskt perspektiv, än ur ett dollarperspektiv.
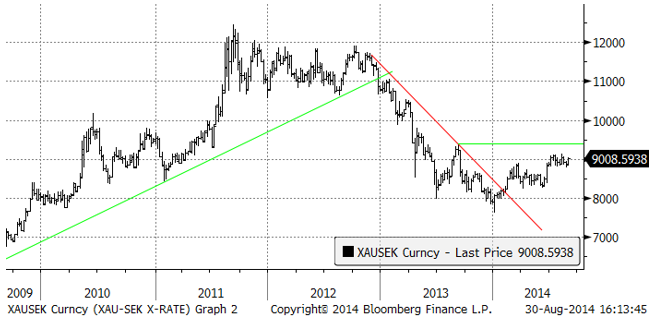
Vi rekommenderar köp av GULD S.
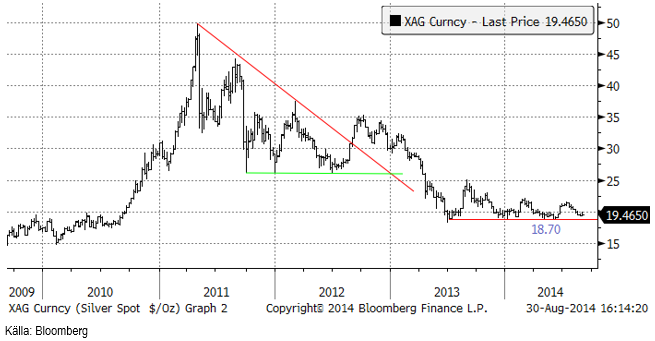
Silver
Silver är vår favorit bland alla råvaror. Dels är har priset varit i konsolidering under mer än ett års tid efter prisfallet från toppnoteringen för tre år sedan, dels gynnas ädelmetaller av den förnyade och tilltagande geopolitiska oron och slutligen är silver billigt i förhållande till guld. Motståndet för nedgången från toppen 2011 är ännu inte bruten, men om eller när det sker, kan prisuppgången bli snabb och stor.
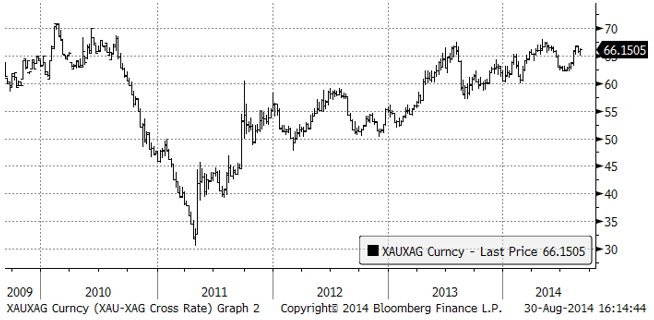
Det som särskilt lockar investerare till silver framför guld just nu är att silver är historiskt billigt jämfört med guld. Nedan ser vi ett diagram över priset på guld uttryckt i silver.
Vi anser att silver är mer köpvärt än guld och skulle vilja köpa på de här nivåerna. Vi rekommenderar köp av SILVER S.
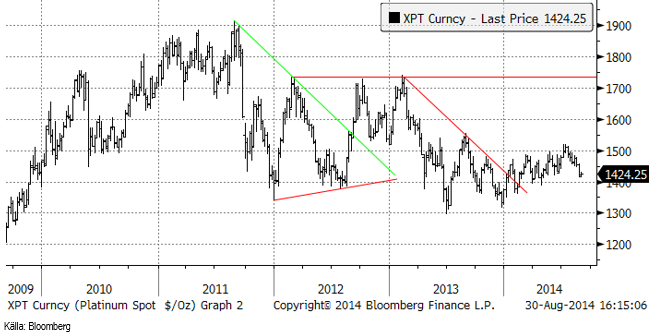
Platina & Palladium
Platinapriset fann stöd och lyckades faktiskt stiga lite förra veckan, men trenden är trots detta nedåtriktad.
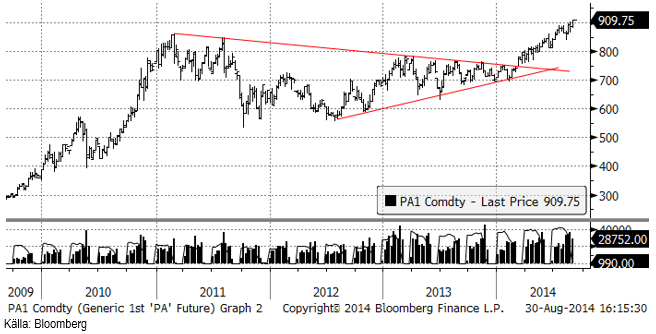
Prisdiagrammet på palladium ser vi nedan. Som vi ser gick priset över 900 dollar per uns och det talar för att prisuppgången kan fortsätta. 900 dollar var ett starkt motstånd.
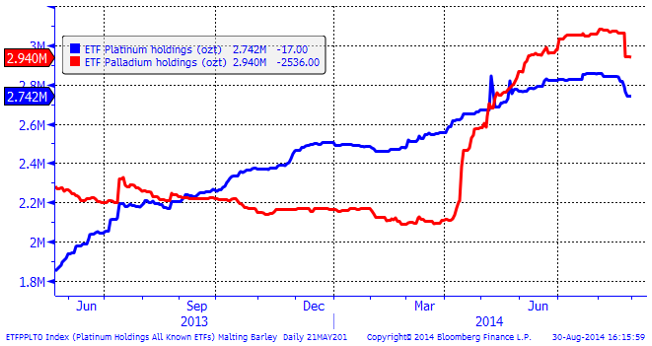
Nedanför ser vi hur mycket metall som finns i börshandlade fonder för platina respektive palladium. So vi ser har folk tagit hem sina vinster i båda den senaste veckan.
Vi är neutrala på platina men rekommenderar en köpt position i palladium.
Ris
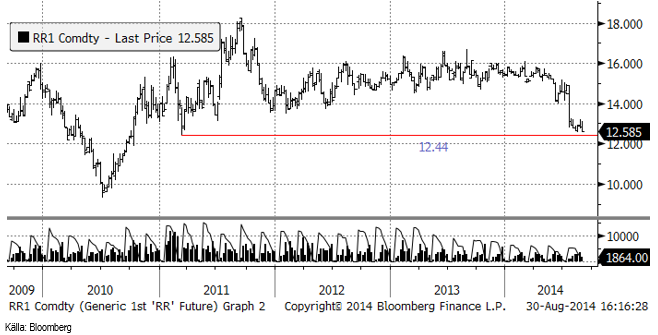
Priset på ris (novemberkontraktet på CME) steg initialt men föll sedan tillbaka. Den statistik som kommit de senaste veckorna pekar på lägre skördar av ris i år. I veckan fick vi en sådan från Kina. Kinas tidiga risskörd minskade med 0.4% jämfört med förra året till 34 mt enligt National Bureau of Statistics i fredags.
Vi tycker inte att detta talar för ett fortsatt prisfall på ris, utan rekommenderar att man snarare investerar i RIS S.
Kaffe
Det är inga större nyheter på kaffefronten. Tekniskt ser vi att priset på decemberkontraktet tagit sig upp till 200 cent. Möjligen kommer priset att gå upp till 220 cent, där ett starkt motstånd finns. Fundamentalt ser vi dock inte något som talar för högre pris på kaffe.
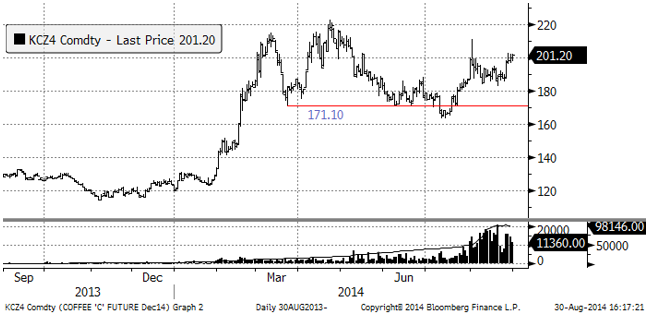
Vi rekommenderar neutral position i kaffe.
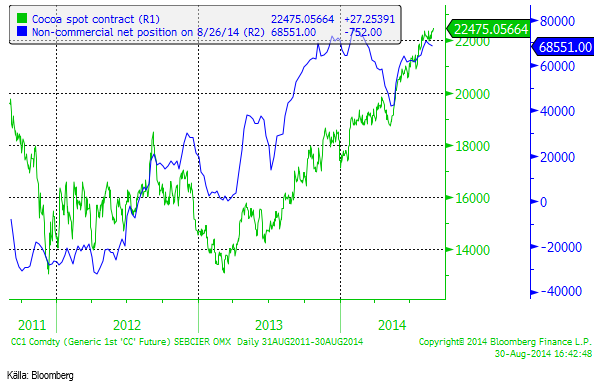
Kakao
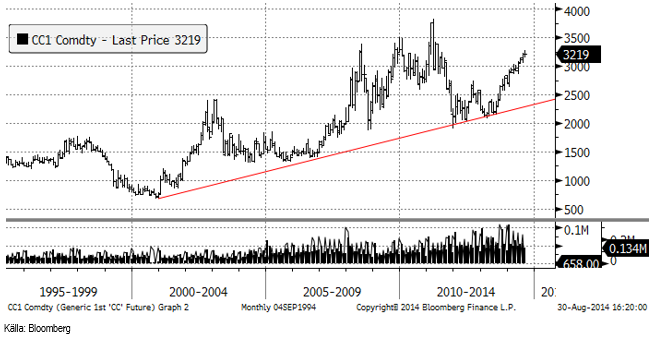
The International Cocoa Organization (”ICCO”) meddelade i fredags att 2013/14 kommer att ha ett produktionsöverskott på 40,000 ton och inte ett produktionsunderskott. Det beror på högre produktion än väntat i Elfenbenskusten. ICCO:s tidigare estimat var ett underskott på 75,000 ton. Marknadsföringsåret för kakao löper från den 1 oktober till 30 september.
Elfenbenskusten väntas enligt ICCO få en skörd på 1.73 mt (0.12 mt högre än tidigare väntat). Det innebär ett nytt rekord, i alla fall på papperet. Skörden 2010/11 kan ha varit högre, men det smugglades till grannländerna och skörden nu kan vara mindre, pga smuggling till Elfenbenskusten, enligt ICCO.
Även Ghana och Nigeria väntas få högre skördar, medan Kamerun och Ecuador får något lägre. Sammantaget gör ICCO en uppjustering av global produktion med 0.18 mt till 4.345 mt, vilket är ett nytt rekord. ICCO ser också att de afrikanska producenterna ökar sin produktionskapacitet och väntas fortsätta öka den 2014/15.
Globala lager ökar med 1.6 procentenheter till 38.9% av årlig konsumtion.
Spekulativ position ligger väldigt högt, historiskt sett.
Vi fortsätter med neutral position, men det börjar bli intressant att försöka sälja kakao om priset blir attraktivt. ”SHORT KAKAO A S” har en hävstång på -0.93 och kan vara ett lämpligt instrument att gå kort med.
För fler analyser på jordbruksråvaror se SEBs andra analysbrev.
[box]SEB Veckobrev Veckans råvarukommentar är producerat av SEB Merchant Banking och publiceras i samarbete och med tillstånd på Råvarumarknaden.se[/box]
Disclaimer
The information in this document has been compiled by SEB Merchant Banking, a division within Skandinaviska Enskilda Banken AB (publ) (“SEB”).
Opinions contained in this report represent the bank’s present opinion only and are subject to change without notice. All information contained in this report has been compiled in good faith from sources believed to be reliable. However, no representation or warranty, expressed or implied, is made with respect to the completeness or accuracy of its contents and the information is not to be relied upon as authoritative. Anyone considering taking actions based upon the content of this document is urged to base his or her investment decisions upon such investigations as he or she deems necessary. This document is being provided as information only, and no specific actions are being solicited as a result of it; to the extent permitted by law, no liability whatsoever is accepted for any direct or consequential loss arising from use of this document or its contents.
About SEB
SEB is a public company incorporated in Stockholm, Sweden, with limited liability. It is a participant at major Nordic and other European Regulated Markets and Multilateral Trading Facilities (as well as some non-European equivalent markets) for trading in financial instruments, such as markets operated by NASDAQ OMX, NYSE Euronext, London Stock Exchange, Deutsche Börse, Swiss Exchanges, Turquoise and Chi-X. SEB is authorized and regulated by Finansinspektionen in Sweden; it is authorized and subject to limited regulation by the Financial Services Authority for the conduct of designated investment business in the UK, and is subject to the provisions of relevant regulators in all other jurisdictions where SEB conducts operations. SEB Merchant Banking. All rights reserved.

Parts of the Brent crude curve dipping into the high $50ies/b. Brent crude fell 2.3% over the week to Friday. It closed the week at $61.29/b, a slight gain on the day, but also traded to a low of $60.14/b that same day and just barely avoided trading into the $50ies/b. This morning it is risk-on in equities which seems to help industrial metals a little higher. But no such luck for oil. It is down 0.8% at $60.8/b. This week looks set for Brent crude to dip its feet in the $50ies/b. The Brent 3mth contract actually traded into the high $50ies/b on Friday.

The front-end backwardation has been on a weakening foot and is now about to fully disappear. The lowest point of the crude oil curve has also moved steadily lower and lower and its discount to the 5yr contract is now $6.8/b. A solid contango. The Brent 3mth contract did actually dip into the $50ies/b intraday on Friday when it traded to a low point of $59.93/b.
More weakness to come as lots of oil at sea comes to ports. Mid-East OPEC countries have boosted exports along with lower post summer consumption and higher production. The result is highly visibly in oil at sea which increased by 17 mb to 1,311 mb over the week to Sunday. Up 185 mb since mid-August. On its way to discharge at a port somewhere over the coming month or two.
Don’t forget that the oil market path ahead is all down to OPEC+. Remember that what is playing out in the oil market now is all by design by OPEC+. The group has decided that the unwind of the voluntary cuts is what it wants to do. In a combination of meeting demand from consumers as well as taking back market share. But we need to remember that how this plays out going forward is all at the mercy of what OPEC+ decides to do. It will halt the unwinding at some point. It will revert to cuts instead of unwind at some point.
A few months with Brent at $55/b and 40-50 US shale oil rigs kicked out may be what is needed. We think OPEC+ needs to see the exit of another 40-50 drilling rigs in the US shale oil patches to set US shale oil production on a path to of a 1 mb/d year on year decline Dec-25 to Dec-26. We are not there yet. But a 2-3 months period with Brent crude averaging $55/b would probably do it.
Oil on water increased 17 mb over the week to Sunday while oil in transit increased by 23 mb. So less oil was standing still. More was moving.

Crude oil floating storage (stationary more than 7 days). Down 11 mb over week to Sunday

The lowest point of the Brent crude oil curve versus the 5yr contract. Weakest so far this year.

Crude oil 1mth to 3mth time-spreads. Dubai held out strongly through summer, but then that center of strength fell apart in late September and has been leading weakness in crude curves lower since then.

Rebounding along with most markets. But concerns over solidity of Gaza peace may also contribute. Brent crude fell 0.8% yesterday to $61.91/b and its lowest close since May this year. This morning it is bouncing up 0.9% to $62.5/b along with a softer USD amid positive sentiment with both equities and industrial metals moving higher. Concerns that the peace in Gaza may be less solid than what one might hope for also yields some support to Brent. Bets on tech stocks are rebounding, defying fears of trade war. Money moving back into markets. Gold continues upwards its strong trend and a softer dollar helps it higher today as well.
US crude & products probably rose 5.6 mb last week (API) versus a normal seasonal decline of 2.4 mb. The US API last night partial and thus indicative data for US oil inventories. Their data indicates that US crude stocks rose 7.4 mb last week, gasoline stocks rose 3.0 mb while Distillate stocks fell 4.8 mb. Altogether an increase in commercial crude and product stocks of 5.6 mb. Commercial US crude and product stocks normally decline by 2.4 mb this time of year. So seasonally adjusted the US inventories rose 8 mb last week according to the indicative numbers by the API. That is a lot. Also, the counter seasonal trend of rising stocks versus normally declining stocks this time of year looks on a solid pace of continuation. If the API is correct then total US crude and product stocks would stand 41 mb higher than one year ago and 6 mb higher than the 2015-19 average. And if we combine this with our knowledge of a sharp increase in production and exports by OPEC(+) and a large increase in oil at sea, then the current trend in US oil inventories looks set to continue. So higher stocks and lower crude oil prices until OPEC(+) switch to cuts. Actual US oil inventory data today at 18:00 CET.
US commercial crude and product stocks rising to 1293 mb in week 41 if last nights indicative numbers from API are correct.

Crude oil soon coming to a port near you. OPEC has lifted production sharply higher this autumn. At the same time demand for oil in the Middle-East has fallen as we have moved out of summer heat and crude oil burn for power for air-conditioning. The Middle-East oil producers have thus been able to lift exports higher on both accounts. Crude oil and condensates on water has shot up by 177 mb since mid-August. This oil is now on its way to ports around the world. And when they arrive, it will likely help to lift stocks onshore higher. That is probably when we will lose the last bit of front-end backwardation the the crude oil curves. That will help to drive the front-month Brent crude oil price down to the $60/b line and revisit the high $50ies/b. Then the eyes will be all back on OPEC+ when they meet in early November and then again in early December.
Crude oil and condensates at sea have moved straight up by 177 mb since mid-August as OPEC(+) has produced more, consumed less and exported more.

When it starts to move lower it moves rather quickly. Gaza, China, IEA. Brent crude is down 2.1% today to $62/b after having traded as high as $66.58/b last Thursday and above $70/b in late September. The sell-off follows the truce/peace in Gaze, a flareup in US-China trade and yet another bearish oil outlook from the IEA.
A lasting peace in Gaze could drive crude oil at sea to onshore stocks. A lasting peace in Gaza would probably calm down the Houthis and thus allow more normal shipments of crude oil to sail through the Suez Canal, the Red Sea and out through the Bab-el-Mandeb Strait. Crude oil at sea has risen from 48 mb in April to now 91 mb versus a pre-Covid normal of about 50-60 mb. The rise to 91 mb is probably the result of crude sailing around Africa to be shot to pieces by the Houthis. If sailings were to normalize through the Suez Canal, then it could free up some 40 mb in transit at sea moving onshore into stocks.
The US-China trade conflict is of course bearish for demand if it continues.
Bearish IEA yet again. Getting closer to 2026. Credibility rises. We expect OPEC to cut end of 2025. The bearish monthly report from the IEA is what it is, but the closer we get to 2026, the more likely the IEA is of being ball-park right in its outlook. In its monthly report today the IEA estimates that the need for crude oil from OPEC in 2026 will be 25.4 mb/d versus production by the group in September of 29.1 mb/d. The group thus needs to do some serious cutting at the end of 2025 if it wants to keep the market balanced and avoid inventories from skyrocketing. Given that IEA is correct that is. We do however expect OPEC to implement cuts to avoid a large increase in inventories in Q1-26. The group will probably revert to cuts either at its early December meeting when they discuss production for January or in early January when they discuss production for February. The oil price will likely head yet lower until the group reverts to cuts.
Dubai: The Mid-East anchor dragging crude oil lower. Surplus emerging in Mid-East pricing. Crude oil prices held surprisingly strong all through the summer. A sign and a key source of that strength came from the strength in the front-end backwardation of the Dubai crude oil curve. It held out strong from mid-June and all until late September with an average 1-3mth time-spread premium of $1.8/b from mid-June to end of September. The 1-3mth time-spreads for Brent and WTI however were in steady deterioration from late June while their flat prices probably were held up by the strength coming from the Persian Gulf. Then in late September the strength in the Dubai curve suddenly collapsed. Since the start of October it has been weaker than both the Brent and the WTI curves. The Dubai 1-3mth time-spread now only stands at $0.25/b. The Middle East is now exporting more as it is producing more and also consuming less following elevated summer crude burn for power (Aircon) etc.
The only bear-element missing is a sudden and solid rise in OECD stocks. The only thing that is missing for the bear-case everyone have been waiting for is a solid, visible rise in OECD stocks in general and US oil stocks specifically. So watch out for US API indications tomorrow and official US oil inventories on Thursday.
No sign of any kind of fire-sale of oil from Saudi Arabia yet. To what we can see, Saudi Arabia is not at all struggling to sell its oil. It only lowered its Official Selling Prices (OSPs) to Asia marginally for November. A surplus market + Saudi determination to sell its oil to the market would normally lead to a sharp lowering of Saudi OSPs to Asia. Not yet at least and not for November.
The 5yr contract close to fixed at $68/b. Of importance with respect to how far down oil can/will go. When the oil market moves into a surplus then the spot price starts to trade in a large discount to the 5yr contract. Typically $10-15/b below the 5yr contract on average in bear-years (2009, 2015, 2016, 2020). But the 5yr contract is usually pulled lower as well thus making this approach a moving target. But the 5yr contract price has now been rock solidly been pegged to $68/b since 2022. And in the 2022 bull-year (Brent spot average $99/b), the 5yr contract only went to $72/b on average. If we assume that the same goes for the downside and that 2026 is a bear-year then the 5yr goes to $64/b while the spot is trading at a $10-15/b discount to that. That would imply an average spot price next year of $49-54/b. But that is if OPEC doesn’t revert to cuts and instead keeps production flowing. We think OPEC(+) will trim/cut production as needed into 2026 to prevent a huge build-up in global oil stocks and a crash in prices. But for now we are still heading lower. Into the $50ies/b.


Gruvbolaget Boliden överträffade analytikernas förväntningar

Australien och USA investerar 8,5 miljarder USD för försörjningskedja av kritiska mineraler
Brent crude set to dip its feet into the high $50ies/b this week

Vad guldets uppgång egentligen betyder för världen

Spotpriset på guld över 4300 USD och silver över 54 USD

OPEC+ missar produktionsmål, stöder oljepriserna

Goldman Sachs höjer prognosen för guld, tror priset når 4900 USD

Blykalla och amerikanska Oklo inleder ett samarbete
Guld nära 4000 USD och silver 50 USD, därför kan de fortsätta stiga
Are Ukraine’s attacks on Russian energy infrastructure working?
-
 Nyheter4 veckor sedan
OPEC+ missar produktionsmål, stöder oljepriserna
-
 Nyheter2 veckor sedan
Goldman Sachs höjer prognosen för guld, tror priset når 4900 USD
-
 Nyheter3 veckor sedan
Blykalla och amerikanska Oklo inleder ett samarbete
-
 Nyheter3 veckor sedan
Guld nära 4000 USD och silver 50 USD, därför kan de fortsätta stiga
-
Analys4 veckor sedan
Are Ukraine’s attacks on Russian energy infrastructure working?
-

 Nyheter2 veckor sedan
Leading Edge Materials är på rätt plats i rätt tid
-

 Nyheter3 veckor sedan
Ett samtal om guld, olja, koppar och stål
-

 Nyheter2 veckor sedan
Nytt prisrekord, guld stiger över 4000 USD