

Analys
SEB Råvarubrev 27 oktober 2015

Köldvan svan och duvor med rävar bakom öronen
 MARKNADEN I KORTHET
Förra veckan stängde flera av världens viktiga börser på plus men råvarumarknaden vände nedåt. ECB lät i torsdags räntan vara oförändrad, men Draghi pratade mycket effektivt ned euron då man tydligt kommunicerade både signaler om ytterligare lättnad och att riskerna fortsatt är på nedsidan för både tillväxt och inflation. Dollarindex steg med över 2,7 procent över veckan, vilket förstås gav ett tydligt tryck nedåt på råvaror generellt och samtliga sektorer stängde veckan med röda siffror. Industrimetaller ledde ligan med -2,6 procent.
Förutom på ECB har fokus den senaste veckan varit på Kinas centralbank som sänkte sin styrränta med 0,25 procentenheter till 4,35 procent. Landets BNP-siffra överraskade förra måndagen på uppsidan, men en räntesänkning så snart efteråt tolkar marknaden som att ekonomin behöver hjälp på traven. Basmetaller tog initialt ett betydande kliv uppåt på nyheten, för att sedan reagera negativt; sannolikt just genom insikt om det senare. I morgon onsdag kommer Riksbankens räntebesked och SEB tror på en sänkning till -0,45 procent. Riksbankens agerande är högintressant för en investerare i råvarucertifikaten då underliggande termin (i nästan alla fall) är noterad i US-dollar och certifikatet därför påverkas av växelkursen mellan US-dollar och kronor. Om Riksbanken sänker räntan kommer, allt annat lika, kronan att försvagas mot US-dollarn vilket i sig ger en positiv effekt på värdet av terminen. Onsdagen blir intressant – som vår chefsekonom Robert Bergqvist konstaterade i gårdagens Morning Alert börjar det onekligen bli ”riktigt trångt i duvslaget”, vilket på svenska betyder att många centralbanker annonserar fler lättnader. Frågan är hur stor räv bakom örat Riksbanken har. För vidare läsning om fåglar kan man se stycket om el, där vi denna vecka får lära oss mer om svanar.
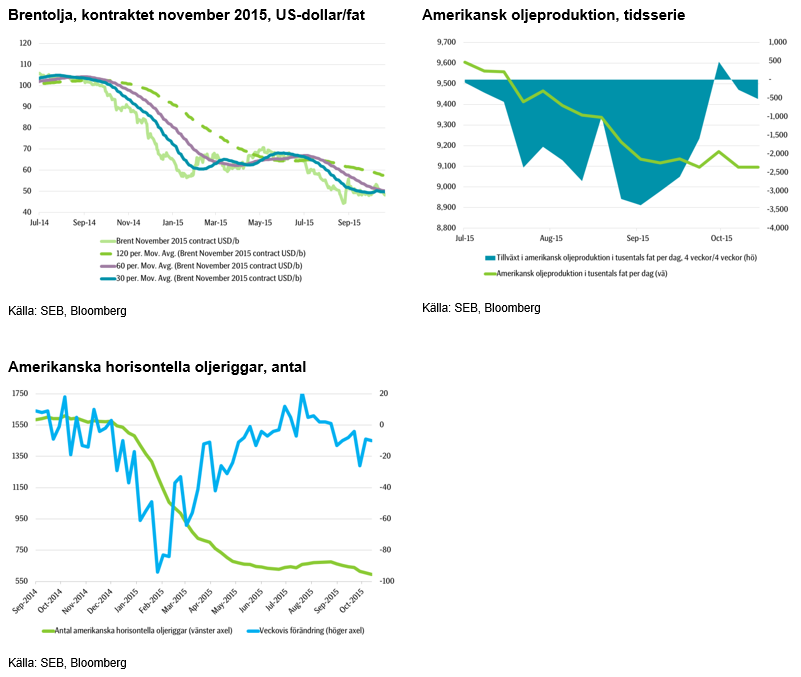
Oljemarknaden har sett priset återgå till sin nivå kring 48 US-dollar per fat. OPEC:s medlemsländer sätter i ökande grad priset själva och det globala överskottet av olja märks numer även i marknaden för oljeprodukter. Oljemarknaden står för fundamentalt nya utmaningar framöver och vi tror att priskriget kommer att intensifieras.
Industrimetaller har fortsatt att leva i bruset efter Glencores överraskande neddragning av zinkproduktionen. Även aluminiumpriset stärktes av nyheten, men då fundamentala faktorer för metallen inte har förbättrats, utan snarare försämrats, har priset i accelererande hastighet fortsatt nedåt. För kopparen ser vi egentligen ingen fundamental faktor som väger över för en starkare prisbild. Riskerna är på nedsidan och vi ligger kvar i vår korta position. Guldprisets förstärkning har däremot mattats av en del; sannolikt på grund av den starkare US-dollarn.
Vad gäller jordbruksprodukter handlar det mesta just nu om vädret: Med tanke på vilka effekter el Niño egentligen ger, ser vi just nu det omvända – främst USA, men även östra Europa borde få mer regn, men är istället torrare än normalt. I Brasilien ser man redan nu goda förutsättningar för nästa års kaffeskörd och priset fortsätter nedåt.
TRENDER I SAMMANDRAG
- Kinas lägre tillväxt fortsätter vara största osäkra faktorn för råvaror
- Priset på Brentolja tillbaka till och förbi 48 US-dollar per fat. Överproduktionen märks nu även i produkter
- Klart nedåttryck i basmetaller på grund av överproduktion och osäkra utsikter vad gäller efterfrågan
- För jordbruksprodukter handlar det i stor utsträckning om vädret – nu i stort omvänt mot normalläget
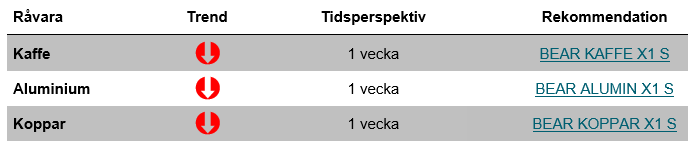
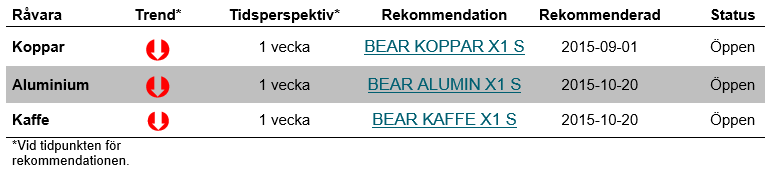
VECKANS REKOMMENDATIONER
En placering i certifikat och warranter är förknippat med risker. Du kan förlora hela ditt investerade kapital. Läs mer om riskerna i SEB:s offentliggjorda Grundprospekt för certifikat- och warrantprogram på seb.se/cert eller seb.se/mini.
OLJA
Oljepriset rörde sig kraftigt förra veckan med en nedgång om nära fem procent. Nu är det tillbaka till och även förbi nivån 48 US-dollar per fat, parallellt med att US-dollarindex stärktes 2,74 procent. WTI:n gick ned ännu mer med 6,5 procent, vilket är den lägsta nivån sedan slutet av september.
Marknadsandelar är fåfänga. Lönsamhet är sunt förnuft. Kassaflödet är verklighet. Den amerikanska skifferoljeproduktionen ändrade förutsättningarna på marknaden för ett år sedan – nu läser vi även rubriker som innehåller ”hybrid”, ”elektricitet” och ”väte”. När Toyota säger att man inte kommer att producera ”normala” bränslebilar år 2050 förstår man att det då kommer vara förödande för OPEC, ha signifikant påverkan år 2025 och bör påverka OPEC:s strategi och planering redan i år. För ett år sedan sade tillverkarna att man behövde ha ett oljepris på 100 US-dollar per fat för att producera Nordsjöolja. Nu är kostnaden för att producera olja från Johan Castberg-fältet 60 US-dollar per fat – endast ett år senare! Det är verkligen en annorlunda marknad nu…
Det globala överskottet av olja börjar nu sprida sig till marknaden för produkter. Hittills har efterfrågan på oljebaserade produkter varit stark vilket har hjälpt till att hålla produktlagren i schack samt även säkrat marginalerna för raffinaderierna. Att överskottet nu börjar märkas även i marknaden för produkter gör att marginalerna minskar och raffinaderierna är mindre angelägna att köpa in olja. Detta gör i sin tur att oljepriset får svårare att göra större rörelser.
Vidare har vi sett att OPEC:s medlemsländer nu skjuter under varandra i pris både mot Asien och USA för att säkra sin fysiska försäljning. Det brukar annars finnas något slags gemensam front från OPEC:s sida mot köparna, men tydligen inte just nu. Detta i sin tur har lett till ökade transporter av OPEC-olja till den amerikanska gulfen, men också som ett resultat av minskad amerikansk produktion. Detta har lett till att producenterna av olja i Latinamerika måste sänka sina priser. Snart kommer också världen få se en ökad produktion av olja från Iran. Priskriget kommer med största sannolikhet alltså att intensifieras…
Bjarne Schieldrop
Chief Analyst
SEB
TREND
- Oljepriset tillbaka kring 48 US-dollar per fat
- Fundamentalt lägre pris på Brentolja, trots starkare US-dollar
- Marknaden står inför nya förutsättningar – användningen av olja kan bli strukturellt annorlunda
- Globalt överskott av olja börjar även synas i marknaden för oljeprodukter – fungerar också dämpande på oljeprisrörelser
- OPEC:s länder sätter i ökande grad priset på olja individuellt
- Vi tror att priskriget kommer intensifieras.
ALUMINIUM
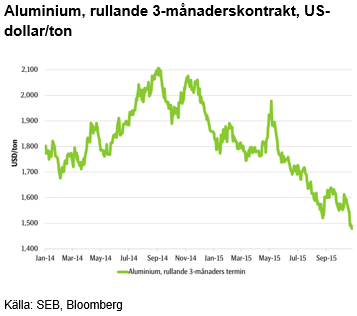 Rörelsen i aluminium senaste veckorna har verkligen varit intressant. Den började med en rörelse efter Glencores neddragning av nickelproduktionen då marknaden förväntade sig neddragningar även av aluminiumproduktionen, men då signifikanta sådana ännu ej har kommit, så började marknaden vika. Samtidigt började US-dollarn stärkas och aluminiumpriset fortsatte att tryckas ned. Chinalco, Kinas största producent av primäraluminium och världens tredje största tillverkare, annonserade en neddragning av 500 000 ton per år, men det räckte inte för att ge marknaden stöd. Hur långt ned kan priserna tryckas?
Om man lyfter blicken litet och ser på prisutvecklingen under en 30-årsperiod, så är den längre genomsnittliga prisuppgången cirka 1,3 procent per år. Man ser också en mycket tydlig stödlinje mot vilken priset har studsat ungefär fem gånger under 30-årsperioden. Vi är nu helt nära den nivån och den tidigare lägstanivån, 1521 US-dollar per ton, som sågs i augusti tvekade marknaden inför men priset pressades till slut igenom och förbi. När Draghi i torsdags pratade ner euro-kursen på presskonferensen efter att ha lämnat räntan oförändrad apprecierade alltså US-dollarn relativt euron och sände kursen på metallen till nivåer strax under 1489 US-dollar per ton.
I fredags annonserade så kinesiska centralbanken att man sänker räntan med 0,25 procentenheter, vilket initialt tolkades positivt av marknaden och priserna på basmetaller sköt kraftigt uppåt – aluminium rörde sig cirka 4,5 procent intradag. När marknaden sedan insåg att det kanske egentligen inte var så vidare värst önskvärt med ytterligare lånefinansierad tillväxt i Kina åkte priserna sedan tillbaka och fortsatte på den tidigare nedåtgående trenden.
Så vad händer egentligen nu? Rapporter om att den genomsnittliga produktionskostnaden för kinesiskt aluminium är kring 1950 US-dollar per ton innebär att de absolut flesta tillverkare i Kina totalt sett är olönsamma, om de inte subventioneras på något vis. Det pågår något slags internationellt chickenrace och förr eller senare måste någon dra ned på produktionen. En rimlig gissning är att vi kommer att se priser nedåt den längre stödlinjen, det vill säga dryga 1400 US-dollar per ton. Det är alltså en viss nedsida kvar. Vad som händer sedan är riktigt spännande att tänka på…
TREND
- Tydlig press nedåt i marknaden
- Priset sannolikt på väg mot sin längre stödlinje
- Fortsatt (ytterligare) produktion trots tillverkning olönsam
- Vi tror att det är nedsida kvar i priset
REKOMMENDATION
- BEAR ALUMIN X1 S
KOPPAR
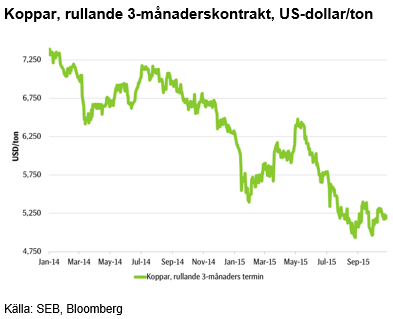 Under veckan har inga egentliga nyheter rörande specifikt koppar kommit och priset har trendat nedåt för att kontraintuitivt stärkas tillsammans med US-dollarn. I fredagens sena handel, vände kopparpriset tillsammans med både övriga basmetaller och olja kraftigt nedåt. Fallet var cirka tre procent intradag och vändningen var verkligen tvär. Dock har priset rekylerat under gårdagen och följer en volatil utveckling.
Anledningen är att marknaden å ena sidan utgörs av de som tror att den lägre kinesiska tillväxten och de i många fall till synes motstridiga policyåtgärder som görs i landet kommer att störa marknaden rejält och översvämma resten av världen med koppar. Även den tekniska bilden pekar mot ett lägre pris. De som tror på en prisuppgång pekar på hur kopparproduktionen ofta överraskar på nedsidan, samt att marknaden redan har börjat se tecken på just detta. En faktor vars effekter kan störa både produktion och leverans är el Niño.
Rent tekniskt ser vi att priset har börjat skapa en bear-triangel och vi tror att det kommer att falla nedåt 5010 US-dollar per ton, rekylera något och sedan bryta triangeln nedåt.
Sammantaget anser vi att fler faktorer talar för ett lägre pris. Sedan vi initierade vår rekommendation har priset stigit cirka två procent och US-dollar har samtidigt stärkts knappt en halv procent mot kronan. Detta har dämpat effekten av det högre priset på vår korta position och vi väljer att ligga kvar i den då vi anser att risken är på nedsidan.
TREND
- Kopparpriset visar på visst motstånd mot fallet i basmetaller
- Största orosmomentet är vad som händer i Kina – tecknen visar på minskad efterfrågan
- Tekniskt ser vi en tid av volatilitet framför oss, men risken är på nedsidan
- Vi tror på ett lägre kopparpris och ligger kvar i vår rekommendation.
REKOMMENDATION
- BEAR KOPPAR X1 S
KAFFE
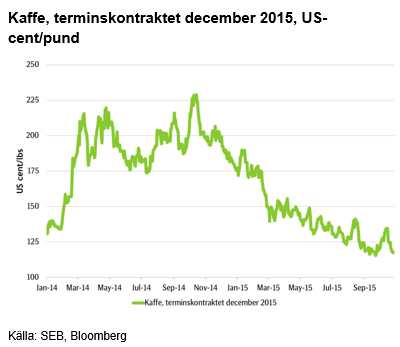 Den tidigare prisuppgången på kaffe berodde på att det torrare vädret skapade oro för nästa års skörd. Nu har viktiga odlingsområden i Brasilien tvärtom sett goda regnfall och mer förutspås komma närmaste en till två veckorna. Det är goda nyheter för nästa års skörd, då regn vid denna årstid hjälper till att fixera blommorna på träden. Vi närmar oss nu septembers låga nivå och för att hitta ännu lägre nivåer måste vi gå tillbaka till slutet av 2013-början av 2014.
Korrelationen mellan den brasilianska realens växelkurs och kaffepriset är generellt stark och har varit särskilt stark under 2015, vilket, då realen har försvagats, har bidragit till att pressa ned priset på kaffet. Senaste tiden har realen haft ett visst stöd, men nu ser vi att valutan har börjat försvagas igen och vi tror på en ytterligare försvagning. Även tekniskt ser vi nedåtpress på kaffepriset även om nivån kring 113 US-cent per pund sannolikt är en viktig nivå att bevaka då det är septembers lägsta nivå. Priset är väl under sina både kortare och längre glidande medelvärden. Vi ligger kvar i vår korta position.
TREND
- För nästa års skörd gynnsamma regn ses i Brasilien
- Den brasilianska realen kommer sannolikt försvagas ytterligare
- Tekniskt ser vi press på nedsidan
- Vi ligger kvar i vår korta position i kaffe.
REKOMMENDATION
- BEAR KAFFE X1 S
EL
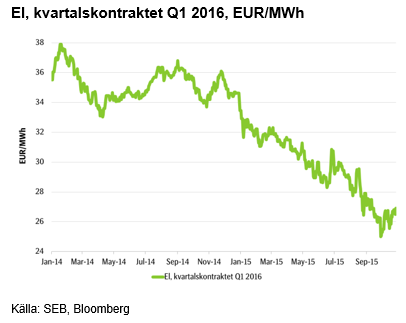 Elpriset har fortsatt sin resa uppåt och den långa nedåtgående trenden är, åtminstone som det ser ut nu, bruten. Kolpriset har rört sig sidledes till något ned och priset på utsläppsrätter har fortsatt uppåt. Den hydrologiska balansen är i överskott mot normalen, men det blir mindre undan för undan. Det ligger nu på strax över 2 TWh vilket kan gå mycket fort att radera ut. Vädret i Norden under den närmaste tiden ser också ut att bli relativt torrt men å andra sidan med en relativt liten avvikelse i temperatur mot normalnivån.
Då fundamentala faktorer förvisso ger priset på el ett visst stöd är de inte tillräckliga för att skjuta det högre. Istället är det just vädret som har gjort att priset har brutit trenden och som fortsatt också kan trycka det högre. Just de närmaste dagarna verkar vädret inte bjuda på några större överraskningar och uppsidan i elpriset är kanske begränsad, men man bör hålla ett öga på väderleksrapporterna.
En intressant observation från sydvästra England är ankomsten av Cygnus columbianus bewickii. Vad som kanske låter som ett väderfenomen eller något slags moln är – förvisso vitt, puffigt och faktiskt, som det skall visa sig, relaterat till vädret – den mindre sångsvanen. En del av populationen av den rara andfågeln, som häckar på den ryska tundran, flyttar vintertid till England. För den som är mer intresserad av elpriset än av den 115-150 cm långa fågeln, är det viktiga i sammanhanget kanske snarast att den ofta flyttar direkt innan vintern kommer. Dess ankomst till England, vilket sammanföll med höstens första frost i regionen, är den tidigaste någonsin. Somliga påstår att detta förebådar en lång och sträng vinter.
Om det är lika träffsäkert att spana i skyn efter en svans gump som att spå i kaffesump är oklart, men om svanarna har rätt kommer den senaste tidens utveckling av elpriset alltså sannolikt att fortsätta. Vi får väl se…
TREND
- Fundamentala faktorer sidledes till något uppåt i pris
- Den hydrologiska balansen i litet överskott
- Vi konstaterar att den långa nedåtgående trenden i elpriset åtminstone tillfälligt är bruten men avvaktar än så länge med en uttalad rekommendation.
AKTUELLA REKOMMENDATIONER
[box]SEB Veckobrev Veckans råvarukommentar är producerat av SEB:s Commodities Sales desk och publiceras i samarbete och med tillstånd på Råvarumarknaden.se[/box]
KÄLLOR
Bloomberg, Reuters, SEB
VILLKOR
För varje enskilt certifikat/mini future finns Slutliga Villkor som anger de fullständiga villkoren. Slutliga Villkor finns tillgängligt på kurssidan för respektive certifikat/mini future på www.seb.se, Börs & finans, fliken Strukturerade placeringar.
RISKER
En sammanfattning av de risker som är förknippade med Börshandlade certifikat generellt finns i Produktbroschyren för respektive certifikat eller mini future som är tillgängligt på seb.se/cert respektive seb.se/mini. För en fullständig bild av riskerna behöver du ta del av SEB:s offentliggjorda Grundprospekt för Certifikat- och Warrantprogram som är publicerat på www.seb.se/cert respektive seb.se/mini.
DISCLAIMER
Detta marknadsföringsmaterial, framtaget av SEB:s Commodities Sales desk, har upprättats enbart i informationssyfte.
Även om innehållet är baserat på källor som SEB bedömt som tillförlitliga ansvarar SEB inte för fel eller brister i informationen. Den utgör inte oberoende, objektiv investeringsanalys och skyddas därför inte av de bestämmelser som SEB har infört för att förebygga potentiella intressekonflikter. Yttranden från SEB:s Commodities Sales desk kan vara oförenliga med tidigare publicerat material från SEB, då den senare hänvisas uppmanas du att läsa den fullständiga rapporten innan någon åtgärd vidtas.
Dokumentationen utgör inte någon investeringsrådgivning och tillhandahålls till dig utan hänsyn till dina investeringsmål. Du uppmanas att självständigt bedöma och komplettera uppgifterna i denna dokumentation och att basera dina investeringsbeslut på material som bedöms erforderligt. Alla framåtblickande uttalanden, åsikter och förväntningar är föremål för risker, osäkerheter och andra faktorer och kan orsaka att det faktiska resultatet avviker väsentligt från det förväntade. Historisk avkastning är ingen garanti för framtida resultat. Detta dokument utgör inte ett erbjudande att teckna några värdepapper eller andra finansiella instrument. SEB svarar inte för förlust eller skada – direkt eller indirekt, eller av vad slag det vara må – som kan uppkomma till följd av användandet av detta material eller dess innehåll.
Observera att det kan förekomma att SEB, dess ledamöter, dess anställda eller dess moder- och/eller dotterbolag vid olika tillfällen innehar, har innehaft eller kommer att inneha aktier, positioner, rådgivningsuppdrag i samband med corporate finance-transaktioner, investment- eller merchantbanking-uppdrag och/eller lån i de bolag/finansiella instrument som nämns i materialet.
Materialet är avsett för mottagaren, all spridning, distribuering mångfaldigande eller annan användning av detta meddelande får inte ske utan SEB:s medgivande. Materialet riktar sig inte till personer vars medverkan kräver ytterligare prospekt, registrerings- eller andra åtgärder än vad som följer av svensk rätt. Det åligger var och en att iaktta sådana restriktioner. Materialet får inte distribueras i eller till land där distribution kräver ovan nämnda åtgärder eller strider mot reglering i sådant land. Materialet riktar sig således inte till fysiska eller juridiska personer hemmahörande i USA eller i något annat land där publicering eller tillhandahållande av materialet är förbjudet eller strider mot tillämpliga bestämmelser i landet.
Oaktat detta får SEB tillåta omfördelning av materialet till utvald tredje part i enlighet med gällande avtal. Materialet får inte spridas till fysiska eller juridiska personer som är medborgare eller har hemvist i ett land där sådan spridning är otillåten enligt tillämplig lag eller annan bestämmelse.
Skandinaviska Enskilda Banken AB (publ) är ett publikt aktiebolag och står under tillsyn av Finansinspektionen samt de lokala finansiella tillsynsmyndigheter i varje jurisdiktionen där SEB har filial eller dotterbolag.
Selling down on a ”deal”. Brent crude fell 6.2% last week with accelerated weakness towards the end of the week. Close of the week at $87.33/b and low of the week (and on Friday) of $85.8/b. Brent is falling another 4% this morning to $83.7/b on confirmation by Iran that a MoU text has been reached and that it will be signed on Friday this week.

So what is this ”deal” worth? Talk on the desk here this morning is that it is much like ”putting lipstick on a pig” where Trump has to sell this at home as a victory where ”the SoH has reopened”, the nuclear issue will be ironed out over the coming 60 days (or maybe 600 days?) and US consumers are getting a lower gasoline price and maybe US republicans survives the midterm elections.
The importance for Iran is that it emerges as the defacto winner of this war in the eyes of the non-US public world. That Iran now onwards is the ”ruler of the SoH” (combo of geography and new weapons systems like drones) or more softer: ”the guarantor of safe passage through the SoH”.
Iran doesn’t need nuclear weapons any more. Nuclear deterrence doesn’t work any more. Ukraine has made many attacks deep into Russia without being nuked in return. Plenty of Iranian ballistic rockets blasts over Israel but Iran wasn’t nuked in return.
There is no trust between the US and Iran. We don’t know all the details yet of the MoU. But what we do know is that there is no trust between the US and Iran what so ever. This is probably more like a descriptive text on how they can cooperate in a way where both sides keeps tactical leverage. Neither side makes irreversible concessions. Violations can be punished quickly. Cooperation produces immediate benefits.
This is a fragile structure. It can easily break down. There may be details which cannot be overcome. To be seen on Friday. The US has to show that it is willing put enough force behind managing and restraining Israel versus Hezbollah in Lebanon. We have seen that Netanyahu hasn’t listened all that much to Trump’s directives and wishes. This could be a major obstacle.
A gradual reopening is tactically preferable for Iran. A tactical leverage for Iran right now is that global oil stocks have been drawn down towards painful and increasingly dangerous levels with increasing risks for oil price spikes in mid-July to August. This together with US midterm elections on 3 November gives tactical leverage to Iran. Iran probably doesn’t want to fully give up on that leverage. A rapid, full reopening where global stocks are able to refill over the coming 60 days will significantly erode that leverage. If Iran reinstates a closure of the SoH after 60 days (if talks break down again), then the effect won’t be that impactful in terms of prices and the US midterm elections.
So a gradual and partial reopening where global markets gets the oil they need while they are unable to rebuild stocks could be a practical middle way for both parties. Trump can sell it as ”the SoH has reopened” and get affordable gasoline for US consumers. Iran can sell it as ”the SoH has fully reopened, but there is some friction” so flow is only 60-80% of normal.
Not much real demand destruction below $100/b. What we do know is that there is not much real price pain demand destruction for oil globally at an oil price below $100/b. A lot of demand-shock destruction. Fear. But demand should now come roaring back towards normal with fear for exceptionally high prices now is rapidly receding.
Sudden China demand destruction due to EVs? Bullocks. EV share of total Chinese carpool now around 13%. Share of new sales of EVs has reached 50%. This is a very gradual process. It doesn’t make oil demand fall like a rock over night. When EV new sales share reaches 100%, then the gasoline car pool will contract by some 5-10% per year. But that is only gasoline. Sudden reduction in Chinese oil demand is more about shock and risk.
Chinese crude oil imports will come roaring back. At what price? Today’s ”neutral” oil price is $70/b. That is the five year price which has steadily traded around the $70/b mark over the past 3-4 years. With still a risky picture one would think that China and the rest of the world will be big buyers of oil in the range of $70-85/b.
Global demand will likely snap back towards normal, forecasted demand and growth at such prices.
Physical reopening is a gradual process. The physical and practical reopening of the SoH will likely be gradual rather than sudden. And that probably suites Iran tactically as well.
Brent M1 price versus the Brent 5-yr (today’s ”normal” price)

Market is starting to take US/Iran headlines with a pinch of salt. Brent crude rose $2.8/b yesterday to an official close of $112.1/b. But after that it traded as low as $108.05/b before ending late night at around $109.7/b. Through the day it traded in a range of $106.87 – 112.72/b amid a flurry of news or rumors from Iran and the US. ”US temporary sanctions during negotiations” (falls alarm). ”We will bomb Iran” (not anyhow),… etc. While the market is still fluctuating to this kind of news flow, it is starting to take such headlines with a pinch of salt.
We’ll see. Maybe, maybe not. The Brent M1 contract is trading at $110.2/b this morning which very close to the average ticks through yesterday of $110.4/b.
Trump with bearish, verbal intervention whenever Brent trades above $110/b it seems. What seems to be a pattern is that Trump states something like ”very good negotiations going on with Iran”, ”New leaders in Iran are great,..”, ”Great progress in negotiations,…”, ”Deal in sight,..” etc whenever the Brent M1 contract trades above $110/b. An effort to cool the market. These hot air verbal interventions from Trump used to have a heavy bearish impact on prices, but they now seems to have less and less effect unless they are backed by reality.
As far as we can see there has been no real progress in the negotiations between the US and Iran with both sides still standing by their previous demands.
Iran is getting stronger while the cease fire lasts making a return to war for Trump yet harder. Iran is naturally in constant preparation for a return to war given Trump’s steady threats of bombing Iran again. Iran is naturally doing what ever is possible to prepare for a return to war. And every day the cease fire lasts it is better prepared. This naturally makes it more and more difficult and dangerous for the US to return to warring activity versus Iran as the consequences for energy infrastructure in the Persian Gulf will be more and more severe the longer the cease fire lasts. Israel seems to see it this way as well. That the war is not won and that current frozen state of a cease fire gives Iran opportunity to rebuild military and politically.
Global inventories are drawing down day by day. How much? In the meantime the Strait of Hormuz stays closed. There is varying measures and estimates of how much global inventories are drawing down. Our rough estimate, back of the envelope, is that global inventories are drawing down by at least some 10 mb/d or about 300 mb/d in a balance between loss of supply versus demand destruction. Other estimates we see are a monthly draw of 250-270 mb/d. The IEA only ’measured’ a draw in global observable stocks of 117 mb in April with oil on water rising 53 mb while on shore stocks fell 170 mb. But global stocks are hard to measure with large invisible, unmeasured stocks. As such a back of the envelope approach may be better.
Oil products is what the world is consuming. Oil product prices likely to rise while product stocks fall. Strategic Petroleum Reserves (SPR) are predominantly crude oil. Discharging oil from OECD SPR stocks, a sharp reduction in Chinese crude imports and a reduction in global refinery throughput of 6-7 mb/d has helped to keep crude oil markets satisfactorily supplied. But global inventories are drawing down none the less. And oil products is really what the world is consuming. So if global refinery throughput stays subdued, then demand will eventually have to match the supply of oil products. The likely path forward this summer is a steady draw down in jet fuel, diesel and gasoline. Higher prices for these. Then, if possible, higher refinery throughput and higher usage of crude in response to very profitable refinery margins. And lastly sharper draw in crude stocks and higher prices for these. But some 6 mb/d of oil products used to be exported through the Strait of Hormuz. And it may not be so easy to ramp up refinery activity across the world to compensate. Especially as Ukraine continues to damage Russian refineries as well as Russian crude production and export facilities.
Watch oil product stocks and prices as well as Brent calendar 2027. What to watch for this summer is thus oil product inventories falling and oil product premiums to crude rising. Another measure to watch is the Brent crude 2027 contract as it rises steadily day by day as the Strait of Hormuz stays closed and global oil inventories decline. The latter is close to the highest level since the start of the war and keeps rising.
The Brent M1 contract and the Brent 2027 prices and current price of jet fuel in Europe (ARA). All in USD/b

Our back of the envelope calculation of the global shortage created by the closure of the Strait of Hormuz. Note that 3.5 mb/d of discharge from SPR is also a draw. Note also that ’Forced demand loss’ of 2.5 mb/d is probably temporary and will fall back towards zero as logistics are sorted out leaving ’Price demand loss’ to do the job of balancing the market. Thus a shortfall of at least 9 mb/d created by the closure. More if SPR discharge is included and more if Forced demand loss recedes.

Brent is climbing higher. Front-month is at USD 106.3/bl this morning, close to a weekly high and a USD 9/bl jump from Mondays open. This is the move we flagged as a risk earlier in the week: the market shifting from ”a deal is around the corner” to ”this is going to take longer than we thought”.

Analyst Commodities, SEB
During April, rest-of-year Brent remained remarkably stable around USD 90/bl. A stability which rested on one single assumption: the SoH reopens around 1 May. That assumption is now slowly falling apart.
As we highlighted yesterday: every week of delay beyond 1 May adds (theoretically) ish USD 5/bl to the rest-of-year average, as global inventories draw 100 million barrels per week. i.e., a mid-May reopening implies rest-of-year Brent closer to USD 100/bl, and anything pushing into June or July takes us meaningfully higher.
What’s changed in the last 48 hours:
#1: The US military has formally warned that clearing suspected sea mines from SoH could take up to six months. That is a completely different timescale from what the financial market is pricing. Even a political deal tomorrow does not immediately reopen the strait.
#2: Trump has shifted his tone from urgency to ”strategic patience”. In yesterday’s press conference: ”Don’t rush me… I want a great deal.” The market is reading this as a president no longer feeling pressured by timelines, with the naval blockade running in the background.
#3: So far, the military activity is escalating, not de-escalating. Axios reports Iran is laying more mines in SoH. The US 3rd carrier strike group (USS George H.W. Bush) is arriving with two countermine vessels. Trump yesterday ordered the US Navy to destroy any Iranian boats caught laying mines. While CNN reports that the Pentagon is actively drawing up plans to strike Iranian SoH capabilities and individual Iranian military leaders if the ceasefire collapses. i.e., NOT a attitude consistent with an imminent deal!
Spot crude and product prices eased off the early-April highs on a combination of system rerouting and deal optimism. Both now weakening. Goldman estimates April Gulf output is reduced by 14.5 mbl/d, or 57% of pre-war supply, a number that keeps getting worse the longer this drags on.
Demand-side adaptation is ongoing: S. Korea has cut its Middle East crude dependence from 69% to 56% by pulling more from the Americas and Africa, and Japan is kicking off a second round of SPR releases from 1 May. But SPRs are finite.
Ref. to the negotiations, we should not bet on speed. The current Iranian leadership is dominated by genuine hardliners willing to absorb economic pain and run the clock to extract concessions. That is not a setup for a rapid resolution. US/Israeli media briefings keep framing the delay as ”internal Iranian divisions”, the reality is more complicated and points toward weeks and months, not days.
Our point is that the complexity is large, and higher prices have only just started (given a scenario where the negotiations drag out in time). The market spent April leaning on the USD 90/bl rest-of-year assumption; that case is diminishing by the hour. If ”early May reopening” is replaced by ”June, July or later” over the next week or two, both crude and products have meaningful room to reprice higher from here. There is a high risk being short energy and betting on any immediate political resolution(!).


Vattenfalls och Industrikrafts kärnkraftsbolag Videberg Kraft har valt Rolls-Royce SMR
Selling down on a ”deal”

Sommarväder skapar prisrally på elbörsen
Oil product price pain is set to rise as the Strait of Hormuz stays closed into summer

