Analys
SEB Råvarubrev 23 februari 2016

 Metallerna tar ledartröjan
MARKNADEN I KORTHET
Förra veckans positiva sentiment fortsätter även denna vecka. LMEs basmetallindex har brutit upp ur en bottenformation så en mer generell metallrekyl ser ut att vara i görningen. Fram till första mars bör vi också förvänta oss ytterligare utspel avseende förra veckans överenskommelse(?) om att frysa oljeproduktionen inom delar av OPEC (t.ex. besöker Nigerias president Saudiarabien denna vecka).
Råvaror: Efter en relativt volatil vecka för oljan slutade vi dock med ett mer eller mindre oförändrat pris. Guldet återtestade sitt tidigare brott av $1191/uns, vilket höll med bravur, något som vi ser som positivt när vi tittar framåt. Zink hade en stark vecka, den femte på raken, och vi tror på mer uppgång i närtid. Elpriset (kvartal 2) hade sin starkaste vecka på ett bra tag och har nu återtagit ungefär hälften av de senaste veckornas nedgång. Prisutvecklingen på nickel ser riktigt spännande ut Till och med järnmalm visar tecken på att kvickna till med en uppgång på 18.2% i år.
Valuta: Dollarn handlade större delen av veckan riktningslöst men med en något svag avslutning på veckan. Pundet har dock sedan fredagen fallit efter att folkomröstningen om Storbritanniens framtid inom EU utlysts till den 23:e juni (samt att den populäre Boris Johnson tagit ställning för en Brexit). Den svenska kronan hade en stark vecka efter att ett något högre än förväntad inflationstal minskat trycket på Riksbanken att göra mer. Bättre metallpriser bör framför allt gynna AUD, CAD and BRL.
Börser: Lättnadsrallyt fortsatte som planerat förra veckan och MSCI’s världsindex hade sin bästa vecka sedan början av oktober förra året. Det positivare sentimentet bör kunna guida priserna ytterligare något högre i närtid men oklarheten över oljepriset bör begränsa uppsidespotentialen något.
Räntor: Bara marginella förändringar noterade.
TRENDER I SAMMANDRAG
- Större osäkerhet i oljepriset i och med att vi numera får nyheter som både stödjer en fortsatt uppgång (dock begränsad som vi ser det) likväl som ytterligare nedgångar. Fortsatt hög volatilitet.
- Guldet behöver passera $1240/uns för att bekräfta nästa uppgångsfas.
- El borde kortsiktigt kunna stiga ytterligare (€18.80 – 19.30 bör vara maximal potential).
- Nickel gjorde en U-sväng och hade sin bästa vecka på mer än ett år (o vi tror det kommer mer).
VECKANS REKOMMENDATIONER
En placering i certifikat och warranter är förknippat med risker. Du kan förlora hela ditt investerade kapital. Läs mer om riskerna i SEB:s offentliggjorda Grundprospekt för certifikat- och warrantprogram på seb.se/cert eller seb.se/mini
OLJA BRENT
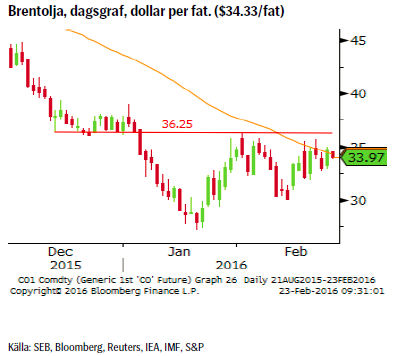 Ryktena avseende en överenskommelse mellan Ryssland, Qatar, Saudiarabien m.fl. angående produktionsneddragningar visade sig handla om att frysa produktionen på januaris nivå. Utan produktionsneddragningar påverkar inte överenskommelsen det överutbud som råder. Försök till att bredda överenskommelsen kommer sannolikt att ske under veckan (Ryssland har sagt att senast första mars ska en överenskommelse ligga fast).
TREND
- Neddragningen inom skifferolja fortsätter. Senast rapporterades det att nu bara två counties i North Dakota ligger över brytpunkten för lönsamhet (däremot har man gått om borrtillstånd att ta av om/när priserna blir högre).
- Oljelagren i USA fortsatte öka förra veckan och nådde ånyo nya rekordnivåer.
- Det rapporteras om att vissa skifferoljeproducenter börjat sälja av 2017 års produktion nu när priset rekylerat upp ($40-45/fat andra halvåret 2017) för att kunna låsa in i alla fall en viss vinst (beteendet visar på att ev. prisuppgångar kommer att mötas av förnyat säljande).
- S&P’s sänkning av kreditbetygen för ett antal oljeproducerande länder (Saudiarabien föll mest) pekar ju tydligt på att man inte ser någon större sannolikhet till bestående stigande priser.
- IMF varnar för att oljepriset riskerar att förbli lågt längre än förväntat.
- IEA räknar nu med att skifferoljeproduktionen faller med 600k fat per dag 2016.
- Överenskommelsen mellan Ryssland och Saudiarabien överskuggar den fortsatt höga risken för en eskalering i regionen (läs Turkiet & Ryssland).
REKOMMENDATION
- Vi rekommenderar fortfarande en strategi bestående av att sälja in i uppgångar (idealmål = $39/fat) då vi inte ser dessa som bestående.
EL
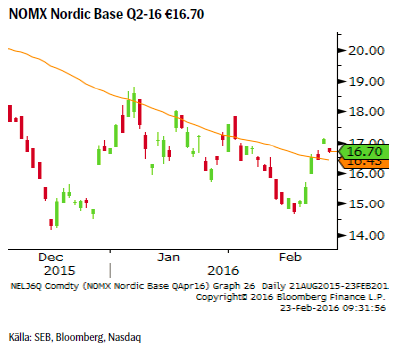 Priset har nu stigit upp till det pris vi förra veckan sökte dvs. strax ovanför det negativt lutade 55-dagars medelvärdet. Vi ser dock en ökad risk för ytterligare uppgång i närtid givet bl.a. väderprognoserna.
TREND
- Befinner sig fortsatt i en fallande trend.
- Kommande veckas väderprognos pekar mot både kallare och torrare väder.
- Hydrobalansens överskott har minskat till 3.6 TWh och förväntas förbytas till ett underskott från och med nästa vecka.
REKOMMENDATION
Vi tycker inte att marknaden har betett sig så som väntat (priset ”hoppade” högre vid måndagens öppning samt att förra veckans uppgång är för aggressiv för att vara slutet på en uppgång) och rekommenderar därför att stänga positionen med förlust.
- STÄNG BEAR EL X4 S (rekommendationen initierad på rörelsen upp till €16.65).
KOPPAR (LME 3M)
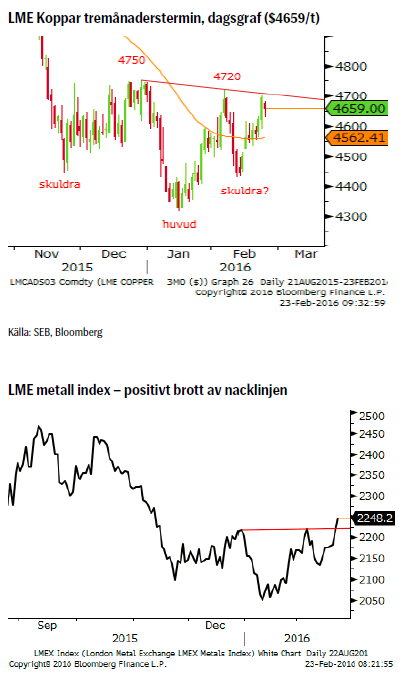 Efter förra veckans uppgång så är vi nu i princip framme vid det mycket viktiga motståndsområdet, 4720 – 4750, där de senaste månaders korrektioner har tagit slut. Givet det positivare risksentimentet så måste vi nog börja planera för ett eventuellt brott på uppsidan. De korta positionerna bör nu vara täckta och vid ett brott av 4720 bör en kortsiktig lång position övervägas (mål 4,850 alternativt 5098).
TREND
- Den rådande nedåttrenden utmanas inte på allvar förrän 4850 passeras.
- Lagren hos LME har fortsatt att minska.
- Fortsatta produktionsneddragningar.
- En möjlig men ännu obekräftad bottenformation (inverterad huvud/skuldrabotten) i prisgrafen bör bevakas noga (bekräftas vid ett pris över 4720).
REKOMMENDATION
- BULL KOPPAR X2 S vid brott av 4720.
NICKEL (LME 3M)
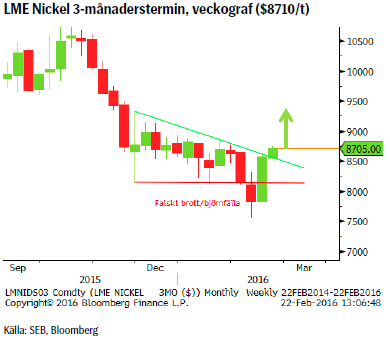 En klassisk björnfälla! Marknaden bröt förr förra veckan ned under $8100/ton bara för att sedan göra en tvärvändning och kraftigt stiga. Beteendet är mycket positivt och bör leda till ytterligare uppgång kommande vecka/veckor.
TREND
- Trots den rekyl som pågår (och bör pågå ytterligare ett tag) så är den långsiktiga trenden fortsatt i fallande.
- Indonesiens översyn av innevarande exportbegränsningar för nickelmalm (för att tvinga fram investeringar i smältverk) kan leda till ett ökat utbud om man skulle bestämma sig för att lätta på restriktionerna (vilket vi finner troligt).
- En större och längre korrektion riskerar ju också att fördröja nödvändig produktionsneddragning dvs. att fördröja en mer balanserad marknad.
- Ett förstahandsmål för rekylen bör sökas vid 9330.
REKOMMENDATION
- BULL NICKEL X2 S
GULD
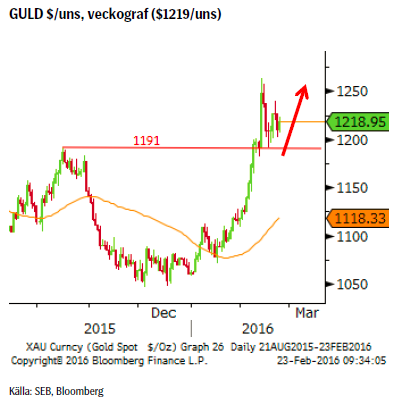 Guldpriset befann sig förra veckan i fortsatt konsolidering. I och med att vi ännu inte handlat under (vi var dock oerhört nära då det lägsta priset förra veckan blev 1191,02) så ligger vår köprekommendation kvar (köp ett återtest under 1191). Ny statistik visar att guldköpandet från centralbanker ökade avsevärt under andra halvan av 2015.
TREND
- Prisuppgången är fortfarande pausad och vi förväntar oss konsolidering innan det är dags för nästa uppgångsfas.
- Guldbalansen (utbud & efterfrågan) var i det närmaste i balans under 2015.
- Med noll – minusräntor i många länder så är kostnaden att hålla guld försumbar vilket ökar attraktionskraften.
- Positioneringen i futuresmarknaden visas att marknadsaktörerna fortsätter att minska korta och öka långa positioner. Nettopositioneringen (ökande lång) visar på ett ökande positivt sentiment.
- Kinesisk inflation på uppgång? Kinesiska matpriser steg 4.1% i januari, den största uppgången på flera år.
- Hotet mot vår positiva vy på guldet kommer i första hand ifrån en (allt för) snabbt stigande dollar.
- Vårt medelsiktiga mål ligger i 1300/1350 intervallet.
REKOMMENDATION
- BULL GULD X2S vid ett återtest under utbrottet (1191) idealt 1181/82.
KAFFE
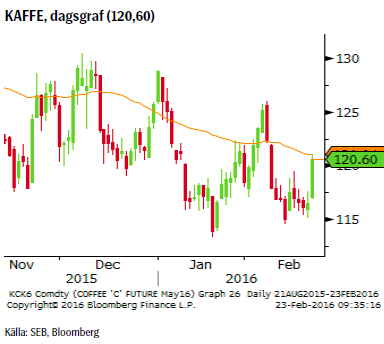 Efter den kraftiga nedgången i början av februari så har marknaden de senaste tio handelsdagarna tagit tillbaka en del av prisfallet. Vi ser dock uppgången som temporär och förväntar oss snart att priserna fortsätter den underliggande nedgången mot nya bottnar.
TREND
- Måndagens kraftiga uppgång är troligtvis resultatet av urstoppningar då marknaden nyligen, enligt den senaste Commitment of Traders-rapporten, kraftigt ökat sin korta position. Dessa säljare bör under gårdagen i allt högre grad hamnat med negativt resultat.
- Så länge inte priset går över 125,95 (och därmed bryter mönstret av fallande toppar) så betraktar vi innevarande uppgång som temporär.
- Vietnamn varnar för att torrt väder kan slå mot Robustaskörden i år.
- Å andra sidan flaggar man i Brasilien att Arabica-skörden 2016 kan slå sitt tidigare rekord.
REKOMMENDATION
- BEAR KAFFE X4 S rörelsen över 118,88 gör att vi tar vår Mats ur skolan och inväntar nytt säljläge.
AKTUELLA REKOMMENDATIONER
[box]SEB Veckobrev Veckans råvarukommentar är producerat av SEB:s Commodities Sales desk och publiceras i samarbete och med tillstånd på Råvarumarknaden.se[/box]
KÄLLOR
Bloomberg, Reuters, SEB
VILLKOR
För varje enskilt certifikat/mini future finns Slutliga Villkor som anger de fullständiga villkoren. Slutliga Villkor finns tillgängligt på kurssidan för respektive certifikat/mini future på www.seb.se, Börs & finans, fliken Strukturerade placeringar.
RISKER
En sammanfattning av de risker som är förknippade med Börshandlade certifikat generellt finns i Produktbroschyren för respektive certifikat eller mini future som är tillgängligt på seb.se/cert respektive seb.se/mini. För en fullständig bild av riskerna behöver du ta del av SEB:s offentliggjorda Grundprospekt för Certifikat- och Warrantprogram som är publicerat på www.seb.se/cert respektive seb.se/mini.
DISCLAIMER
Detta marknadsföringsmaterial, framtaget av SEB:s Commodities Sales desk, har upprättats enbart i informationssyfte.
Även om innehållet är baserat på källor som SEB bedömt som tillförlitliga ansvarar SEB inte för fel eller brister i informationen. Den utgör inte oberoende, objektiv investeringsanalys och skyddas därför inte av de bestämmelser som SEB har infört för att förebygga potentiella intressekonflikter. Yttranden från SEB:s Commodities Sales desk kan vara oförenliga med tidigare publicerat material från SEB, då den senare hänvisas uppmanas du att läsa den fullständiga rapporten innan någon åtgärd vidtas.
Dokumentationen utgör inte någon investeringsrådgivning och tillhandahålls till dig utan hänsyn till dina investeringsmål. Du uppmanas att självständigt bedöma och komplettera uppgifterna i denna dokumentation och att basera dina investeringsbeslut på material som bedöms erforderligt. Alla framåtblickande uttalanden, åsikter och förväntningar är föremål för risker, osäkerheter och andra faktorer och kan orsaka att det faktiska resultatet avviker väsentligt från det förväntade. Historisk avkastning är ingen garanti för framtida resultat. Detta dokument utgör inte ett erbjudande att teckna några värdepapper eller andra finansiella instrument. SEB svarar inte för förlust eller skada – direkt eller indirekt, eller av vad slag det vara må – som kan uppkomma till följd av användandet av detta material eller dess innehåll.
Observera att det kan förekomma att SEB, dess ledamöter, dess anställda eller dess moder- och/eller dotterbolag vid olika tillfällen innehar, har innehaft eller kommer att inneha aktier, positioner, rådgivningsuppdrag i samband med corporate finance-transaktioner, investment- eller merchantbanking-uppdrag och/eller lån i de bolag/finansiella instrument som nämns i materialet.
Materialet är avsett för mottagaren, all spridning, distribuering mångfaldigande eller annan användning av detta meddelande får inte ske utan SEB:s medgivande. Materialet riktar sig inte till personer vars medverkan kräver ytterligare prospekt, registrerings- eller andra åtgärder än vad som följer av svensk rätt. Det åligger var och en att iaktta sådana restriktioner. Materialet får inte distribueras i eller till land där distribution kräver ovan nämnda åtgärder eller strider mot reglering i sådant land. Materialet riktar sig således inte till fysiska eller juridiska personer hemmahörande i USA eller i något annat land där publicering eller tillhandahållande av materialet är förbjudet eller strider mot tillämpliga bestämmelser i landet.
Oaktat detta får SEB tillåta omfördelning av materialet till utvald tredje part i enlighet med gällande avtal. Materialet får inte spridas till fysiska eller juridiska personer som är medborgare eller har hemvist i ett land där sådan spridning är otillåten enligt tillämplig lag eller annan bestämmelse.
Skandinaviska Enskilda Banken AB (publ) är ett publikt aktiebolag och står under tillsyn av Finansinspektionen samt de lokala finansiella tillsynsmyndigheter i varje jurisdiktionen där SEB har filial eller dotterbolag.
Analys
More weakness and lower price levels ahead, but the world won’t drown in oil in 2026

Some rebound but not much. Brent crude rebounded 1.5% yesterday to $65.47/b. This morning it is inching 0.2% up to $65.6/b. The lowest close last week was on Thursday at $64.11/b.

The curve structure is almost as week as it was before the weekend. The rebound we now have gotten post the message from OPEC+ over the weekend is to a large degree a rebound along the curve rather than much strengthening at the front-end of the curve. That part of the curve structure is almost as weak as it was last Thursday.
We are still on a weakening path. The message from OPEC+ over the weekend was we are still on a weakening path with rising supply from the group. It is just not as rapidly weakening as was feared ahead of the weekend when a quota hike of 500 kb/d/mth for November was discussed.
The Brent curve is on its way to full contango with Brent dipping into the $50ies/b. Thus the ongoing weakening we have had in the crude curve since the start of the year, and especially since early June, will continue until the Brent crude oil forward curve is in full contango along with visibly rising US and OECD oil inventories. The front-month Brent contract will then flip down towards the $60/b-line and below into the $50ies/b.
At what point will OPEC+ turn to cuts? The big question then becomes: When will OPEC+ turn around to make some cuts? At what (price) point will they choose to stabilize the market? Because for sure they will. Higher oil inventories, some more shedding of drilling rigs in US shale and Brent into the 50ies somewhere is probably where the group will step in.
There is nothing we have seen from the group so far which indicates that they will close their eyes, let the world drown in oil and the oil price crash to $40/b or below.
The message from OPEC+ is also about balance and stability. The world won’t drown in oil in 2026. The message from the group as far as we manage to interpret it is twofold: 1) Taking back market share which requires a lower price for non-OPEC+ to back off a bit, and 2) Oil market stability and balance. It is not just about 1. Thus fretting about how we are all going to drown in oil in 2026 is totally off the mark by just focusing on point 1.
When to buy cal 2026? Before Christmas when Brent hits $55/b and before OPEC+ holds its last meeting of the year which is likely to be in early December.
Brent crude oil prices have rebounded a bit along the forward curve. Not much strengthening in the structure of the curve. The front-end backwardation is not much stronger today than on its weakest level so far this year which was on Thursday last week.

The front-end backwardation fell to its weakest level so far this year on Thursday last week. A slight pickup yesterday and today, but still very close to the weakest year to date. More oil from OPEC+ in the coming months and softer demand and rising inventories. We are heading for yet softer levels.

Analys
A sharp weakening at the core of the oil market: The Dubai curve

Down to the lowest since early May. Brent crude has fallen sharply the latest four days. It closed at USD 64.11/b yesterday which is the lowest since early May. It is staging a 1.3% rebound this morning along with gains in both equities and industrial metals with an added touch of support from a softer USD on top.

What stands out the most to us this week is the collapse in the Dubai one to three months time-spread.
Dubai is medium sour crude. OPEC+ is in general medium sour crude production. Asian refineries are predominantly designed to process medium sour crude. So Dubai is the real measure of the balance between OPEC+ holding back or not versus Asian oil demand for consumption and stock building.
A sharp weakening of the front-end of the Dubai curve. The front-end of the Dubai crude curve has been holding out very solidly throughout this summer while the front-end of the Brent and WTI curves have been steadily softening. But the strength in the Dubai curve in our view was carrying the crude oil market in general. A source of strength in the crude oil market. The core of the strength.
The now finally sharp decline of the front-end of the Dubai crude curve is thus a strong shift. Weakness in the Dubai crude marker is weakness in the core of the oil market. The core which has helped to hold the oil market elevated.
Facts supports the weakening. Add in facts of Iraq lifting production from Kurdistan through Turkey. Saudi Arabia lifting production to 10 mb/d in September (normal production level) and lifting exports as well as domestic demand for oil for power for air con is fading along with summer heat. Add also in counter seasonal rise in US crude and product stocks last week. US oil stocks usually decline by 1.3 mb/week this time of year. Last week they instead rose 6.4 mb/week (+7.2 mb if including SPR). Total US commercial oil stocks are now only 2.1 mb below the 2015-19 seasonal average. US oil stocks normally decline from now to Christmas. If they instead continue to rise, then it will be strongly counter seasonal rise and will create a very strong bearish pressure on oil prices.
Will OPEC+ lift its voluntary quotas by zero, 137 kb/d, 500 kb/d or 1.5 mb/d? On Sunday of course OPEC+ will decide on how much to unwind of the remaining 1.5 mb/d of voluntary quotas for November. Will it be 137 kb/d yet again as for October? Will it be 500 kb/d as was talked about earlier this week? Or will it be a full unwind in one go of 1.5 mb/d? We think most likely now it will be at least 500 kb/d and possibly a full unwind. We discussed this in a not earlier this week: ”500 kb/d of voluntary quotas in October. But a full unwind of 1.5 mb/d”
The strength in the front-end of the Dubai curve held out through summer while Brent and WTI curve structures weakened steadily. That core strength helped to keep flat crude oil prices elevated close to the 70-line. Now also the Dubai curve has given in.

Brent crude oil forward curves

Total US commercial stocks now close to normal. Counter seasonal rise last week. Rest of year?

Total US crude and product stocks on a steady trend higher.

Analys
OPEC+ will likely unwind 500 kb/d of voluntary quotas in October. But a full unwind of 1.5 mb/d in one go could be in the cards

Down to mid-60ies as Iraq lifts production while Saudi may be tired of voluntary cut frugality. The Brent December contract dropped 1.6% yesterday to USD 66.03/b. This morning it is down another 0.3% to USD 65.8/b. The drop in the price came on the back of the combined news that Iraq has resumed 190 kb/d of production in Kurdistan with exports through Turkey while OPEC+ delegates send signals that the group will unwind the remaining 1.65 mb/d (less the 137 kb/d in October) of voluntary cuts at a pace of 500 kb/d per month pace.

Signals of accelerated unwind and Iraqi increase may be connected. Russia, Kazakhstan and Iraq were main offenders versus the voluntary quotas they had agreed to follow. Russia had a production ’debt’ (cumulative overproduction versus quota) of close to 90 mb in March this year while Kazakhstan had a ’debt’ of about 60 mb and the same for Iraq. This apparently made Saudi Arabia angry this spring. Why should Saudi Arabia hold back if the other voluntary cutters were just freeriding? Thus the sudden rapid unwinding of voluntary cuts. That is at least one angle of explanations for the accelerated unwinding.
If the offenders with production debts then refrained from lifting production as the voluntary cuts were rapidly unwinded, then they could ’pay back’ their ’debts’ as they would under-produce versus the new and steadily higher quotas.
Forget about Kazakhstan. Its production was just too far above the quotas with no hope that the country would hold back production due to cross-ownership of oil assets by international oil companies. But Russia and Iraq should be able to do it.
Iraqi cumulative overproduction versus quotas could reach 85-90 mb in October. Iraq has however steadily continued to overproduce by 3-5 mb per month. In July its new and gradually higher quota came close to equal with a cumulative overproduction of only 0.6 mb that month. In August again however its production had an overshoot of 100 kb/d or 3.1 mb for the month. Its cumulative production debt had then risen to close to 80 mb. We don’t know for September yet. But looking at October we now know that its production will likely average close to 4.5 mb/d due to the revival of 190 kb/d of production in Kurdistan. Its quota however will only be 4.24 mb/d. Its overproduction in October will thus likely be around 250 kb/d above its quota with its production debt rising another 7-8 mb to a total of close to 90 mb.
Again, why should Saudi Arabia be frugal while Iraq is freeriding. Better to get rid of the voluntary quotas as quickly as possible and then start all over with clean sheets.
Unwinding the remaining 1.513 mb/d in one go in October? If OPEC+ unwinds the remaining 1.513 mb/d of voluntary cuts in one big go in October, then Iraq’s quota will be around 4.4 mb/d for October versus its likely production of close to 4.5 mb/d for the coming month..
OPEC+ should thus unwind the remaining 1.513 mb/d (1.65 – 0.137 mb/d) in one go for October in order for the quota of Iraq to be able to keep track with Iraq’s actual production increase.
October 5 will show how it plays out. But a quota unwind of at least 500 kb/d for Oct seems likely. An overall increase of at least 500 kb/d in the voluntary quota for October looks likely. But it could be the whole 1.513 mb/d in one go. If the increase in the quota is ’only’ 500 kb/d then Iraqi cumulative production will still rise by 5.7 mb to a total of 85 mb in October.
Iraqi production debt versus quotas will likely rise by 5.7 mb in October if OPEC+ only lifts the overall quota by 500 kb/d in October. Here assuming historical production debt did not rise in September. That Iraq lifts its production by 190 kb/d in October to 4.47 mb/d (August level + 190 kb/d) and that OPEC+ unwinds 500 kb/d of the remining quotas in October when they decide on this on 5 October.

-

 Nyheter4 veckor sedan
Kinas elproduktion slog nytt rekord i augusti, vilket även kolkraft gjorde
-

 Nyheter4 veckor sedan
Tyskland har så höga elpriser att företag inte har råd att använda elektricitet
-

 Nyheter3 veckor sedan
OPEC+ missar produktionsmål, stöder oljepriserna
-

 Nyheter3 veckor sedan
Ett samtal om guld, olja, fjärrvärme och förnybar energi
-

 Analys4 veckor sedan
Brent crude ticks higher on tension, but market structure stays soft
-

 Analys3 veckor sedan
Are Ukraine’s attacks on Russian energy infrastructure working?
-

 Nyheter2 veckor sedan
Guld nära 4000 USD och silver 50 USD, därför kan de fortsätta stiga
-

 Nyheter3 veckor sedan
Guldpriset uppe på nya höjder, nu 3750 USD


