

Analys
SEB Råvarubrev 20 september 2016

Centralbanker (Bank of Japan & FED) i fokus.
 MARKNADEN I KORTHET
Marknadsoron mätt som Fed’s finansiella stressindex har sedan förra veckan ökat något men ligger fortfarande långt ifrån oroande nivåer. Börsnedgångarna har mer övergått till att intervallhandel, ena dagen upp och andra dagen ned. Obligationsräntorna har dock inte backat många punkter ifrån förra veckans topp vilket vi finner vara ett rätt intressant beteende. Vi kan förvänta oss ett lugn fram tills imorgon (och en ökad volatilitet därefter) när både Bank of Japan och Federal Reserve kommer med sina räntebesked. BoJ förväntas att antagligen utöka köp av ETF, REIT e. dyl. det är dock mer tveksamt om man utökar obligationsköpen då det i nuvarande inköpstakt inte kommer att finnas några statsobligationer kvar på marknaden om cirka tre år. FED förväntas inte göra någonting denna gång heller.
Råvaror: Oljan har tappat något sedan förra veckan men följer i princip det meandrande mönster vi förväntat oss inför det informella OPEC–mötet i Alger den 26-28 sept. Nymex-olja ser ytterligare något svagare ut och vi skulle inte vara helt förvånade att se den ned mot $40/Bbl området (i skrivande stund ligger den på $43). Basmetallerna har alla rört sig något uppåt under senaste veckan med huvudfokus på nickel och den miljörevisionsrapport från Filippinerna som förväntas komma inom kort (gruvstängningar?). Ädelmetaller fortsätter att konsolidera medan jordbruksprodukter som majs och vete har stigit dock från väldigt låga nivåer. Dags för potatisrallyt (botten i juni – toppen i sept. = 62 %) att ta en paus? Förra veckans prisutveckling indikerar att så är fallet. Socker har brutit upp ur sin senaste konsolidering och nått fyra års högsta efter indikationer om ytterligare ökat underskott för nästa år. Vi är lite tveksamma till hållbarheten i detta det senaste rallyt.
Valuta: Dollarn har stärkt på sig sedan förra veckan men lär nu ta en paus till onsdag kväll när FOMC kommer med sitt räntebesked. SEK fortsätter att handla på den svaga sidan (budgeten idag lär inte heller innehålla någon kioskvältare) och förra veckans bubblare, JPY/SEK har nu brutit upp ur sin positiva triangel. NOK/SEK fortsätter också att steg för steg ta sig norrut.
Börser: MSCI världsindex har ännu inte handlats upp till en ny rekordnivå vilket indikerar att innevarande svaghet är temporär. Förra veckans negativa prisutveckling indikerar dock att mer nedgång bör vara att vänta i närtid. MSCI tillväxtmarknadsindex visar också en viss svaghet men lämnade dock ingen veckosignal såsom världsindexet gjorde.
Räntor: Den tyska 10-åringen vände i onsdags åter ned och handlades under fredagen igen till negativ ränta (så länge räntan ligger kvar över -0,13 % finns dock möjligheten till ett nytt försök högre kvar). Amerikanska långräntor (10 & 30år) har dock ett något mer konstruktivt mönster vilket talar för ytterligare uppgång.
OBSERVATIONER I SAMMANDRAG
- Oljepriset handlas nedåt men dock fortfarande i det förväntade intervallet.
- Nickelpriset rycker inför miljöbesked från Filippinerna.
- Guld och silver fortsätter sannolikt att konsolidera.
- USD/SEK fortsätter trycka på för att lämna konsolideringsintervallet.
- Har majs (US) fått fast mark under fötterna?
- OMXS30 nedgången har än så länge utvecklats som en korrektion.
En placering i certifikat och warranter är förknippat med risker. Du kan förlora hela ditt investerade kapital. Läs mer om riskerna i SEB:s offentliggjorda Grundprospekt för certifikat- och warrantprogram på seb.se/cert eller seb.se/mini
OLJA BRENT
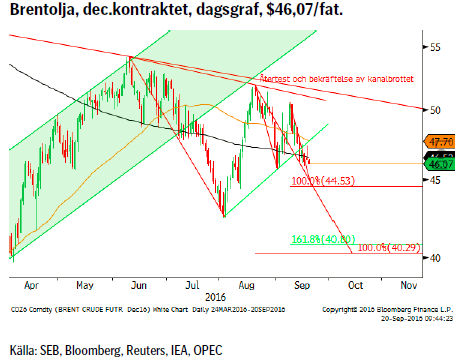 Marknaden befinner sig fortfarande i det kontrakterande intervall som vi förutspått ska hålla sig fram tills det informella OPEC-mötet i Alger den 26-28 september. Dock har prisbilden försvagats något i och med fallet ned under $47,00. Förra veckans rapport från EIA visade att antalet borrade men inte igångsatta källor (s.k. DUC’s, (drilled but uncompleted)) fortfarande är många och trots en viss nedgång det senaste halvåret ligger balansen på en historiskt hög nivå. Detta är källor som snabbt kan komma igång om priset skulle stiga.
Konklusion: Sammantaget är utsikterna denna vecka något mer negativa än föregående vecka.
OBSERVATIONER
+ Spekulationer om ett produktionstak vid Algermötet.
+ Libysk export som förväntades komma igång i närtid lär återförsenas efter de senaste incidenterna mellan olika intressesfärer.
+ Situationen i Venezuela fortsätter att förvärras.
+ Iransk produktion verkar ha nått en platå.
+ US naturgas är fortsatt i stark efterfrågan.
– Fortsatt överutbud.
– Iransk export (inte produktion) på 5-års högsta.
– Saudisk produktion på rekordnivå (men bör säsongsmässigt snart börja minska då behovet av luftkonditionering avtar).
– Irakisk export förväntas öka ytterligare.
– Antalet amerikanska borriggar fortsätter att öka (och antalet borrade men ej igångsatta källor, DUC’s (drilled but uncompleted wells) på fortsatt hög nivå).
– Nigeriansk gerilla (Delta Avengers) har infört vapenvila.
– Lagren är fortsatt mycket stora (över 5-års snitt) men har de senaste veckorna fallit något.
– Det historiska säsongsmönstret talar för att en pristopp har satts under sommaren.
– Tekniskt så blir bilden än svagare om $45,70 bryts (vilket torde öppna upp för 44,53 som nästa stöd).
Tillgängliga certifikat:
BULL OLJA X1, X2 ,X4, X5, & X10 S
BEAR OLJA X1, X2, X4, X5 & X10 S
NICKEL LME 3M
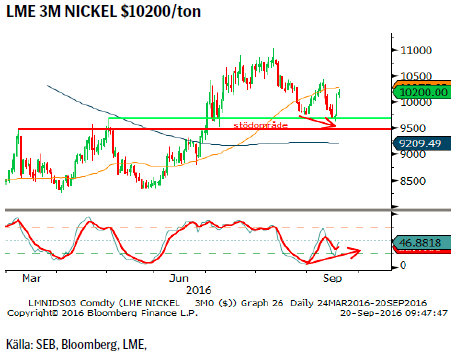 Till skillnad mot aluminium, koppar och nu även zink ser den kortsiktiga situationen för nickel bättre ut. Risken för produktionsstörningar/stopp i framför allt Filippinerna har fått priserna att stiga den senaste veckan. Den nya, sedan i våras, presidenten/regeringen har satt gruvsektorn och framför allt dagbrott under en betydligt hårdare miljöprövning och senare under veckan förväntas beslut om huruvida ytterligare produktion kommer att tvingas stänga tills strängare miljövillkor är uppfyllda.
Konklusion: Avklarad korrektion? Gruvstängningar pga. miljökrav?
OBSERVATIONER
+ Fortsatt positiv vy på medellång – lång sikt så länge inte $9700/9480 passeras.
+ Filippinska hot om nickelgruvestängningar efter den miljörevision som förväntas offentliggöras senare denna vecka.
+ Enligt källor kan så mycket som upp till 8 % av världsproduktionen komma att beröras.
+ Ökad produktion men också ökad efterfrågan på rostfritt stål i Kina.
+ Tekniskt så föreligger ett misslyckat försök ned i stödområdet samt en möjlig positiv divergens (lägre botten i pris/högre botten i stochastic-indikatorn).
– Minskad kinesisk NPI (nickel pi giron) produktion (men också ökade lager av malm vilket gör att produktionen åter kan öka utan att pressa upp efterfrågan på malm).
– Lagren av raffinerat nickel var i augusti 252,000t att jämföra med 130,000t i augusti 2015.
– Falcondogruvan i Dominikanska republiken verkar enligt källor ha smugit igång igen efter Glencore sålde denna för några år sedan.
– En viss överproduktion kvarstår och förväntas öka något under både 2017 och 2018.
– LME lagren har ökat under sommaren (minskat marginellt på slutet).
Tillgängliga certifikat:
BULL NICKEL X1, X2, & X4 S
BEAR NICKEL X2 & X4
GULD
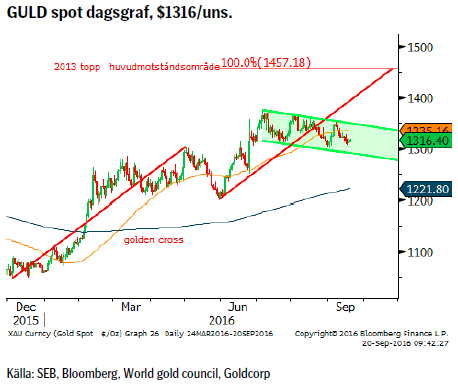 Guldet som förra veckan försökte men förvägrades kliva över den övre barriären i den möjliga ”tjurflaggan” avslutade veckan nära lägstanivån. Efter ett misslyckat försök på uppsidan är det vanligt att fokus svänger till den lägre barriären dvs. i detta fall ett test ned mot $1300 nivån.
Konklusion: Fortsatt i konsolideringsfas men håll koll på BoJ & FOMC/FED på onsdag.
OBSERVATIONER
+ ETF-flödena var förra veckan blandade med utflöden ur guldfonder men inflöden i mindre guldgruvefonder.
+ Efterfrågan från världens 1,6miljarder muslimer kan komma att öka dramatiskt när en Sharia-standard för guld förväntas komma på plats under hösten.
+ FED’s obeslutsamhet avseende nästa räntehöjning.
+ Eventuella nya penningpolitiska stimulanser från ECB och Bank of Japan (BoJ ger besked på onsdag denna vecka).
+ Fallande guldproduktion (produktionen toppade 2015?).
+ Statsobligationer till ett värde av mer än $11 biljoner handlas nu till negativ ränta (och större delen av alla mellan 0 – 1 %).
+ Det viktiga motståndsområdet i $1400-området har ännu inte utmanats.
+ Tekniskt så kvarstår förutsättningarna för en så kallad ”tjurflagga”.
– Fortsatt positiva signaler för en starkare dollar.
– En minskning av nettolånga (långa positioner minskade med 18599 och korta ökade med 3848) spekulativa positionen som dock fortsatt är historiskt stor.
– Centralbankerna har sedan i våras successivt minskat sina inköp månad för månad.
– Rekylfasen i den negativa guld/silver-trenden ser nu att ha avslutats vilket riskerar att påverka guldpriset negativ (åtminstone relativt silver).
– Mycket tunga motstånd i $1400-området riskerar tynga.
– Tekniskt kvarstår risken för en djupare rekyl så länge inte priset klättrar upp över $1368.
Tillgängliga certifikat:
BULL GULD X1, X2, 4, 5 & 10 S
BEAR GULD X2, X4, X5 & X10 S
USD/SEK
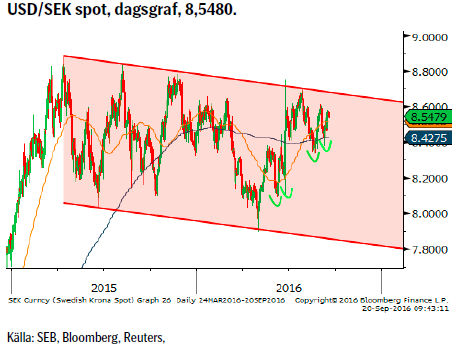 Dollarn fortsatte, efter den senaste högre botten, att förstärkas förra veckan (fredagen avslutades starkt efter högre än förväntad KPI från USA). Avseende innevarande vecka så står, FOMC mötet med åtföljande räntebesked på onsdag kväll kl. 20.00, i fokus. Sannolikheten för en höjning är enligt marknadens prissättning dock låg (en överraskande höjning skulle å andra sidan fånga marknaden ”felpositionerad” med en kraftigt stigande dollar som följd).
Konklusion: Fullt fokus på räntebeskedet från USA på onsdag kväll.
OBSERVATIONER
+ Räntedifferensen mellan USA och Sverige bör fortsätta att öka.
+ Högre amerikansk KPI (2015 ser också ut att ha givit de största löneökningarna i USA på många år).
+ Svensk ekonomi har börjat sakta in.
+ Dollarcykeln (sedan 1970-talet) pekar på en ny topp under 2017.
+ Positiv ränta i USA attraherar inflöden.
+ Den spekulativa långa nettopositioneringen i $-index är bara en fjärdedel av vad den var i början på året. Denna ökade dock ytterst marginellt under den senaste rapporteringsperioden.
+ JPY/SEK har brutit upp ur sin konsolidering och även EUR/SEK ser ut att vara på gång så kronförsvagningen kan komma att ge hävstång till ett brott av USD/SEK.
+ Tekniskt så är konsolideringen ett fortsättningsmönster talandes för en fortsättning av den tidigare uppåttrenden.
– Att FED gång efter annan har skjutit upp räntehöjningarna.
– FED vill inte ha en allt för stark dollar.
– Osäkerhet om presidentvalet.
– Den starka dollarn är en klar motvind för amerikanska exportföretag samt att den ger en deflationsimpuls som i sin tur gör FED än mer obeslutsam.
Tillgängliga certifikat:
BULL USDSEK X1 & X4 S
BEAR USDSEK X4 S
MAJS
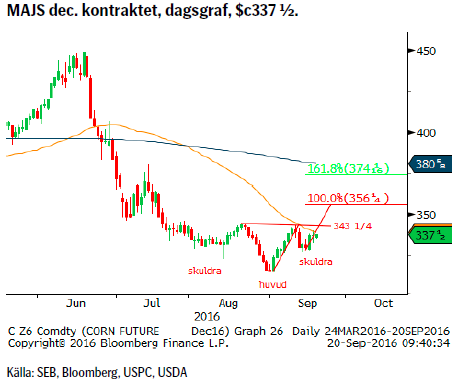 Är det värsta nu över efter det mycket kraftiga prisfallet sedan toppen i juni (som mest ned med 30 %)? Ja i alla fall i det kortare perspektivet så pekar flera faktorer mot att så kan vara fallet. Den spekulativa positionen, som var mycket stor, har förvänts i en lite nettokort position. Produktionen för innevarande år skrivs på flera ställen ned (även om lagren är fortsatt mycket stora). USA har även stämt Kina inför WTO pga. vad man anser vara otillbörliga subsidier till kinesiska bönder (vilket anses ha ökat kinesisk produktion och skadat amerikansk export).
Konklusion: En möjlig botten kan ha satts på plats.
OBSERVATIONER
+ Spekulationer om en något lägre avkastning per hektar än vad den amerikanska jordbruksmyndigheten räknat med.
+ Den senaste WASDE rapporten pekade på lägre produktion, lägre lager och högre priser.
+ Stark amerikansk export bör krympa de stora lagren (som dock är de största sedan det sena 1980-talet).
+ Brasiliansk safrinha (andra)-skörden blev en besvikelse (den senaste revideringen i september kapade bort ytterligare 1,47m ton jämfört med augustiprognosen).
+ Kinesisk produktion skrivs ned pga. torrare förhållanden.
+ Efter att ha varit påfallande långa under framför allt juni så har den spekulativa långa nettopositionen sedan dess, i takt med att priset fallit, helt eliminerats (och vänts till en mindre kort netto position).
+ Tekniskt kan en s.k. inverterad huvud/skuldra-botten formation vara i görningen.
– Än så länge goda planteringsförutsättningar i södra Brasilien för första-sådden för 2016/17.
– Fortsatta rekordlager i framför allt USA.
– Gynnsamma priser i lokal valuta (BRL) indikerar en ökad förstamajssådd på bekostnad av sojabönor.
– Tekniskt negativt om 326 ¾ passeras på nedsidan.
Tillgängliga certifikat:
BULL MAJS X1 & X4 S
BEAR MAJS X1 & X4 S
OMXS30 (RENT TEKNISK UTBLICK)
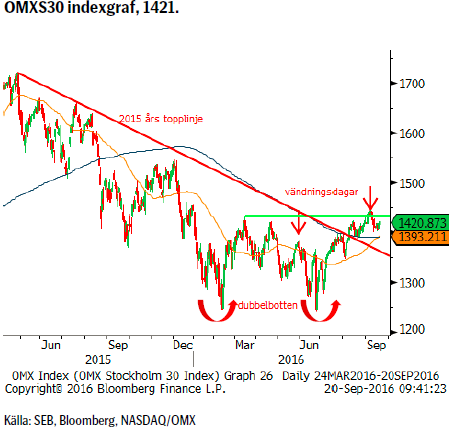 Den negativa vändningsdagen den sjätte september har än så länge levererat förväntat resultat dvs. fallande priser. Nedgången har dock skett under ordnade former vilket indikerar att denna är av korrektiv art. Det är dock ännu för tidigt att blåsa faran över och ett test ned i 1397 – 1370 området är fortfarande en realitet.
Konklusion: För att bibehålla en medelsiktigt positiv vy så bör området mellan 1397 – 1370 attrahera förnyat köpande (än så länge har inte stödområdet testats).
OBSERVATIONER
+ Priset ligger över både 55 och 233d mv.
+ Priset har brutit över rekyltoppen från mars, 1432 och därigenom brutit mönstret av fallande toppar.
+ 55d mv har en positiv lutning.
+ 55d mv är på väg att korsa 233d mv = ett troligt gyllene kors.
+ Långsiktig dubbelbotten vid 1240/46 stödet.
– Starka motstånd vid 1483.
– Kortsiktigare indikatorer har vänt till sälj.
– Befinner sig i korrektion efter den negativa vändningsdagen 6 september.
Tillgängliga certifikat:
BULL OMX X5 S
BEAR OMX X5 S
INFORMATION OM REKOMMENDATIONER
Denna publikation är ett marknadsföringsmaterial för SEBs certifikat-produkter. I och med den nya Marknadsmissbruksförordningen vilken trädde i kraft den tredje juli 2016 har vi inte längre möjlighet att inkludera investeringsrekommendationer rörande certifikat-produkterna.
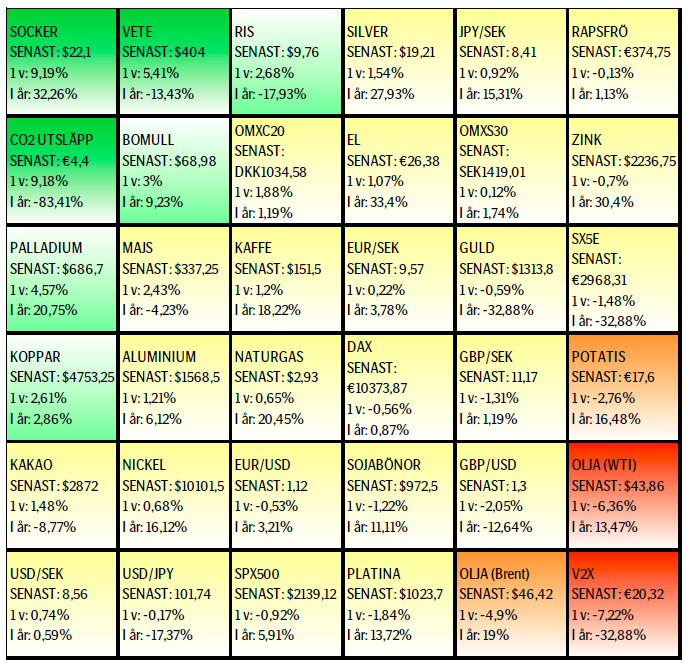
UTVECKLING SENASTE VECKAN SAMT SEDAN ÅRETS BÖRJAN
[box]SEB Veckobrev Veckans råvarukommentar är producerat av SEB:s Commodities Sales desk och publiceras i samarbete och med tillstånd på Råvarumarknaden.se[/box]
KÄLLOR
Bloomberg, Reuters, SEB
VILLKOR
För varje enskilt certifikat/mini future finns Slutliga Villkor som anger de fullständiga villkoren. Slutliga Villkor finns tillgängligt på kurssidan för respektive certifikat/mini future på www.seb.se, Börs & finans, fliken Strukturerade placeringar.
RISKER
En sammanfattning av de risker som är förknippade med Börshandlade certifikat generellt finns i Produktbroschyren för respektive certifikat eller mini future som är tillgängligt på seb.se/cert respektive seb.se/mini. För en fullständig bild av riskerna behöver du ta del av SEB:s offentliggjorda Grundprospekt för Certifikat- och Warrantprogram som är publicerat på www.seb.se/cert respektive seb.se/mini.
DISCLAIMER
Detta marknadsföringsmaterial, framtaget av SEB:s Commodities Sales desk, har upprättats enbart i informationssyfte.
Även om innehållet är baserat på källor som SEB bedömt som tillförlitliga ansvarar SEB inte för fel eller brister i informationen. Den utgör inte oberoende, objektiv investeringsanalys och skyddas därför inte av de bestämmelser som SEB har infört för att förebygga potentiella intressekonflikter. Yttranden från SEB:s Commodities Sales desk kan vara oförenliga med tidigare publicerat material från SEB, då den senare hänvisas uppmanas du att läsa den fullständiga rapporten innan någon åtgärd vidtas.
Dokumentationen utgör inte någon investeringsrådgivning och tillhandahålls till dig utan hänsyn till dina investeringsmål. Du uppmanas att självständigt bedöma och komplettera uppgifterna i denna dokumentation och att basera dina investeringsbeslut på material som bedöms erforderligt. Alla framåtblickande uttalanden, åsikter och förväntningar är föremål för risker, osäkerheter och andra faktorer och kan orsaka att det faktiska resultatet avviker väsentligt från det förväntade. Historisk avkastning är ingen garanti för framtida resultat. Detta dokument utgör inte ett erbjudande att teckna några värdepapper eller andra finansiella instrument. SEB svarar inte för förlust eller skada – direkt eller indirekt, eller av vad slag det vara må – som kan uppkomma till följd av användandet av detta material eller dess innehåll.
Observera att det kan förekomma att SEB, dess ledamöter, dess anställda eller dess moder- och/eller dotterbolag vid olika tillfällen innehar, har innehaft eller kommer att inneha aktier, positioner, rådgivningsuppdrag i samband med corporate finance-transaktioner, investment- eller merchantbanking-uppdrag och/eller lån i de bolag/finansiella instrument som nämns i materialet.
Materialet är avsett för mottagaren, all spridning, distribuering mångfaldigande eller annan användning av detta meddelande får inte ske utan SEB:s medgivande. Materialet riktar sig inte till personer vars medverkan kräver ytterligare prospekt, registrerings- eller andra åtgärder än vad som följer av svensk rätt. Det åligger var och en att iaktta sådana restriktioner. Materialet får inte distribueras i eller till land där distribution kräver ovan nämnda åtgärder eller strider mot reglering i sådant land. Materialet riktar sig således inte till fysiska eller juridiska personer hemmahörande i USA eller i något annat land där publicering eller tillhandahållande av materialet är förbjudet eller strider mot tillämpliga bestämmelser i landet.
Oaktat detta får SEB tillåta omfördelning av materialet till utvald tredje part i enlighet med gällande avtal. Materialet får inte spridas till fysiska eller juridiska personer som är medborgare eller har hemvist i ett land där sådan spridning är otillåten enligt tillämplig lag eller annan bestämmelse.
Skandinaviska Enskilda Banken AB (publ) är ett publikt aktiebolag och står under tillsyn av Finansinspektionen samt de lokala finansiella tillsynsmyndigheter i varje jurisdiktionen där SEB har filial eller dotterbolag.
Market is starting to take US/Iran headlines with a pinch of salt. Brent crude rose $2.8/b yesterday to an official close of $112.1/b. But after that it traded as low as $108.05/b before ending late night at around $109.7/b. Through the day it traded in a range of $106.87 – 112.72/b amid a flurry of news or rumors from Iran and the US. ”US temporary sanctions during negotiations” (falls alarm). ”We will bomb Iran” (not anyhow),… etc. While the market is still fluctuating to this kind of news flow, it is starting to take such headlines with a pinch of salt.

We’ll see. Maybe, maybe not. The Brent M1 contract is trading at $110.2/b this morning which very close to the average ticks through yesterday of $110.4/b.
Trump with bearish, verbal intervention whenever Brent trades above $110/b it seems. What seems to be a pattern is that Trump states something like ”very good negotiations going on with Iran”, ”New leaders in Iran are great,..”, ”Great progress in negotiations,…”, ”Deal in sight,..” etc whenever the Brent M1 contract trades above $110/b. An effort to cool the market. These hot air verbal interventions from Trump used to have a heavy bearish impact on prices, but they now seems to have less and less effect unless they are backed by reality.
As far as we can see there has been no real progress in the negotiations between the US and Iran with both sides still standing by their previous demands.
Iran is getting stronger while the cease fire lasts making a return to war for Trump yet harder. Iran is naturally in constant preparation for a return to war given Trump’s steady threats of bombing Iran again. Iran is naturally doing what ever is possible to prepare for a return to war. And every day the cease fire lasts it is better prepared. This naturally makes it more and more difficult and dangerous for the US to return to warring activity versus Iran as the consequences for energy infrastructure in the Persian Gulf will be more and more severe the longer the cease fire lasts. Israel seems to see it this way as well. That the war is not won and that current frozen state of a cease fire gives Iran opportunity to rebuild military and politically.
Global inventories are drawing down day by day. How much? In the meantime the Strait of Hormuz stays closed. There is varying measures and estimates of how much global inventories are drawing down. Our rough estimate, back of the envelope, is that global inventories are drawing down by at least some 10 mb/d or about 300 mb/d in a balance between loss of supply versus demand destruction. Other estimates we see are a monthly draw of 250-270 mb/d. The IEA only ’measured’ a draw in global observable stocks of 117 mb in April with oil on water rising 53 mb while on shore stocks fell 170 mb. But global stocks are hard to measure with large invisible, unmeasured stocks. As such a back of the envelope approach may be better.
Oil products is what the world is consuming. Oil product prices likely to rise while product stocks fall. Strategic Petroleum Reserves (SPR) are predominantly crude oil. Discharging oil from OECD SPR stocks, a sharp reduction in Chinese crude imports and a reduction in global refinery throughput of 6-7 mb/d has helped to keep crude oil markets satisfactorily supplied. But global inventories are drawing down none the less. And oil products is really what the world is consuming. So if global refinery throughput stays subdued, then demand will eventually have to match the supply of oil products. The likely path forward this summer is a steady draw down in jet fuel, diesel and gasoline. Higher prices for these. Then, if possible, higher refinery throughput and higher usage of crude in response to very profitable refinery margins. And lastly sharper draw in crude stocks and higher prices for these. But some 6 mb/d of oil products used to be exported through the Strait of Hormuz. And it may not be so easy to ramp up refinery activity across the world to compensate. Especially as Ukraine continues to damage Russian refineries as well as Russian crude production and export facilities.
Watch oil product stocks and prices as well as Brent calendar 2027. What to watch for this summer is thus oil product inventories falling and oil product premiums to crude rising. Another measure to watch is the Brent crude 2027 contract as it rises steadily day by day as the Strait of Hormuz stays closed and global oil inventories decline. The latter is close to the highest level since the start of the war and keeps rising.
The Brent M1 contract and the Brent 2027 prices and current price of jet fuel in Europe (ARA). All in USD/b

Our back of the envelope calculation of the global shortage created by the closure of the Strait of Hormuz. Note that 3.5 mb/d of discharge from SPR is also a draw. Note also that ’Forced demand loss’ of 2.5 mb/d is probably temporary and will fall back towards zero as logistics are sorted out leaving ’Price demand loss’ to do the job of balancing the market. Thus a shortfall of at least 9 mb/d created by the closure. More if SPR discharge is included and more if Forced demand loss recedes.

Brent is climbing higher. Front-month is at USD 106.3/bl this morning, close to a weekly high and a USD 9/bl jump from Mondays open. This is the move we flagged as a risk earlier in the week: the market shifting from ”a deal is around the corner” to ”this is going to take longer than we thought”.

Analyst Commodities, SEB
During April, rest-of-year Brent remained remarkably stable around USD 90/bl. A stability which rested on one single assumption: the SoH reopens around 1 May. That assumption is now slowly falling apart.
As we highlighted yesterday: every week of delay beyond 1 May adds (theoretically) ish USD 5/bl to the rest-of-year average, as global inventories draw 100 million barrels per week. i.e., a mid-May reopening implies rest-of-year Brent closer to USD 100/bl, and anything pushing into June or July takes us meaningfully higher.
What’s changed in the last 48 hours:
#1: The US military has formally warned that clearing suspected sea mines from SoH could take up to six months. That is a completely different timescale from what the financial market is pricing. Even a political deal tomorrow does not immediately reopen the strait.
#2: Trump has shifted his tone from urgency to ”strategic patience”. In yesterday’s press conference: ”Don’t rush me… I want a great deal.” The market is reading this as a president no longer feeling pressured by timelines, with the naval blockade running in the background.
#3: So far, the military activity is escalating, not de-escalating. Axios reports Iran is laying more mines in SoH. The US 3rd carrier strike group (USS George H.W. Bush) is arriving with two countermine vessels. Trump yesterday ordered the US Navy to destroy any Iranian boats caught laying mines. While CNN reports that the Pentagon is actively drawing up plans to strike Iranian SoH capabilities and individual Iranian military leaders if the ceasefire collapses. i.e., NOT a attitude consistent with an imminent deal!
Spot crude and product prices eased off the early-April highs on a combination of system rerouting and deal optimism. Both now weakening. Goldman estimates April Gulf output is reduced by 14.5 mbl/d, or 57% of pre-war supply, a number that keeps getting worse the longer this drags on.
Demand-side adaptation is ongoing: S. Korea has cut its Middle East crude dependence from 69% to 56% by pulling more from the Americas and Africa, and Japan is kicking off a second round of SPR releases from 1 May. But SPRs are finite.
Ref. to the negotiations, we should not bet on speed. The current Iranian leadership is dominated by genuine hardliners willing to absorb economic pain and run the clock to extract concessions. That is not a setup for a rapid resolution. US/Israeli media briefings keep framing the delay as ”internal Iranian divisions”, the reality is more complicated and points toward weeks and months, not days.
Our point is that the complexity is large, and higher prices have only just started (given a scenario where the negotiations drag out in time). The market spent April leaning on the USD 90/bl rest-of-year assumption; that case is diminishing by the hour. If ”early May reopening” is replaced by ”June, July or later” over the next week or two, both crude and products have meaningful room to reprice higher from here. There is a high risk being short energy and betting on any immediate political resolution(!).
Down on Friday. Up on Monday. The Brent June crude oil contract traded down 5.1% last week to a close of $90.38/b. It reached a high of $103.87/b last Monday and a low of $86.09/b on Friday as Iran announced that the Strait of Hormuz was fully open for transit. That quickly changed over the weekend as the US upheld its blockade of Iranian oil exports while Iran naturally responded by closing the SoH again. The US blew a hole in the engine room of the Iranian ship TOUSKA and took custody of the ship on Sunday. Brent crude is up 5.6% this morning to $95.4/b.
The cease-fire is expiring tomorrow. The US has said it will send a delegation for a second round of negotiations in Islamabad in Pakistan. But Iran has for now rejected a second round of talks as it views US demands as unrealistic and excessive while the US is also blocking the Strait of Hormuz.
While Brent is up 5% this morning, the financial market is still very optimistic that progress will be made. That talks will continue and that the SoH will fully open by the start of May which is consistent with a rest-of-year average Brent crude oil price of around $90/b with the market now trading that balance at around $88/b.
Financial optimism vs. physical deterioration. We have a divergence where the financial market is trading negotiations, improvements and resolution while at the same time the physical market is deteriorating day by day. Physical oil flows remain constrained by disrupted flows, longer voyage times and elevated freight and insurance costs.
Financial markets are betting that a US/Iranian resolution will save us in time from violent shortages down the road. But every day that the SoH remains closed is bringing us closer to a potentially very painful point of shortages and much higher prices.
The US blockade is also a weapon of leverage against its European and Asian allies. When Iran closed the SoH it held the world economy as a hostage against the US. The US blockade of the SoH is of course blocking Iranian oil exports. But it is also an action of disruption directed towards Europe and Asia. The US has called for the rest of the world to engaged in the war with Iran: ”If you want oil from the Persian Gulf, then go and get it”. A risk is that the US plays brinkmanship with the global oil market directed towards its European and Asian allies and maybe even towards China to force them to engage and take part. Maybe unthinkable. But unthinkable has become the norm with Trump in the White House.


Sommarväder skapar prisrally på elbörsen
Oil product price pain is set to rise as the Strait of Hormuz stays closed into summer

Solkraften pressar elpriserna dagtid

Michel Gubel ger sin syn på oljemarknaden