

Analys
SEB Råvarubrev 13 september 2016

 Volatilitetens återkomst?
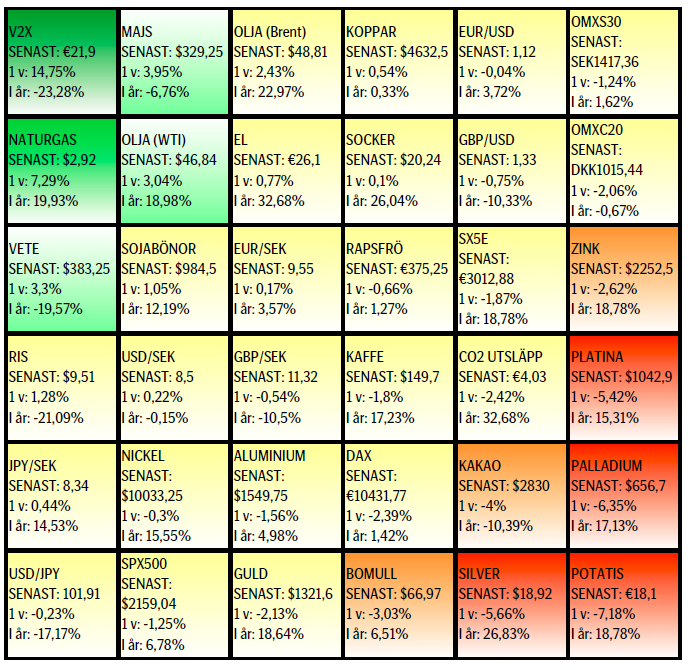
MARKNADEN I KORTHET
Efter en av de längre lugna perioderna i S & P 500 (mätt som 20dagars glidande medelvärde +/- två standardavvikelser) invaggat investerarna i en kanske för trygg förvissning om en fortsatt likartad utveckling bröt kurserna ned på bred front under fredagen. Volatilitetsindexen blev följaktligen förra veckans vinnare. Ytterligare oro, åtminstone på kortare sikt, kan definitivt inte uteslutas. Även råvaror påverkades generellt negativt av det mer negativa sentimentet. Det mest oroande tecknet är att svagheten i aktier och råvaror denna gång inte lett till fallande räntor, tvärtom så har internationella obligationsräntor stigit relativt kraftigt.
Råvaror: Oljan fortsätter som planerat sitt meandrande inför det informella OPEC mötet i Alger senare denna månad. Irans oljeproduktion har planat ut och gjort så på samma nivå man låg på när sanktionerna trädde ikraft vilket gör att man nu bör ställa sig frågan om de nu nått sitt kapacitetstak. Amerikansk naturgas fortsätter att klättra allt högre. Basmetallerna, framför allt aluminium och koppar har fortsatt att handlas ned men har nu även fått sällskap av nickel och, äntligen får vi väl säga, zink. De pressade jordbruksprodukterna, majs, vete och sojabönor har alla stigit den senaste veckan och i fallet vete kan det vara så att vi är på väg att nå en balans. Kaffe fortsatte initialt upp men mötte, precis som i juli, säljare över 155.
Valuta: Dollarkursen fortsätter att i mångt och mycket fladdra upp och ned (inom sitt konsolideringsintervall) följandes utvecklingen av den amerikanska statistiken och därmed sannolikheten för när nästa FED-höjning (mötet i sep, nov eller dec) ska komma. Den svenska kronan förstärktes något förra veckan men det ser ut att vara högst temporärt då både EUR/SEK och USD/SEK (JPY/SEK en bubblare) fortsätter att handla med underliggande press uppåt (högre och högre bottnar). Den kinesiska valutan fortsätter att försvagas vilket möts med interventioner (den kinesiska valutareserven har nu minskat med ~800 miljarder dollar sedan toppnivån 4 biljoner dollar).
Börser: Marknaden har nu börjat ta hand om de ”stretchade” nivåer vi såg förra veckan. De underliggande trenderna ser dock, efter innevarande korrektion, fortsatt hyfsat positiva ut. Allt för snabbt stigande räntor, om detta skulle fortsätta, utgör dock ett mörkt moln.
Räntor: Vår vy om något stigande, framför allt amerikanska obligationsräntor, har infriats snabbare och mer impulsivt än vad vi vågat tro på. Om detta bara är ytterligare en korrektion eller början på något allvarligare är för tidigt att säga men situationen påkallar stor vaksamhet (obligationer är ju det i särklass dyraste tillgångsslaget).
OBSERVATIONER I SAMMANDRAG
- Oljepriset handlas i ett allt snävare intervall inför mötet i Alger.
- Zink ser nu ut att ha påbörjat en välbehövlig korrektion.
- Guld och silver fortsätter sannolikt att konsolidera.
- USD/SEK lade ytterligare en högre botten till samlingarna.
- Kaffe mötte åter säljare vid uppgången över 155.
- OMXS30 nedgången bör så länge topplinjen från 2015 inte bryts anses vara en kortare rekyl.
En placering i certifikat och warranter är förknippat med risker. Du kan förlora hela ditt investerade kapital. Läs mer om riskerna i SEB:s offentliggjorda Grundprospekt för certifikat- och warrantprogram på seb.se/cert eller seb.se/mini
OLJA BRENT
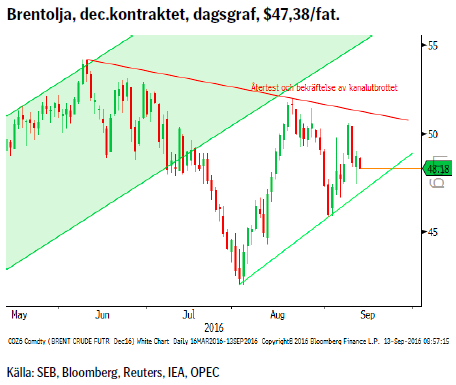 Marknaden fortsätter att uppvisa obeslutsamhet med upp och nedgångar följande på varandra. Mönstret av fallande toppar och stigande bottnar stödjer vår tes att vi bör fortsätta att intervallhandla fram tills mötet i Alger senare denna månad. Iran har nu nått samma nivå på sin produktion som när sanktionerna slog till och produktionsökningen verkar nu också ha planat ut. Målet verkar dock vara satt till ~4 mfpd något som antagligen tar ytterligare några månader att nå. Någon form av ”frysning” verkar i sådana fall vara troligare på nästa ordinarie OPEC möte som hålls den sista november i Wien.
Konklusion: Sammantaget fortsatt stor osäkerhet kring oljepriset men med en viss övervikt för nedsidan på kort sikt.
OBSERVATIONER
+ Spekulationer om ett produktionstak.
+ Nigeriansk produktion störs fortsatt av oroligheterna i Nigerdeltat (militären jagar och stänger illegala raffinaderier).
+ Situationen i Venezuela fortsätter att förvärras.
+ Iransk produktion verkar ha nått en platå.
– Fortsatt överutbud.
– Saudisk produktion på rekordnivå (men bör säsongsmässigt snart börja minska då behovet av luftkonditionering avtar).
– Irakisk export förväntas öka ytterligare.
– Ökad utskeppningskapacitet bör kunna öka Libysk export (men de senaste rapporterna är tyvärr nedslående).
– Förra veckans lagerneddragning berodde på försenade fartygsleveranser pga. storm.
– Antalet amerikanska borriggar fortsätter att öka.
– Nigeriansk gerilla (Delta Avengers) har infört vapenvila.
– Lagren är fortsatt mycket stora ( över 5-års snitt).
– Det historiska säsongsmönstret talar för att en pristopp har satts under sommaren.
– Tekniskt så har vi återtestat brottet ned ur kanalen. Historiskt finns det en tendens att ett sådant beteende leder till ytterligare försäljningar.
Tillgängliga certifikat:
BULL OLJA X1, X2 ,X4, X5, & X10 S
BEAR OLJA X1, X2, X4, X5 & X10 S
ZINK LME 3M
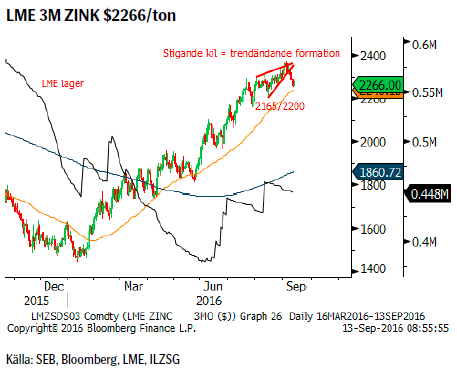 Så kom den då till slut, vändningen, korrektionen. Vi har under en tid ett flertal gånger påpekat att zinkmarknaden sprungit ifrån sig själv och att en korrektion med all nödvändighet väntat runt hörnet. Med stigande lager och en tekniskt allt mer ”stretchad” vy så har vi till slut nått en punkt där marknaden nu börjat skydda produktion/ta hem vinst på långa positioner. Givet den mycket långa nettopositionen bland kapitalförvaltare så kan en nedgång utlösa betydande försäljningar av finansiella positioner.
Konklusion: Flera faktorer talar för fortsatt nedåtrisk på kort sikt.
OBSERVATIONER
+ Fortsatt positiv vy på medellång – lång sikt.
+ Underskott i år och förväntat något större 2017.
+ Kinesisk fastighetsdata visar på stigande priser på nya bostäder.
+ Även bilförsäljningen är stark dock sviktar den amerikanska något.
+ Tekniskt så ligger vi medel – långsiktigt kvar i en stigande trend.
– Producentförsäljningarna har ökat ju mer priserna har klättrat.
– Ännu inga bevis på en tajtare marknad.
– LME lagren har ökat under sommaren (minskat marginellt på slutet).
– Tekniskt så har vi fallit ned från en s.k. stigande kil, ett vanligt avslutande mönster.
Tillgängliga certifikat:
BULL ZINK X1, X2, & X4 S
BEAR ZINK X2 & X4
GULD
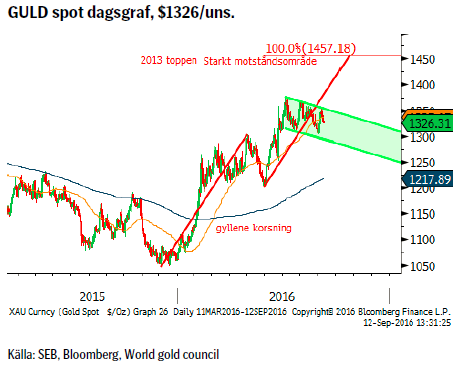 Guldet har sedan förra veckan ännu en gång testat den övre delen av den möjliga ”tjurflaggan” och ännu en gång förvägrats bryta upp ur densamma. Svagare amerikansk data och därmed uppskjuten räntehöjning sänkte dollarn och tryckte ned guldpriset men bara kortsiktigt. Guldet ser för närvarande ut att handlas ned på sämre riskaptit och stigande räntor alltså som vilken riskfylld placering som helst.
Konklusion: Fortsatt konsolidering är nog bästa gissning.
OBSERVATIONER
+ ETF-flödena vände förra veckan (statistik 2-8/9) till plus med guld och guldgruveaktierelaterade ETF:er som tredje respektive fjärde mest köpta.
+ Efterfrågan från världens 1,6miljarder muslimer kan komma att öka dramatiskt när en Sharia-standard för guld förväntas komma på plats under hösten.
+ FED’s obeslutsamhet avseende nästa räntehöjning.
+ Eventuella nya penningpolitiska stimulanser från ECB och Bank of Japan.
+ Fallande guldproduktion.
+ Statsobligationer till ett värde av $11 handlas nu till negativ ränta.
+ Det viktiga motståndsområdet i $1400-området har ännu inte utmanats.
+ Tekniskt så finns förutsättningarna för en så kallad ”tjurflagga”.
– Fortsatt positiva signaler för en starkare dollar.
– Fortsatt ökning av den nettolånga spekulativa positionen som redan är mycket stor i ett historiskt perspektiv.
– Centralbankerna har sedan i våras successivt minskat sina inköp månad för månad.
– Rekylfasen i den negativa guld/silver-trenden ser nu att ha avslutats vilket riskerar att påverka guldpriset negativt.
– Mycket tunga motstånd i $1400-området riskerar tynga.
– Tekniskt kvarstår risken för en djupare rekyl så länge inte priset klättrar upp över $1368.
Tillgängliga certifikat:
BULL GULD X1, X2, 4, 5 & 10 S
BEAR GULD X2, X4, X5 & X10 S
USD/SEK
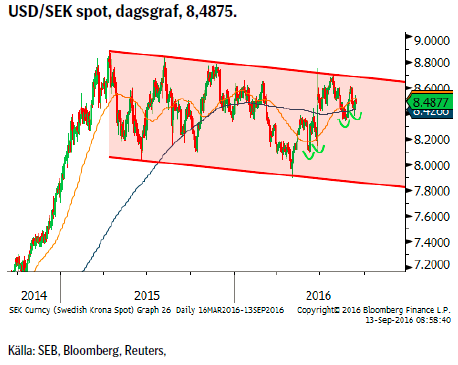 Svagare amerikansk statistik tillsammans med ett fullt inte lika mjukt Riksbanksbesked utlöste en lika snabb som kortlivad korrektion ned från 8,60 till 8,38 innan fyndköparna återvände. Sett ur en teknisk synvinkel så är det ju positivt med ännu en högre botten (även om denna inte är bekräftad innan 8,6155 bryts).
Konklusion: Fortsätter sakta men säkert att bygga upp trycket för ett brott på uppsidan.
OBSERVATIONER
+ Räntedifferensen mellan USA och Sverige bör fortsätta att öka.
+ Svensk ekonomi har börjat sakta in.
+ Dollarcykeln (sedan 1970-talet) pekar på en ny topp under 2017.
+ Positiv ränta i USA attraherar inflöden.
+ Den spekulativa långa nettopositioneringen i $-index är bara en fjärdedel av vad den var i början på året. Denna ökade dock under den senaste mätperioden.
+ Tekniskt så är konsolideringen ett fortsättningsmönster talandes för en fortsättning av den tidigare uppåttrenden.
– Att FED gång efter annan har skjutit upp räntehöjningarna.
– FED vill inte ha en allt för stark dollar.
– Osäkerhet om presidentvalet.
– Den starka dollarn är en klar motvind för amerikanska exportföretag samt att den ger en deflationsimpuls som i sin tur gör FED än mer obeslutsam.
Tillgängliga certifikat:
BULL USDSEK X1 & X4 S
BEAR USDSEK X4 S
KAFFE
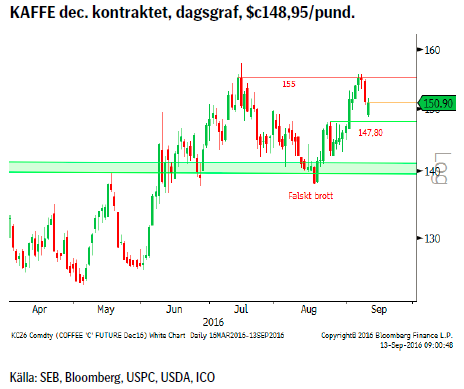 Den senaste statistiken visade på en fortsatt ökad lång nettopositionering förra veckan vilket också visade sig i initialt stigande priser. Allmän riskaptitsförsvagning i slutet på veckan påverkade dock även kaffepriset negativt.
Konklusion: Ökad vaksamhet efter att vi återigen mött säljintressen ovanför 155-nivån. Positiv trend består ovanför 147,80.
OBSERVATIONER
+ En av de tajtaste säsongerna på länge enligt USDA,
+ Fallande global export ger farhågor om ett tajtare utbud.
+ Asiatiska producenter lider fortfarande av sviterna efter El Ninjo dvs. produktion/export är lägre än tidigare.
+ Conab’s senaste undersökning av inhemska (Brasilianska) lager visade på en minskning med 5,4 % jämfört med samma tid 2015 (generellt låga lager i producentländer).
+ Sjukdomen kafferost visade sig ha än mer långtgående konsekvenser för mexikansk produktion vilken nu beräknas fallit med en tredjedel.
+ Centralamerikansk produktion nere på 11-års lägsta.
– Fredsavtalet i Colombia bör på sikt leda till en ökad produktion/export.
– Den brasilianska valutan har fortsatt att försvagas sedan toppen i början av augusti och det ser ut att fortsätta.
– Den spekulativa nettolånga positionen nu den största sedan sommar/höst 2014.
– Generellt goda lager i konsumentländerna.
– Ånyo säljare ovanför 155-nivån.
– Tekniskt negativt om 147,80 passeras på nedsidan.
Tillgängliga certifikat:
BULL KAFFE X1, X4 & X5 S
BEAR KAFFE X4 & X5 S
OMXS30 (RENT TEKNISK UTBLICK)
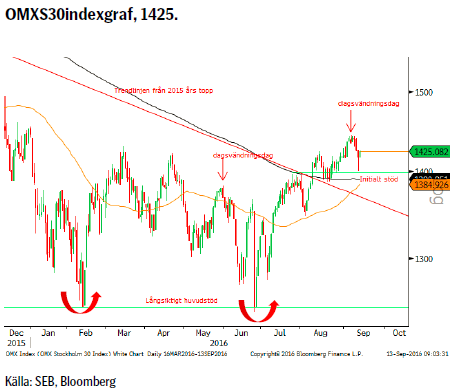 Den sjätte september utvecklades till en negativ vändningsdag (en högre topp än dagen föres högsta, en lägre botten än dagen föres lägsta och en stängning under dagen föres lägsta nivå) vilken efter de senaste dagarnas utveckling visat sig vara påfallande korrekt. Givet den tidigare positiva utvecklingen med högre toppar samt brottet över 2015 års fallande trendlinje är vi benägna att se innevarande nedgång som korrektiv dvs. tillfällig.
Konklusion: För att bibehålla en medelsiktigt positiv vy så bör området mellan 1397 – 1370 attrahera förnyat köpande.
OBSERVATIONER
+ Priset ligger över både 55 och 233d mv.
+ Priset har brutit över rekyltoppen från mars, 1432 och därigenom brutit mönstret av fallande toppar.
+ 55d mv har en positiv lutning.
+ Långsiktig dubbelbotten vid 1240/46 stödet.
– Starka motstånd vid 1483.
– Kortsiktigare indikatorer har vänt till sälj.
– Negativ dagsvändningsdag den 6:e sept.
Tillgängliga certifikat:
BULL OMX X5 S
BEAR OMX X5 S
INFORMATION OM REKOMMENDATIONER
Denna publikation är ett marknadsföringsmaterial för SEBs certifikat-produkter. I och med den nya Marknadsmissbruksförordningen vilken trädde i kraft den tredje juli 2016 har vi inte längre möjlighet att inkludera investeringsrekommendationer rörande certifikat-produkterna.
UTVECKLING SENASTE VECKAN SAMT SEDAN ÅRETS BÖRJAN
[box]SEB Veckobrev Veckans råvarukommentar är producerat av SEB:s Commodities Sales desk och publiceras i samarbete och med tillstånd på Råvarumarknaden.se[/box]
KÄLLOR
Bloomberg, Reuters, SEB
VILLKOR
För varje enskilt certifikat/mini future finns Slutliga Villkor som anger de fullständiga villkoren. Slutliga Villkor finns tillgängligt på kurssidan för respektive certifikat/mini future på www.seb.se, Börs & finans, fliken Strukturerade placeringar.
RISKER
En sammanfattning av de risker som är förknippade med Börshandlade certifikat generellt finns i Produktbroschyren för respektive certifikat eller mini future som är tillgängligt på seb.se/cert respektive seb.se/mini. För en fullständig bild av riskerna behöver du ta del av SEB:s offentliggjorda Grundprospekt för Certifikat- och Warrantprogram som är publicerat på www.seb.se/cert respektive seb.se/mini.
DISCLAIMER
Detta marknadsföringsmaterial, framtaget av SEB:s Commodities Sales desk, har upprättats enbart i informationssyfte.
Även om innehållet är baserat på källor som SEB bedömt som tillförlitliga ansvarar SEB inte för fel eller brister i informationen. Den utgör inte oberoende, objektiv investeringsanalys och skyddas därför inte av de bestämmelser som SEB har infört för att förebygga potentiella intressekonflikter. Yttranden från SEB:s Commodities Sales desk kan vara oförenliga med tidigare publicerat material från SEB, då den senare hänvisas uppmanas du att läsa den fullständiga rapporten innan någon åtgärd vidtas.
Dokumentationen utgör inte någon investeringsrådgivning och tillhandahålls till dig utan hänsyn till dina investeringsmål. Du uppmanas att självständigt bedöma och komplettera uppgifterna i denna dokumentation och att basera dina investeringsbeslut på material som bedöms erforderligt. Alla framåtblickande uttalanden, åsikter och förväntningar är föremål för risker, osäkerheter och andra faktorer och kan orsaka att det faktiska resultatet avviker väsentligt från det förväntade. Historisk avkastning är ingen garanti för framtida resultat. Detta dokument utgör inte ett erbjudande att teckna några värdepapper eller andra finansiella instrument. SEB svarar inte för förlust eller skada – direkt eller indirekt, eller av vad slag det vara må – som kan uppkomma till följd av användandet av detta material eller dess innehåll.
Observera att det kan förekomma att SEB, dess ledamöter, dess anställda eller dess moder- och/eller dotterbolag vid olika tillfällen innehar, har innehaft eller kommer att inneha aktier, positioner, rådgivningsuppdrag i samband med corporate finance-transaktioner, investment- eller merchantbanking-uppdrag och/eller lån i de bolag/finansiella instrument som nämns i materialet.
Materialet är avsett för mottagaren, all spridning, distribuering mångfaldigande eller annan användning av detta meddelande får inte ske utan SEB:s medgivande. Materialet riktar sig inte till personer vars medverkan kräver ytterligare prospekt, registrerings- eller andra åtgärder än vad som följer av svensk rätt. Det åligger var och en att iaktta sådana restriktioner. Materialet får inte distribueras i eller till land där distribution kräver ovan nämnda åtgärder eller strider mot reglering i sådant land. Materialet riktar sig således inte till fysiska eller juridiska personer hemmahörande i USA eller i något annat land där publicering eller tillhandahållande av materialet är förbjudet eller strider mot tillämpliga bestämmelser i landet.
Oaktat detta får SEB tillåta omfördelning av materialet till utvald tredje part i enlighet med gällande avtal. Materialet får inte spridas till fysiska eller juridiska personer som är medborgare eller har hemvist i ett land där sådan spridning är otillåten enligt tillämplig lag eller annan bestämmelse.
Skandinaviska Enskilda Banken AB (publ) är ett publikt aktiebolag och står under tillsyn av Finansinspektionen samt de lokala finansiella tillsynsmyndigheter i varje jurisdiktionen där SEB har filial eller dotterbolag.
Market is starting to take US/Iran headlines with a pinch of salt. Brent crude rose $2.8/b yesterday to an official close of $112.1/b. But after that it traded as low as $108.05/b before ending late night at around $109.7/b. Through the day it traded in a range of $106.87 – 112.72/b amid a flurry of news or rumors from Iran and the US. ”US temporary sanctions during negotiations” (falls alarm). ”We will bomb Iran” (not anyhow),… etc. While the market is still fluctuating to this kind of news flow, it is starting to take such headlines with a pinch of salt.

We’ll see. Maybe, maybe not. The Brent M1 contract is trading at $110.2/b this morning which very close to the average ticks through yesterday of $110.4/b.
Trump with bearish, verbal intervention whenever Brent trades above $110/b it seems. What seems to be a pattern is that Trump states something like ”very good negotiations going on with Iran”, ”New leaders in Iran are great,..”, ”Great progress in negotiations,…”, ”Deal in sight,..” etc whenever the Brent M1 contract trades above $110/b. An effort to cool the market. These hot air verbal interventions from Trump used to have a heavy bearish impact on prices, but they now seems to have less and less effect unless they are backed by reality.
As far as we can see there has been no real progress in the negotiations between the US and Iran with both sides still standing by their previous demands.
Iran is getting stronger while the cease fire lasts making a return to war for Trump yet harder. Iran is naturally in constant preparation for a return to war given Trump’s steady threats of bombing Iran again. Iran is naturally doing what ever is possible to prepare for a return to war. And every day the cease fire lasts it is better prepared. This naturally makes it more and more difficult and dangerous for the US to return to warring activity versus Iran as the consequences for energy infrastructure in the Persian Gulf will be more and more severe the longer the cease fire lasts. Israel seems to see it this way as well. That the war is not won and that current frozen state of a cease fire gives Iran opportunity to rebuild military and politically.
Global inventories are drawing down day by day. How much? In the meantime the Strait of Hormuz stays closed. There is varying measures and estimates of how much global inventories are drawing down. Our rough estimate, back of the envelope, is that global inventories are drawing down by at least some 10 mb/d or about 300 mb/d in a balance between loss of supply versus demand destruction. Other estimates we see are a monthly draw of 250-270 mb/d. The IEA only ’measured’ a draw in global observable stocks of 117 mb in April with oil on water rising 53 mb while on shore stocks fell 170 mb. But global stocks are hard to measure with large invisible, unmeasured stocks. As such a back of the envelope approach may be better.
Oil products is what the world is consuming. Oil product prices likely to rise while product stocks fall. Strategic Petroleum Reserves (SPR) are predominantly crude oil. Discharging oil from OECD SPR stocks, a sharp reduction in Chinese crude imports and a reduction in global refinery throughput of 6-7 mb/d has helped to keep crude oil markets satisfactorily supplied. But global inventories are drawing down none the less. And oil products is really what the world is consuming. So if global refinery throughput stays subdued, then demand will eventually have to match the supply of oil products. The likely path forward this summer is a steady draw down in jet fuel, diesel and gasoline. Higher prices for these. Then, if possible, higher refinery throughput and higher usage of crude in response to very profitable refinery margins. And lastly sharper draw in crude stocks and higher prices for these. But some 6 mb/d of oil products used to be exported through the Strait of Hormuz. And it may not be so easy to ramp up refinery activity across the world to compensate. Especially as Ukraine continues to damage Russian refineries as well as Russian crude production and export facilities.
Watch oil product stocks and prices as well as Brent calendar 2027. What to watch for this summer is thus oil product inventories falling and oil product premiums to crude rising. Another measure to watch is the Brent crude 2027 contract as it rises steadily day by day as the Strait of Hormuz stays closed and global oil inventories decline. The latter is close to the highest level since the start of the war and keeps rising.
The Brent M1 contract and the Brent 2027 prices and current price of jet fuel in Europe (ARA). All in USD/b

Our back of the envelope calculation of the global shortage created by the closure of the Strait of Hormuz. Note that 3.5 mb/d of discharge from SPR is also a draw. Note also that ’Forced demand loss’ of 2.5 mb/d is probably temporary and will fall back towards zero as logistics are sorted out leaving ’Price demand loss’ to do the job of balancing the market. Thus a shortfall of at least 9 mb/d created by the closure. More if SPR discharge is included and more if Forced demand loss recedes.

Brent is climbing higher. Front-month is at USD 106.3/bl this morning, close to a weekly high and a USD 9/bl jump from Mondays open. This is the move we flagged as a risk earlier in the week: the market shifting from ”a deal is around the corner” to ”this is going to take longer than we thought”.

Analyst Commodities, SEB
During April, rest-of-year Brent remained remarkably stable around USD 90/bl. A stability which rested on one single assumption: the SoH reopens around 1 May. That assumption is now slowly falling apart.
As we highlighted yesterday: every week of delay beyond 1 May adds (theoretically) ish USD 5/bl to the rest-of-year average, as global inventories draw 100 million barrels per week. i.e., a mid-May reopening implies rest-of-year Brent closer to USD 100/bl, and anything pushing into June or July takes us meaningfully higher.
What’s changed in the last 48 hours:
#1: The US military has formally warned that clearing suspected sea mines from SoH could take up to six months. That is a completely different timescale from what the financial market is pricing. Even a political deal tomorrow does not immediately reopen the strait.
#2: Trump has shifted his tone from urgency to ”strategic patience”. In yesterday’s press conference: ”Don’t rush me… I want a great deal.” The market is reading this as a president no longer feeling pressured by timelines, with the naval blockade running in the background.
#3: So far, the military activity is escalating, not de-escalating. Axios reports Iran is laying more mines in SoH. The US 3rd carrier strike group (USS George H.W. Bush) is arriving with two countermine vessels. Trump yesterday ordered the US Navy to destroy any Iranian boats caught laying mines. While CNN reports that the Pentagon is actively drawing up plans to strike Iranian SoH capabilities and individual Iranian military leaders if the ceasefire collapses. i.e., NOT a attitude consistent with an imminent deal!
Spot crude and product prices eased off the early-April highs on a combination of system rerouting and deal optimism. Both now weakening. Goldman estimates April Gulf output is reduced by 14.5 mbl/d, or 57% of pre-war supply, a number that keeps getting worse the longer this drags on.
Demand-side adaptation is ongoing: S. Korea has cut its Middle East crude dependence from 69% to 56% by pulling more from the Americas and Africa, and Japan is kicking off a second round of SPR releases from 1 May. But SPRs are finite.
Ref. to the negotiations, we should not bet on speed. The current Iranian leadership is dominated by genuine hardliners willing to absorb economic pain and run the clock to extract concessions. That is not a setup for a rapid resolution. US/Israeli media briefings keep framing the delay as ”internal Iranian divisions”, the reality is more complicated and points toward weeks and months, not days.
Our point is that the complexity is large, and higher prices have only just started (given a scenario where the negotiations drag out in time). The market spent April leaning on the USD 90/bl rest-of-year assumption; that case is diminishing by the hour. If ”early May reopening” is replaced by ”June, July or later” over the next week or two, both crude and products have meaningful room to reprice higher from here. There is a high risk being short energy and betting on any immediate political resolution(!).
Down on Friday. Up on Monday. The Brent June crude oil contract traded down 5.1% last week to a close of $90.38/b. It reached a high of $103.87/b last Monday and a low of $86.09/b on Friday as Iran announced that the Strait of Hormuz was fully open for transit. That quickly changed over the weekend as the US upheld its blockade of Iranian oil exports while Iran naturally responded by closing the SoH again. The US blew a hole in the engine room of the Iranian ship TOUSKA and took custody of the ship on Sunday. Brent crude is up 5.6% this morning to $95.4/b.
The cease-fire is expiring tomorrow. The US has said it will send a delegation for a second round of negotiations in Islamabad in Pakistan. But Iran has for now rejected a second round of talks as it views US demands as unrealistic and excessive while the US is also blocking the Strait of Hormuz.
While Brent is up 5% this morning, the financial market is still very optimistic that progress will be made. That talks will continue and that the SoH will fully open by the start of May which is consistent with a rest-of-year average Brent crude oil price of around $90/b with the market now trading that balance at around $88/b.
Financial optimism vs. physical deterioration. We have a divergence where the financial market is trading negotiations, improvements and resolution while at the same time the physical market is deteriorating day by day. Physical oil flows remain constrained by disrupted flows, longer voyage times and elevated freight and insurance costs.
Financial markets are betting that a US/Iranian resolution will save us in time from violent shortages down the road. But every day that the SoH remains closed is bringing us closer to a potentially very painful point of shortages and much higher prices.
The US blockade is also a weapon of leverage against its European and Asian allies. When Iran closed the SoH it held the world economy as a hostage against the US. The US blockade of the SoH is of course blocking Iranian oil exports. But it is also an action of disruption directed towards Europe and Asia. The US has called for the rest of the world to engaged in the war with Iran: ”If you want oil from the Persian Gulf, then go and get it”. A risk is that the US plays brinkmanship with the global oil market directed towards its European and Asian allies and maybe even towards China to force them to engage and take part. Maybe unthinkable. But unthinkable has become the norm with Trump in the White House.


Oil product price pain is set to rise as the Strait of Hormuz stays closed into summer

Solkraften pressar elpriserna dagtid

Michel Gubel ger sin syn på oljemarknaden

Svag vårflod dubblar elpriserna
Brent crude up USD 9/bl on the week… ”deal around the corner” narrative fades
Brent crude up USD 9/bl on the week… ”deal around the corner” narrative fades
Solkraften pressar elpriserna dagtid
Michel Gubel ger sin syn på oljemarknaden
Svag vårflod dubblar elpriserna
Oil product price pain is set to rise as the Strait of Hormuz stays closed into summer
-
Analys4 veckor sedan
Brent crude up USD 9/bl on the week… ”deal around the corner” narrative fades
-
 Nyheter3 veckor sedan
Solkraften pressar elpriserna dagtid
-
 Nyheter3 veckor sedan
Michel Gubel ger sin syn på oljemarknaden
-
Nyheter3 veckor sedan
Svag vårflod dubblar elpriserna
-
Analys2 dagar sedan
Oil product price pain is set to rise as the Strait of Hormuz stays closed into summer