

Analys
SEB Råvarubrev 16 februari 2016

 Ökad riskaptit?
MARKNADEN I KORTHET
Förra veckan gick i volatilitetens tecken med stora slag fram och tillbaka i de flesta tillgångsslag. Veckan avslutades dock i dur med solida uppgångar på börserna såväl som i ett antal råvaror, men nervositeten är fortsatt stor. Kina har firat nyår hela förra veckan och således bör måndagens nedgång ses som en reaktion på förra veckans globala nedgång. Geopolitiskt så bör hotet om ett turkiskt/saudiskt ingripande i Syrien bevakas noga då en sådan utveckling riskerar att leda till en icke önskvärd eskalering.
Råvaror: Större delen av veckan karakteriserades av fallande priser vilka dock till viss del reverserades under fredagen. Eventuellt spelade täckning av korta positioner inför den amerikanska långhelgen (måndag = President’s Day) en viss roll. Dock bör beteendet bevakas noga då det finns en tendens till att en marknad som är kort och som börjar minska risk på fredagar ofta befinner sig i ett förstadium till en större korrektion. Nymex lättolja skapade ett falskt veckobrott på nedsidan, koppar har skapat en möjlig, men inte bekräftad, bottenformation och soja ser ut att närma sig ett kommande utbrott på nedsidan.
Valuta: Riksbankens reporäntesänkning blev större än förväntat vilket initialt försvagade kronan som dock sedan dess återhämtat sig något. Dollarn var fortsatt svag under större delen av veckan men tog tillbaka en del styrka under fredagen (är rekylbotten nu nådd?). Yen-förstärkningen utlöste en våg av stoppar då USD/JPY bröt under 116.
Börser: Måndagensfall i Kina (som ju var stängda förra veckan) bör inte ses som något annat än en anpassning till omvärldens utveckling förra veckan. Lättnadsrallyt som började i fredags ser ut att ha mer att ge i mina ögon, givet det extremt negativa sentimentet (”när alla tänker lika, tänker inte någon särskilt mycket” – W.J. Lippman).
Räntor: Utvecklingen i den tyska 10-åringen (%) väcker i alla fall en berättigad fråga huruvida en dubbelbotten är i görningen. – 0,50 % är den nya reporäntan i Sverige.
TRENDER I SAMMANDRAG
- Divergens mellan Nymex och Brentoljorna då den förstnämnda nådde en ny men ytterst temporär botten medan den andra skapat en möjlig högre botten. Båda beteendena pekar på mer rekylpotential i närtid.
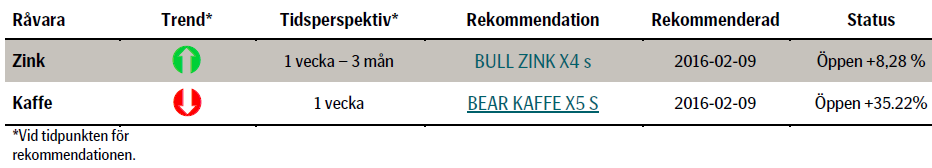
- Kaffe ser fortsatt svagt ut (vi behåller förra veckans säljrekommendation).
- USD nådde eventuellt sin korrektionsbotten förra veckan.
- Guldkorrektionen ger ett nytt köpläge.
VECKANS REKOMMENDATIONER
En placering i certifikat och warranter är förknippat med risker. Du kan förlora hela ditt investerade kapital. Läs mer om riskerna i SEB:s offentliggjorda Grundprospekt för certifikat- och warrantprogram på www.seb.se/cert eller www.seb.se/mini
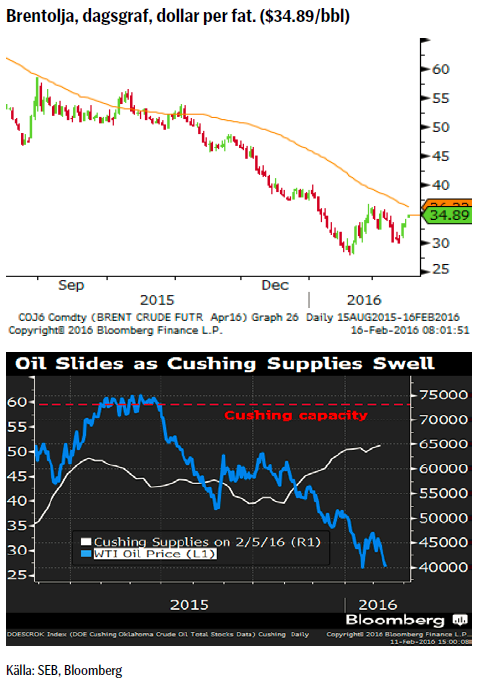
OLJA BRENT
 TREND
TREND
- EIAs rapport pekade på lägre efterfrågetillväxt 2016 än 2015
- Oljelagren minskade något förra veckan men ligger fortfarande på historiskt väldigt höga nivåer. Svagare ekonomi, motståndskraftigare skiffer- oljeproduktion eller en mix av båda? Lagren i Cushing närmar sig sin maxkapacitet (se nedan)
- OPECs februarirapport signalerade ytterligare något ökad produktion.
- Antalet borriggar fortsatte ned från 467 till 439 (avser perioden t.o.m. 12:e februari).
- Rykten om Ryssland/Saudimöte avseende produktionsneddragningar (vilka inte bör ge några långsiktigare återverkningar).
- Givet den svagare efterfrågeökningen och långsammare produktionsnedgången ser vi fortfarande nedåtpotential (dock avtagande nedgångstakt) för oljan varför vi rekommenderar att sälja rekyler.
- Håll ögonen på utvecklingen i Syrien. Sätts Turkisk/Saudisk trupp in riskerar vi en eskalering av konflikten.
REKOMMENDATION
- Vi rekommenderar fortfarande en strategi bestående av att sälja in i korrektioner (idealmål = $39/bbl)
EL
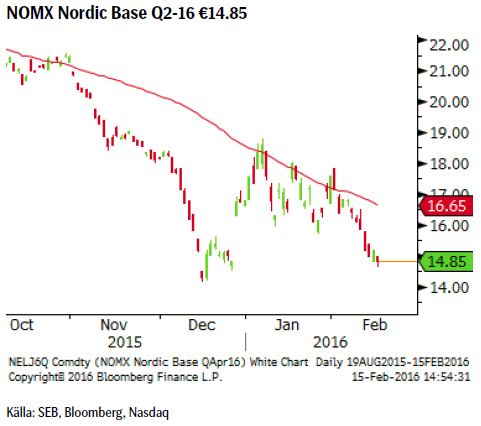 Så börjar vintern så sakteliga gå mot sitt slut och slutet verkar enligt prognoserna bli både mildare och med något mer nederbörd än normalt. Följaktligen så ser vi inte någon större potential för elpriset att i närtid röra sig uppåt (och skulle det göra det så bör det snarare ses som ett säljläge). Det mest troliga är att vi fortsätter handla i den lägre delen av det intervall som utvecklats sedan mitten av december, €14 – 18.
TREND
- Trenden är fortsatt i fallande och marknaden har fortsatt att sälja så fort priset tagit sig över 55dagars medelvärdet.
- Hydrobalansen ligger över sitt historiska snitt.
- 10-dagars prognos pekar mot en mildare och nederbördsrikare än normalt.
- Kärnkraften levererar för närvarande 94 % av kapacitet och inga driftstopp är planerade.
REKOMMENDATION
- BEAR EL X4 S om priset når 55dagars medelvärdet (just nu = €16.65).
KOPPAR (LME 3M)
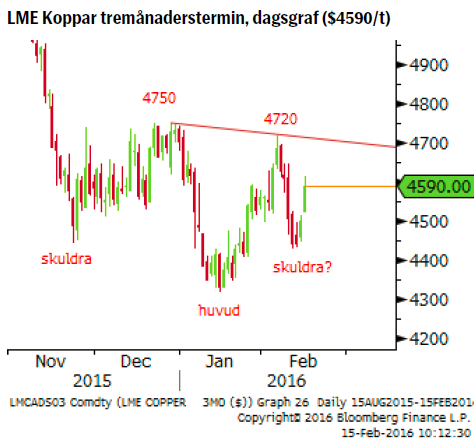 Koppar avslutade förra veckan med att stiga tillsammans med ett något förbättrat risksentiment. Än så länge så ser korrektionen ut som att den har kraft kvar varför vi tror på en fortsatt uppgång mot det väldigt intressanta området 4,720 – 4,750, där samtliga rekyler sedan november vänt.
TREND
- Sentiment fortsätter att vara svagt med pristrenden obrutet fallande (lägre toppar).
- Indonesien har förlängt PT Freeports exportlicens med ytterligare sex månader.
- Samtidigt planeras minst en Kanadensisk gruva att läggas i malpåse (beslut dock ej taget än). Glencore’s produktion minskade med 6 % under 2015.
- Dessutom rapporterade Glencore förra veckan att de ser produktionen i år falla till 1,390 kiloton (ned från 1,502 under 2015).
- En möjlig men ännu obekräftad bottenformation (inverterad huvud/skuldrabotten) i prisgrafen bör bevakas noga (bekräftas vid ett pris över 4,720).
REKOMMENDATION
- Den som är kort koppar bör överväga att stänga en sådan position om 4720/4750 nivån passeras då troligen en mer betydande korrektion är på väg.
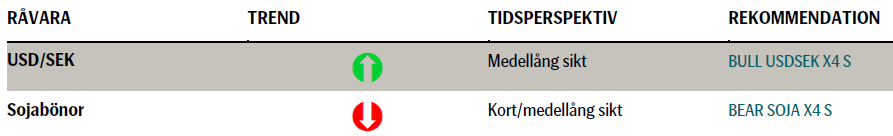
USD/SEK
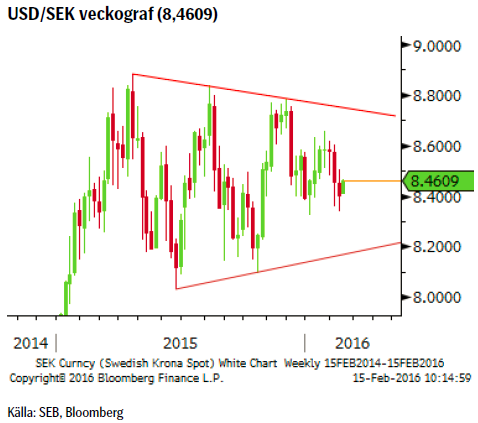 Börjar det nu bli dags för marknaden att ta nästa steg i uppåttrenden? Vi tror så och förbereder oss följaktligen inför ett förväntat brott upp ur den årslånga konsolideringen.
TREND
- Vi befinner oss sedan mars 2015 i en stor (8.03 – 8.88) kontrakterande konsolideringsfas vilken vi nu tror befinner sig i sin slutfas.
- Triangulära konsolideringar (i en uppåttrend) är normalt sett ett fortsättningsmönster för vidare uppgång.
- Även om marknaden tvivlar på takten av Feds förväntade räntehöjningar så bör vi ändå räkna med en gradvis ökad ränteskillnad mellan FED och Riksbanken.
REKOMMENDATION
- BULL USD/SEK X4 S (vi söker ett brott upp ur triangeln)
GULD
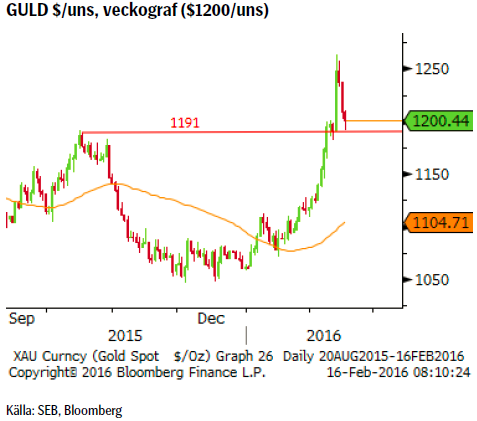 Guldet (och guldgruveaktier) har sedan förra veckan fortsatt att utvecklats positivt, dock avslutades veckan med fallande priser. Innevarande vecka har också börjat negativt men vi förväntar oss att sentimentet snart vänder tillbaka till ett mer positivt. Det är ju inte ovanligt att efter en så stark uppgång som vi haft de senaste veckorna att marknaden behöver hämta andan. Vi upprepar förra veckans ide om en uppgång till initialt 1300/1350 området varför nuvarande reaktion bör ses som ett köptillfälle.
TREND
- Prisuppgången under året har skett i en allt mer parabolisk prisbana vilket antagligen inte är uthålligt på kort sikt.
- En mjukare hållning från FED har gjort dollarköparna något mer osäkra.
- Vår rekommendation från förra veckan att köpa vid en sättning till 1146 har inte utlösts då priset fortsatt högre utan någon korrektion.
- Efter att ha passerat en tidigare rekyltopp finns det en tendens att återtesta och validera detta brott. Följaktligen borde det finnas utrymme för priset att falla ned mot 1190 – 1180 området innan en ny uppgångsfas borde ta sin början.
- Statistiken (Commitment of Traders report) från US CFTC visar på en kraftig uppbyggnad av långa futureskontrakt.
REKOMMENDATION
- BULL GULD X2S vid ett återtest under utbrottet (1191) idealt 1181/82.
SOJABÖNOR
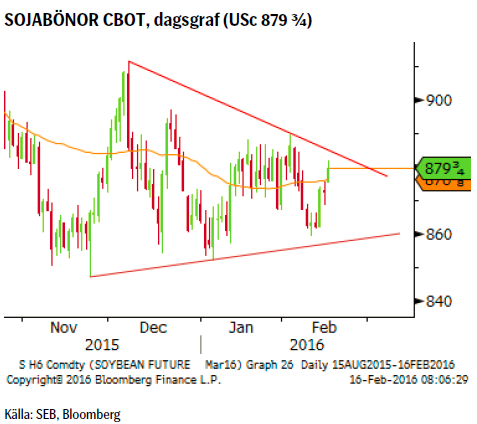 Det mesta talar för att sojamarknaden är på väg in i vad som kan vara en turbulent tid. Ett Argentina (världens tredje största producent) på stereoider (devalvering, sänkta skatter och ökad produktionsareal 2016) utgör en stor risk för ytterligare utbud med påföljande prisnedgångar.
TREND
- I princip har priset befunnit sig i en konsolidering sedan den senaste bottennoteringen i november. Det finns nu tecken på att denna nu är på väg att ebba ut och att den underliggande björntrenden snart ska fortsätta.
- Den senaste jordbruksrapporten (WASDE) från det amerikanska jordbruksdepartementet visar på fortsatt ökande lager samt förväntan om ökad konkurrens från Argentina.
- Argentinska odlare har också byggt upp sina lager och lagt mark i träda i protest mot den tidigare presidentens politik (bl.a. exportskatter) vilket nu förväntas förändras.
- Den argentinska peson har fallit med cirka 40 % sedan december vilket ger en extra skjuts åt argentinsk export.
- Vi förväntar oss att priset vänder ned senast från 890 US cent/bushel.
REKOMMENDATION
- BEAR SOJABÖNOR X4 S
AKTUELLA REKOMMENDATIONER
[box]SEB Veckobrev Veckans råvarukommentar är producerat av SEB:s Commodities Sales desk och publiceras i samarbete och med tillstånd på Råvarumarknaden.se[/box]
KÄLLOR
Bloomberg, Reuters, SEB
VILLKOR
För varje enskilt certifikat/mini future finns Slutliga Villkor som anger de fullständiga villkoren. Slutliga Villkor finns tillgängligt på kurssidan för respektive certifikat/mini future på www.seb.se, Börs & finans, fliken Strukturerade placeringar.
RISKER
En sammanfattning av de risker som är förknippade med Börshandlade certifikat generellt finns i Produktbroschyren för respektive certifikat eller mini future som är tillgängligt på seb.se/cert respektive seb.se/mini. För en fullständig bild av riskerna behöver du ta del av SEB:s offentliggjorda Grundprospekt för Certifikat- och Warrantprogram som är publicerat på www.seb.se/cert respektive seb.se/mini.
DISCLAIMER
Detta marknadsföringsmaterial, framtaget av SEB:s Commodities Sales desk, har upprättats enbart i informationssyfte.
Även om innehållet är baserat på källor som SEB bedömt som tillförlitliga ansvarar SEB inte för fel eller brister i informationen. Den utgör inte oberoende, objektiv investeringsanalys och skyddas därför inte av de bestämmelser som SEB har infört för att förebygga potentiella intressekonflikter. Yttranden från SEB:s Commodities Sales desk kan vara oförenliga med tidigare publicerat material från SEB, då den senare hänvisas uppmanas du att läsa den fullständiga rapporten innan någon åtgärd vidtas.
Dokumentationen utgör inte någon investeringsrådgivning och tillhandahålls till dig utan hänsyn till dina investeringsmål. Du uppmanas att självständigt bedöma och komplettera uppgifterna i denna dokumentation och att basera dina investeringsbeslut på material som bedöms erforderligt. Alla framåtblickande uttalanden, åsikter och förväntningar är föremål för risker, osäkerheter och andra faktorer och kan orsaka att det faktiska resultatet avviker väsentligt från det förväntade. Historisk avkastning är ingen garanti för framtida resultat. Detta dokument utgör inte ett erbjudande att teckna några värdepapper eller andra finansiella instrument. SEB svarar inte för förlust eller skada – direkt eller indirekt, eller av vad slag det vara må – som kan uppkomma till följd av användandet av detta material eller dess innehåll.
Observera att det kan förekomma att SEB, dess ledamöter, dess anställda eller dess moder- och/eller dotterbolag vid olika tillfällen innehar, har innehaft eller kommer att inneha aktier, positioner, rådgivningsuppdrag i samband med corporate finance-transaktioner, investment- eller merchantbanking-uppdrag och/eller lån i de bolag/finansiella instrument som nämns i materialet.
Materialet är avsett för mottagaren, all spridning, distribuering mångfaldigande eller annan användning av detta meddelande får inte ske utan SEB:s medgivande. Materialet riktar sig inte till personer vars medverkan kräver ytterligare prospekt, registrerings- eller andra åtgärder än vad som följer av svensk rätt. Det åligger var och en att iaktta sådana restriktioner. Materialet får inte distribueras i eller till land där distribution kräver ovan nämnda åtgärder eller strider mot reglering i sådant land. Materialet riktar sig således inte till fysiska eller juridiska personer hemmahörande i USA eller i något annat land där publicering eller tillhandahållande av materialet är förbjudet eller strider mot tillämpliga bestämmelser i landet.
Oaktat detta får SEB tillåta omfördelning av materialet till utvald tredje part i enlighet med gällande avtal. Materialet får inte spridas till fysiska eller juridiska personer som är medborgare eller har hemvist i ett land där sådan spridning är otillåten enligt tillämplig lag eller annan bestämmelse.
Skandinaviska Enskilda Banken AB (publ) är ett publikt aktiebolag och står under tillsyn av Finansinspektionen samt de lokala finansiella tillsynsmyndigheter i varje jurisdiktionen där SEB har filial eller dotterbolag.
Brent M1 moving below the 200 dma of $78.7/b. Brent crude continued its move lower yesterday with a decline of 3.3% to $77.9/b. This morning it is adding another drop of 1.4% to $76.8/b. Israel bombing Lebanon during the weekend was a violence of the MoU and Iran was quick to declare the SoH closed again. But the willingness to move forward by both the US and Iran obviously trumped the bombing in Lebanon making the event more of a hiccup on the road of further negotiations.

The US has now waived sanctions against Iranian oil exports for two months allowing Iran to sell its oil all over the world, though sanctions instated in Europe will take more time to unwind. Oil from Iran, Russia as well as Venezuela can for the time being be sold across the world without any sharp discount due to sanctions. Chinese Tea-pot refineries will suffer as they previously could buy rebated crude while selling products at market prices.
Crude oil is no flowing out of the SoH with latest number close to 7 mb/d on a three day moving average. That is still well below the 14 mb/d of crude and 6 mb/d of products normally flowing out of the SoH. Latest estimate is that there is around 80 mb of crude on water inside the Persian Gulf and maybe another 80 mb of oil products on water as well. If crude is exiting the SoH at a rate of around 7 mb/d, then the 80 mb of crude would be depleted within 10-15 days and there after the flow would rely on new crude tankers entering, loading and then exiting the SoH to continue further flows. Given the uncertainties surrounding the status of the SoH with Iran stating that it was closed again as recent as this weekend, there is likely an asymmetry here where ships and oil stranded in the SoH for months are much more eager to exit than new ships are eager to enter.
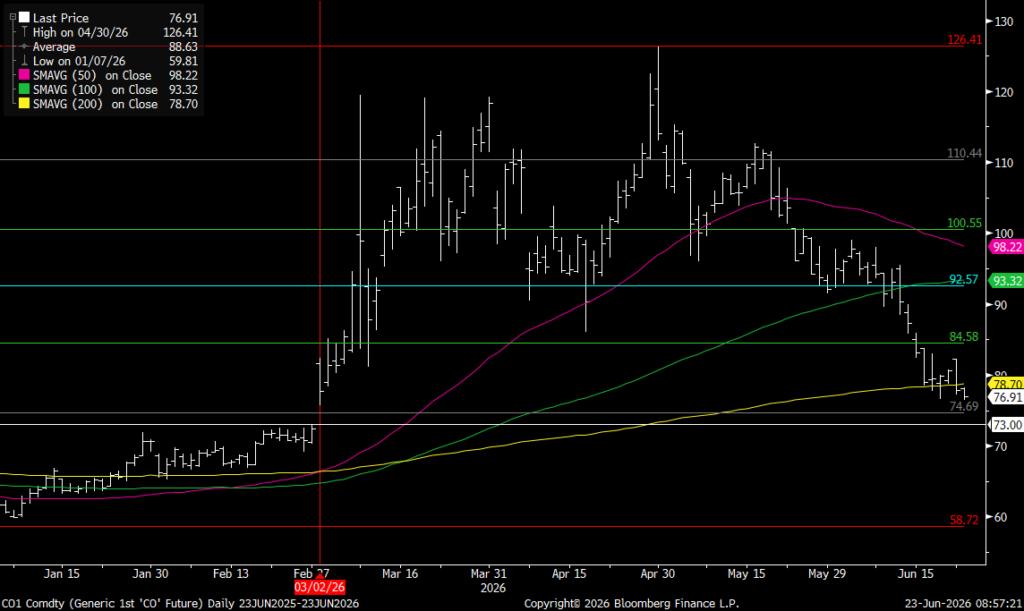
For now Brent crude keeps falling like a rock with the front-end Brent contract now only trading at a premium of $7.6/b above the five year contract. Quickly heading towards parity. The Brent M1 contract has now broken below its 200 dma of $78.7/b and is closing in on the Fibo-level at $74.7/b. Below that there is not much more supporting levels to be found before $73/b which would close the gap from February 3.
Brent crude M1 technical levels
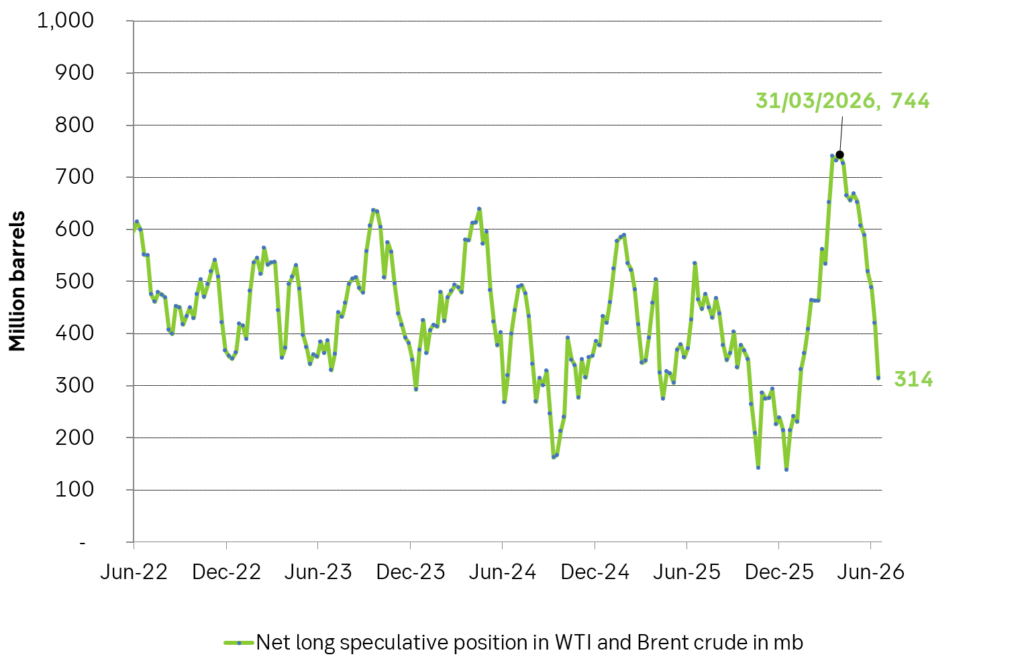
Net long speculative positions are also falling like a rock and as of Tuesday last week the net long positioning in Brent and WTI together summed to 314 million barrels and falling fast.
Will there be a rebound? A possible combination could be an exhaustion of the oil blob caught within the SoH within 1-2 weeks if exits continue at current rate while new ships entering are much more cautious, more Israeli bombardments in Lebanon as Netanyahu fights for re-election, a temporary closure of the SoH again while speculative short positions take cover buying back and covering their positions.
US and Israeli stands versus Iran could harden beyond elections so 2027 surplus is far from given. But Iran and the US are all in all moving towards a set of solutions with both clearly eager to reopen the SoH and keep it open. And that is what the market is pricing along with sharply falling prices. The ongoing discussions will likely take months and last beyond both the upcoming Israeli election (before 27 oct) and the US midterm elections on 3 Nov. Beyond those dates the stance by both Israel and the US may harden again versus Iran. But Iran knows that and is most likely preparing for such a hardening turn. Thus a surplus of oil and global oil stock rebuilding in 2027 (as now is mostly projected) is far from given.
Selling down on a ”deal”. Brent crude fell 6.2% last week with accelerated weakness towards the end of the week. Close of the week at $87.33/b and low of the week (and on Friday) of $85.8/b. Brent is falling another 4% this morning to $83.7/b on confirmation by Iran that a MoU text has been reached and that it will be signed on Friday this week.
So what is this ”deal” worth? Talk on the desk here this morning is that it is much like ”putting lipstick on a pig” where Trump has to sell this at home as a victory where ”the SoH has reopened”, the nuclear issue will be ironed out over the coming 60 days (or maybe 600 days?) and US consumers are getting a lower gasoline price and maybe US republicans survives the midterm elections.
The importance for Iran is that it emerges as the defacto winner of this war in the eyes of the non-US public world. That Iran now onwards is the ”ruler of the SoH” (combo of geography and new weapons systems like drones) or more softer: ”the guarantor of safe passage through the SoH”.
Iran doesn’t need nuclear weapons any more. Nuclear deterrence doesn’t work any more. Ukraine has made many attacks deep into Russia without being nuked in return. Plenty of Iranian ballistic rockets blasts over Israel but Iran wasn’t nuked in return.
There is no trust between the US and Iran. We don’t know all the details yet of the MoU. But what we do know is that there is no trust between the US and Iran what so ever. This is probably more like a descriptive text on how they can cooperate in a way where both sides keeps tactical leverage. Neither side makes irreversible concessions. Violations can be punished quickly. Cooperation produces immediate benefits.
This is a fragile structure. It can easily break down. There may be details which cannot be overcome. To be seen on Friday. The US has to show that it is willing put enough force behind managing and restraining Israel versus Hezbollah in Lebanon. We have seen that Netanyahu hasn’t listened all that much to Trump’s directives and wishes. This could be a major obstacle.
A gradual reopening is tactically preferable for Iran. A tactical leverage for Iran right now is that global oil stocks have been drawn down towards painful and increasingly dangerous levels with increasing risks for oil price spikes in mid-July to August. This together with US midterm elections on 3 November gives tactical leverage to Iran. Iran probably doesn’t want to fully give up on that leverage. A rapid, full reopening where global stocks are able to refill over the coming 60 days will significantly erode that leverage. If Iran reinstates a closure of the SoH after 60 days (if talks break down again), then the effect won’t be that impactful in terms of prices and the US midterm elections.
So a gradual and partial reopening where global markets gets the oil they need while they are unable to rebuild stocks could be a practical middle way for both parties. Trump can sell it as ”the SoH has reopened” and get affordable gasoline for US consumers. Iran can sell it as ”the SoH has fully reopened, but there is some friction” so flow is only 60-80% of normal.
Not much real demand destruction below $100/b. What we do know is that there is not much real price pain demand destruction for oil globally at an oil price below $100/b. A lot of demand-shock destruction. Fear. But demand should now come roaring back towards normal with fear for exceptionally high prices now is rapidly receding.
Sudden China demand destruction due to EVs? Bullocks. EV share of total Chinese carpool now around 13%. Share of new sales of EVs has reached 50%. This is a very gradual process. It doesn’t make oil demand fall like a rock over night. When EV new sales share reaches 100%, then the gasoline car pool will contract by some 5-10% per year. But that is only gasoline. Sudden reduction in Chinese oil demand is more about shock and risk.
Chinese crude oil imports will come roaring back. At what price? Today’s ”neutral” oil price is $70/b. That is the five year price which has steadily traded around the $70/b mark over the past 3-4 years. With still a risky picture one would think that China and the rest of the world will be big buyers of oil in the range of $70-85/b.
Global demand will likely snap back towards normal, forecasted demand and growth at such prices.
Physical reopening is a gradual process. The physical and practical reopening of the SoH will likely be gradual rather than sudden. And that probably suites Iran tactically as well.
Brent M1 price versus the Brent 5-yr (today’s ”normal” price)

Market is starting to take US/Iran headlines with a pinch of salt. Brent crude rose $2.8/b yesterday to an official close of $112.1/b. But after that it traded as low as $108.05/b before ending late night at around $109.7/b. Through the day it traded in a range of $106.87 – 112.72/b amid a flurry of news or rumors from Iran and the US. ”US temporary sanctions during negotiations” (falls alarm). ”We will bomb Iran” (not anyhow),… etc. While the market is still fluctuating to this kind of news flow, it is starting to take such headlines with a pinch of salt.
We’ll see. Maybe, maybe not. The Brent M1 contract is trading at $110.2/b this morning which very close to the average ticks through yesterday of $110.4/b.
Trump with bearish, verbal intervention whenever Brent trades above $110/b it seems. What seems to be a pattern is that Trump states something like ”very good negotiations going on with Iran”, ”New leaders in Iran are great,..”, ”Great progress in negotiations,…”, ”Deal in sight,..” etc whenever the Brent M1 contract trades above $110/b. An effort to cool the market. These hot air verbal interventions from Trump used to have a heavy bearish impact on prices, but they now seems to have less and less effect unless they are backed by reality.
As far as we can see there has been no real progress in the negotiations between the US and Iran with both sides still standing by their previous demands.
Iran is getting stronger while the cease fire lasts making a return to war for Trump yet harder. Iran is naturally in constant preparation for a return to war given Trump’s steady threats of bombing Iran again. Iran is naturally doing what ever is possible to prepare for a return to war. And every day the cease fire lasts it is better prepared. This naturally makes it more and more difficult and dangerous for the US to return to warring activity versus Iran as the consequences for energy infrastructure in the Persian Gulf will be more and more severe the longer the cease fire lasts. Israel seems to see it this way as well. That the war is not won and that current frozen state of a cease fire gives Iran opportunity to rebuild military and politically.
Global inventories are drawing down day by day. How much? In the meantime the Strait of Hormuz stays closed. There is varying measures and estimates of how much global inventories are drawing down. Our rough estimate, back of the envelope, is that global inventories are drawing down by at least some 10 mb/d or about 300 mb/d in a balance between loss of supply versus demand destruction. Other estimates we see are a monthly draw of 250-270 mb/d. The IEA only ’measured’ a draw in global observable stocks of 117 mb in April with oil on water rising 53 mb while on shore stocks fell 170 mb. But global stocks are hard to measure with large invisible, unmeasured stocks. As such a back of the envelope approach may be better.
Oil products is what the world is consuming. Oil product prices likely to rise while product stocks fall. Strategic Petroleum Reserves (SPR) are predominantly crude oil. Discharging oil from OECD SPR stocks, a sharp reduction in Chinese crude imports and a reduction in global refinery throughput of 6-7 mb/d has helped to keep crude oil markets satisfactorily supplied. But global inventories are drawing down none the less. And oil products is really what the world is consuming. So if global refinery throughput stays subdued, then demand will eventually have to match the supply of oil products. The likely path forward this summer is a steady draw down in jet fuel, diesel and gasoline. Higher prices for these. Then, if possible, higher refinery throughput and higher usage of crude in response to very profitable refinery margins. And lastly sharper draw in crude stocks and higher prices for these. But some 6 mb/d of oil products used to be exported through the Strait of Hormuz. And it may not be so easy to ramp up refinery activity across the world to compensate. Especially as Ukraine continues to damage Russian refineries as well as Russian crude production and export facilities.
Watch oil product stocks and prices as well as Brent calendar 2027. What to watch for this summer is thus oil product inventories falling and oil product premiums to crude rising. Another measure to watch is the Brent crude 2027 contract as it rises steadily day by day as the Strait of Hormuz stays closed and global oil inventories decline. The latter is close to the highest level since the start of the war and keeps rising.
The Brent M1 contract and the Brent 2027 prices and current price of jet fuel in Europe (ARA). All in USD/b

Our back of the envelope calculation of the global shortage created by the closure of the Strait of Hormuz. Note that 3.5 mb/d of discharge from SPR is also a draw. Note also that ’Forced demand loss’ of 2.5 mb/d is probably temporary and will fall back towards zero as logistics are sorted out leaving ’Price demand loss’ to do the job of balancing the market. Thus a shortfall of at least 9 mb/d created by the closure. More if SPR discharge is included and more if Forced demand loss recedes.


Brent falling like a rock with oil likely to flow from SoH until at least 3 November

Vattenfalls och Industrikrafts kärnkraftsbolag Videberg Kraft har valt Rolls-Royce SMR
Selling down on a ”deal”

Sommarväder skapar prisrally på elbörsen
Oil product price pain is set to rise as the Strait of Hormuz stays closed into summer
Sommarväder skapar prisrally på elbörsen
Vattenfalls och Industrikrafts kärnkraftsbolag Videberg Kraft har valt Rolls-Royce SMR
Selling down on a ”deal”
Brent falling like a rock with oil likely to flow from SoH until at least 3 November
-
Nyheter3 veckor sedan
Sommarväder skapar prisrally på elbörsen
-
 Nyheter1 vecka sedan
Vattenfalls och Industrikrafts kärnkraftsbolag Videberg Kraft har valt Rolls-Royce SMR
-
Analys1 vecka sedan
Selling down on a ”deal”
-
Analys2 timmar sedan
Brent falling like a rock with oil likely to flow from SoH until at least 3 November