

Analys
SEB Råvarubrev 13 februari 2018

 När kommer höjningen Riksbanken?
MARKNADEN I KORTHET
Börsfallet har om inte kommit av sig så åtminstone tagit en paus. Den oroande slutsatsen av de senaste veckorna är att både aktier och obligationer fallit i tandem så denna gång har inte obligationer (eller blandfonder) varit den säkra hamn de oftast brukat vara. Den ökade volatiliteten kommer också att fortsätta tvinga placerare att dra ned på sina exponeringar enligt olika riskmodeller. Om amerikansk löneökningskostnad anges som den primära utlösaren av oron så finns fog för att förvänta sig ytterligare stigande lönepress. En god indikation är att allt fler deltidsanställda får utökad arbetstid. Riksbanken kommer med besked onsdag fm. Ingen ränteförändring kommer nu utan frågan är när? Vår investerarundersökning visar att i september är huvudspåret men till skillnad mot i dec-17 så är det nu betydligt fler som tror att det dröjer inpå 2019. Imorgon onsdag kommer också amerikansk prisstatistik (KPI) för januari. En avvikelse från det förväntade, framför allt på uppsidan kan få oron att snabbt flamma upp igen. Kina börjar på torsdag sitt långa (t.o.m. 21/3) nyårsfirande av hundens år. Se dessutom upp med SDP’s medlemsomröstning om den nya storkoalitionen med CDU/CSU, inte på något vis ett garanterat ja och därigenom en underskattad risk för nyval.

Anders Söderberg, Redaktör
Råvaror: Korrektionen i oljepriset har visat sig bli kraftigare än vad vi initialt trodde. Den nettolånga spekulativa positionen har nu börjat minska men är fortfarande oerhört stor i ett historiskt perspektiv varför ett svagare pris kommer att dra fram mer utbud i form av nedstängning av långa terminer. Guldet har inte svarat speciellt mycket på börsoron men vi kan ju hursomhelst notera att priset är ett av de få som inte fallit nämnvärt. Guld/silver relationen har åter fallerat över 80 (uns silver per uns guld) något som upprepats gång efter gång de senaste decennierna. Palladium/platina spreaden går nu allt fortare ihop, vilket faller sig naturligt tycker vi, givet den kraftigt översålda platinan. Bas-metallerna fortsätter att korrigera lägre och bör fortsätta att göra så. Kakao är tillbaka och testar sitt 55d mv band utbrott. Socker ser ut att ha avslutat en mindre uppåt korrektion och torde alltså vara sårbar för förnyade försäljningar. Elpriserna, både spot (som dock efter köldknäppen fallit tillbaka) och termin har klättrat något högre. Så ock utsläppsrätterna som nu har fördubblats sedan början av 2017
Valuta: Dollar och yen har åter visat sig fungera som trygga hamnar i tider av oro och i och med att vi ser ytterligare börsoro framför oss så bör dessa två valutor fortsätta att göra bättre ifrån sig.
Börser: Det troligaste scenariot kvarstår, dvs. en korrektiv studs och sedan en ny nedgångssekvens. Det blir alltså väldigt viktigt att se reaktionerna under förra veckans botten. Blir denna temporär eller ett misslyckande. OMXS30 har också fått ett ”dödskors” i form av 55d mv brytandes under 233d mv.
Räntor: Obligationsräntorna har, trots börsoro, fortsatt att hålla sig nära eller t.o.m. lyckats stiga över de senaste topparna. En amerikansk 10-åring ligger på 2,82 % efter att igår nått 2,89 % som högst, den högsta nivån på fyra år.
OBSERVATIONER I SAMMANDRAG
- Olja – större korrektion än förväntat.
- Nickel – falskt brott upp ur den stigande kanalen.
- Guld – relativt aktier stark utveckling.
- DAX – faran är inte på något vis över än.
- USD/SEK – oron talar för starkare dollar.
- OMX30 – troligtvis en negativ triangel.
En placering i certifikat och warranter är förknippat med risker. Du kan förlora hela ditt investerade kapital. Läs mer om riskerna i SEB:s offentliggjorda Grundprospekt för certifikat- och warrantprogram på seb.se/cert eller seb.se/mini
OLJA BRENT
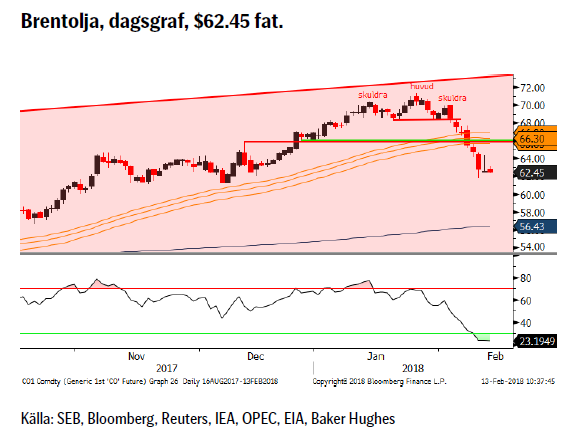 I och med brottet ned igenom 55d mv bandet har vi gått från en mindre till en större korrektion. Varningstecknet i form av fortsatt spekulativt köpande i en fallande marknad fungerade väl och spekulanterna har nu börjat sälja ned sin mycket stora långa nettoposition (som är fortsatt väldigt stor). EIA rapporten igår måndag visade på fortsatt ökning av borrningsaktiviteten och även antalet borrade men icke produktionsigångsatta källor. I årstakt förväntas skifferoljan öka med cirka 1,3m fpd vilket torde ge en total amerikansk produktion för 2018 om ca.10,85m fpd. Trots det så riskerar vi ett underskott för 2018 om OPEC fullföljer sina produktionsbegränsningar.
Konklusion: Nedgången börjar bli översåld.
OBSERVATIONER
+ Saudierna vill fortsätta samarbetet in i 2019.
+ Kinas import ökar åter.
+ Förlängningen av produktionsbegränsningarna.
+ Att förlängningen nu också omfattar Libyen och Nigeria.
+ Geopolitikens återkomst i form av en riskpremie i oljepriset.
+ Kurvans negativa lutning (backwardation) gör det lönsammare att ligga lång.
+ Långa spekulativa nettopositioner är rekordstora, men minskar
+ Ökad global efterfrågan och uppreviderad global tillväxt.
+ Produktionen i Venezuela faller och faller och faller.
+ Tekniskt börjar nedgången bli översåld.
– EIA reviderar åter upp US produktion (10,8–10,9m fpd).
– De stora spekulativa positionerna.
– Fortsatt ökning av nya borriggar och DUC’s.
– Troligt att dollarn återtar en del förlorad mark givet oron.
– De geopolitiska riskerna har minskat något.
– Tekniskt negativt brott under 55d mv bandet.
– Tekniskt nästa stöd i låga 61 området.
Tillgängliga certifikat:
BULL OLJA X1, X2, X4, X5, & X10 S
BEAR OLJA X1, X2, X4, X5 & X10 S
NICKEL
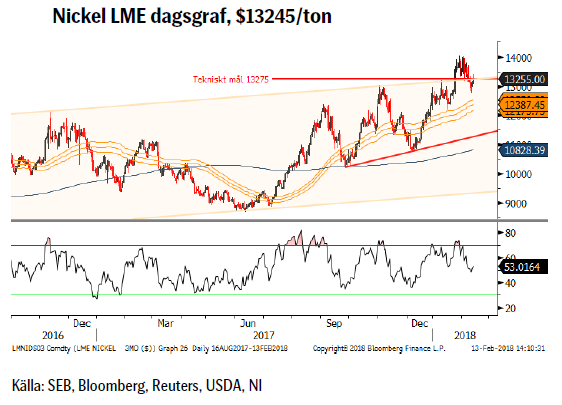 För närvarande verkar 14.000 nivån vara nog. Efter ett antal försök så har vi nu backat tillbaka till lägre nivåer. Den fortsatta uppgången i kobolt (spot har sedan ett år tillbaka gått från 33000 till 81280 $/t) gör dock att spekulationerna är höga om att nickel ska kunna, åtminstone till viss del, konkurrera med kobolt. Bilföretagen kämpar med näbbar och klor för att tillförsäkra sig framtida leveranser av kobolt och litium. Hursomhelst så är den näraliggande risken fortsatt på nedsidan men potentialen söderut begränsas naturligtvis en del av batteriproblematiken.
Konklusion: Tillbaka i kanalen och risk för mer säljande.
OBSERVATIONER
+ Billigare för batteritillverkare än kobolt.
+ 2017 kommer att landa på ett underskott och även 2018 spås göra så.
+ Lägsta LME lagren sedan 2014.
+ Rostfritt har gått starkare än förväntat.
+ IMF har justerat upp global tillväxt och utsikterna i närtid goda.
+ Lång spekulativ nettopositionering ökade till den högsta på ett år och det är långa kontrakt som öppnas upp.
+ Fallande dollar har pressat upp metallpriserna.
+ Ökad optimism i råvaror vilket leder till inflöden i råvarufonder.
+ Optimism om elbilssektorn (vilket är för tidigt, tror jag).
+ Kostnadsgolvet har stigit.
– Den långa nettopositionen har börjat minska och det genom både stängda långa och nyöppnade korta kontrakt.
– Större än förväntad kinesisk produktion.
– Lagren är stora men ses fortsätta falla 2018/2019.
– Indonesisk export kommer att öka årligen de närmaste åren.
– Australien har flera nya projekt på gång.
– Om det klarnar runt miljölagarna på Filippinerna.
– Se upp för mars som tillsammans med maj är den sämsta månaden de senaste tio åren.
– Lägre infrastruktur och bostadsinvesteringar i Kina.
– Negativt tillbaka i kanalen dvs. falskt uppsidesbrott.
Tillgängliga certifikat:
BULL NICKEL X1, X2 & X4 S
BEAR NICKEL X1, X2 & X4 S
GULD
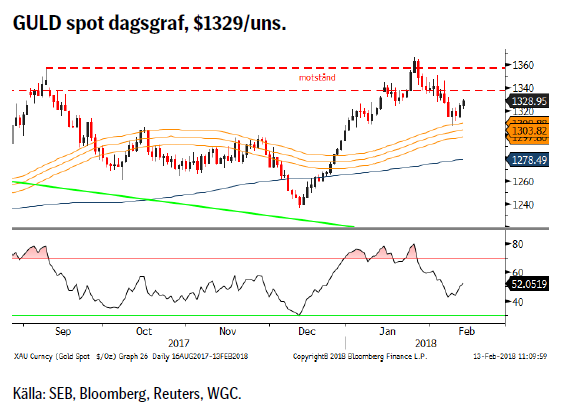 Den stora börs- och obligationsoron tog initialt även guldet med sig nedåt men nedgången blev ju väldigt begränsad jämfört med framför allt aktierna. Vi har dock även sett att guldpriset tappat något mot silverpriset då relationen åter blivit bortstött ovanför 80 (antalet uns silver för ett uns guld) något som skett gång efter annan under de senaste decennierna. Följaktligen ser guld dyrt ut jämfört med silver, i en relativprissättning.
Konklusion: Positiv bias ovanför 55d mv bandet.
OBSERVATIONER
+ Efterfrågan på guld inför det Kinesiska nyårsfirandet.
+ Newcrest Mining rapporterade om ett betydligt högre kostnadsgolv 2017.
+ Inflationstrycket i USA fortsätter upp, nu senast med löneökningstakten lite över förväntat.
+ Rykten om minskad moms (f.n. 18 %) på investeringsguld i Ryssland
+ Fortsatt risk för Bitcoin nedgång.
+ Säsongsmässigt så är januari och februari normalt sett relativt bra månader för guldet.
+ Utvecklingen av den kinesiska guld ETF marknaden.
+ Shariastandarden för guld är långsiktigt positivt.
+ Tekniskt positivt att 55d mv bandet fortsätter att vara stöd.
– Den spekulativa (både netto och brutto) långa positioneringen har fortsatt att minska och är nu tillbaka på nivåer vi inte sett sedan augusti.
– Reaktionen på börsnedgången fortsatt begränsad.
– En större dollarkorrektion bör snart vara på väg.
– Klubbandet av den amerikanska skattererformen.
– Dåligt gensvar på spänningarna Saudiarabien/Iran.
– Realräntorna är i stigande.
– $1350/75 området måste passeras innan en positivare vy appliceras.
– Tekniskt sett så är det negativt att marknaden stöttes bort från motståndsområdet.
Tillgängliga certifikat:
BULL GULD X1, X2, X4, X5 & X10 S
BEAR GULD X1, X2, X4, X5 & X10 S
DAX
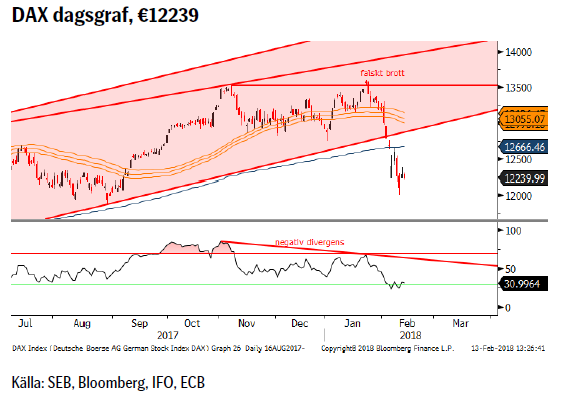 För det första så ska vi vara försiktiga inför SDP’s medlemsomröstning om huruvida man ska acceptera det framförhandlade förslaget och ingå en ny storkoalition med Fru Merkel. Ett ja är inte på något vis garanterat och kom ihåg att den extra partikongressen gav grönt ljus med minsta möjliga marginal. Motståndet mot GroKo (Grosses koalition) är framför kompakt inom ungdomsrörelsen. Det italienska valet rycker också allt närmare. Summa summarum har vi en del orosmoment framför oss och det förutom det generellt skakiga börsläget.
Konklusion: Faran är inte på något vis över än.
OBSERVATIONER
+ Om SDP röstar ja till förslaget till ny koalition.
+ Historiken, upp 7/10 senaste åren, är positiv för mars.
+ Fortsatt bra ekonomisk statistik (EU & Ty inköpschefsindex).
+ Eurozons index för banker har brutit ut på uppsidan.
+ Nu tillväxt i alla euro-länder.
+ ECB lär hålla räntorna låga för lång tid framöver.
+ Den långa vågräkningen är fortsatt positiv (så länge inte 10474 passeras på nedsidan).
– Risken för att SDP’s medlemmar röstar nej till koalitionen.
– Det kommande Italienska valet.
– Den starka euron bör börja oro ECB.
– Tyska långa räntor är fortsatt i stigande mer än 100 % upp sedan mitten av december (0,3 – 0,75 %).
– Brittisk bilförsäljning har fallit kraftigt (en av de största exportmarknaderna för tysk bilindustri).
– Dieselgate (vi har inte sett slutet på detta än).
– Brott under 233d mv.
– Negativt kort/medelsiktigt vågmönster.
– Exit den positiva kanalen.
– Tekniskt har vi nu säljsignaler i flera tidsintervall vilka också underbyggs av de negativa divergenserna.
Tillgängliga certifikat:
BULL DAX X2, X5, X10 & X15 S
BEAR DAX X1, X2, X5, X10 & X15 S
USD/SEK
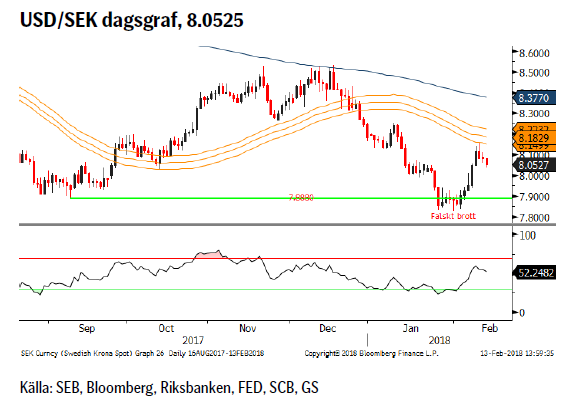 US financial conditions index (ett mått på tajtare/lättare likviditetssituation utifrån ett antal variabler i ränte och aktiemarknaderna i USA) har fortsatt att stramas åt vilket givit understöd till en starkare dollar. Fortsatt oro (vilket undertecknad tror på) bör fortsatt ge incitament till starkare dollar och yen. Håll koll på morgondagens Riksbanksbesked, inte för räntan utan för en eventuell förändring av den framtida räntebanan. Ett nyval i Tyskland (om SDP’s medlemmar gör tummen ned för överenskommelsen med CDU/CSU) kan också tänkas försvaga euron dvs. stärka dollarn. Håll också koll på onsdagens inflationsstatistik i USA med tanke på att högre löneökningar noterades i den senaste arbetsmarknadsstatistiken.
Konklusion: Tillbaka över åttan!
OBSERVATIONER
+ Global börsoro har en tendens till att stärka dollar och yen.
+ Inflationen är så sakteliga i stigande i USA varför marknaden nu börjar prisa in fyra snarare än tre höjningar under 2018.
+ Fram tills Riksbanken gör sin första höjning kommer räntedifferensen USA – Sverige att öka.
+ Atlanta FED indikatorn pekar på 5,4 % årstillväxt under kvartal 1 2018.
+ Feds minskning av balansräkningen.
+ Financial conditions har fortsatt att tajta till sig.
+ Fortsatt stor kort dollarposition mot euron.
+ Det kommande Italienska valet.
+ Amerikansk rapportsäsong har varit mycket starkare än den svenska.
+ Tekniskt sett i en möjlig bottenformation i och med det falska brottet under 7.8880.
– Långa €/$ positioner har börjat minska om än marginellt.
– Europa har fortsatt att överraska positivt.
– Överoptimism över det amerikanska skattepaketet.
– Skuldtaket är ännu inte på plats i USA.
– Ökat budgetunderskott och därigenom ökad upplåning i USA.
– Fallande dollar trend.
– Tekniskt är vi fortfarande negativt placerade under 55d mv bandet.
Tillgängliga certifikat:
BULL USD/SEK X1 & X4 S
BEAR USD/SEK X1 & X4 S
OMXS30
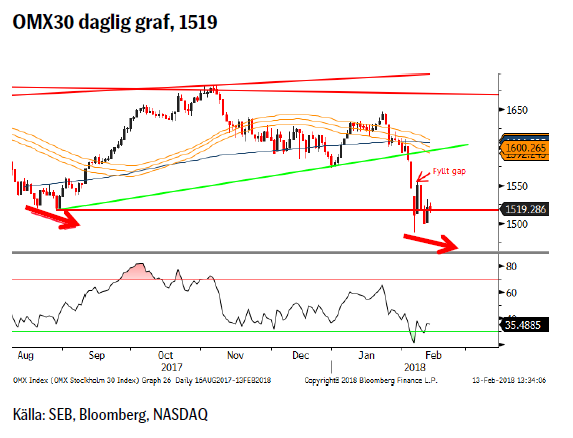 Än så länge har vi till punkt och pricka följt skolboken. Vi först den lilla rekyl vi såg komma och den fyllde sedan det öppna gapet innan vi åter föll. Dock har vi ännu inte satt någon ny botten, vilket vi anser bör ske innan vi kan börja leta efter en botten formation. Det troligaste utfallet för närvarande är att vi skapar en negativ triangel, ett negativt fortsättningsmönster, för att därefter falla ned till en ny botten. Hur denna nya botten sedan tas emot, fyndköpare eller paniksäljare, avgör huruvida vi kan börja skapa en bottenformation eller ej. Håll koll på Riksbanksbeskedet onsdag fm då framför allt en något hökaktigare räntebana skulle kunna stärka kronan. Ny bostadsstatistik kommer också på onsdag (Valueguard).
Konklusion: Vi bör se minst en botten till.
OBSERVATIONER
+ Säsongsmässigt feb historiskt (upp 8/10 senaste år) starkt.
+ Mjuk Riksbank väntar med första höjningen trots högre KPIF.
+ Svensk ek statistik fortsätter att vara relativt positiv och EU dito allt starkare.
+ Det långsiktiga vågmönstret är fortsatt positivt.
+ Om vi spikar under föregående botten eller kliver tillbaka över 55d mv bandet.
– Om Riksbanken är hökaktigare.
– Fortsatt risk för svensk bomarknad.
– PMI vände åter ned.
– Vi har brutit under 55d mv bandet och 233d mv.
– En negativ månadsvändningssignal i november.
– Negativa veckosignaler.
– Vi har nu ett, 55/233d, dödskors på plats.
– Vi har brutit under föregående korrektionsbotten.
Tillgängliga certifikat:
BULL OMX X5, X10 & X15 S
BEAR OMX X1, X5, X10 & X15 S
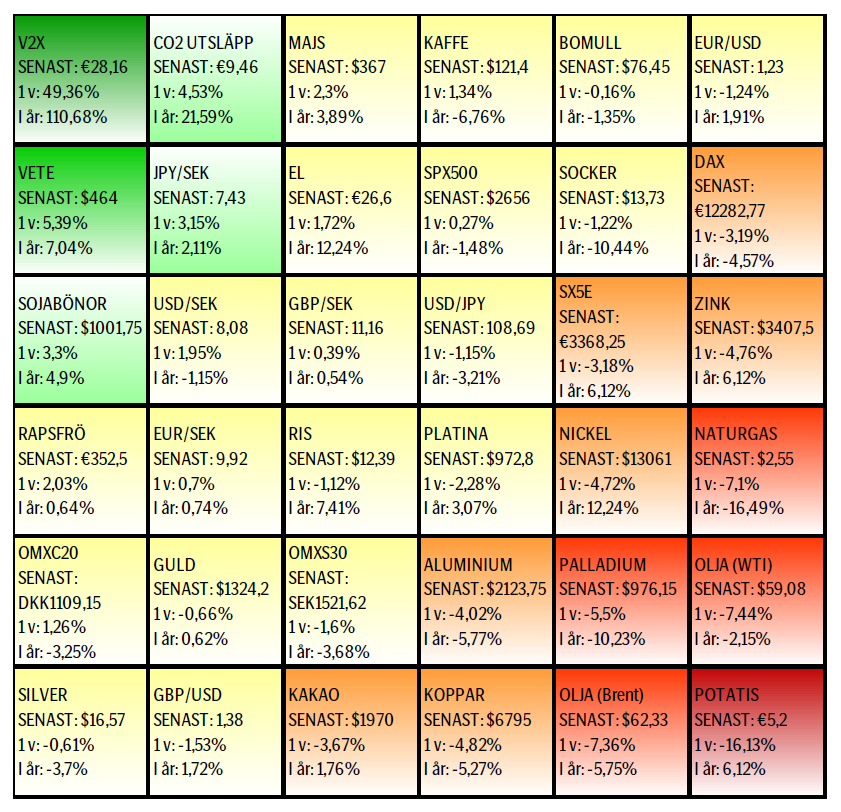
UTVECKLING SENASTE VECKAN SAMT SEDAN ÅRETS BÖRJAN
[box]SEB Veckobrev Veckans råvarukommentar är producerat av SEB:s Commodities Sales desk och publiceras i samarbete och med tillstånd på Råvarumarknaden.se[/box]
KÄLLOR
Bloomberg, Reuters, SEB
VILLKOR
För varje enskilt certifikat/mini future finns Slutliga Villkor som anger de fullständiga villkoren. Slutliga Villkor finns tillgängligt på kurssidan för respektive certifikat/mini future på www.seb.se, Börs & finans, fliken Strukturerade placeringar.
RISKER
En sammanfattning av de risker som är förknippade med Börshandlade certifikat generellt finns i Produktbroschyren för respektive certifikat eller mini future som är tillgängligt på seb.se/cert respektive seb.se/mini. För en fullständig bild av riskerna behöver du ta del av SEB:s offentliggjorda Grundprospekt för Certifikat- och Warrantprogram som är publicerat på www.seb.se/cert respektive seb.se/mini.
DISCLAIMER
Detta marknadsföringsmaterial, framtaget av SEB:s Commodities Sales desk, har upprättats enbart i informationssyfte.
Även om innehållet är baserat på källor som SEB bedömt som tillförlitliga ansvarar SEB inte för fel eller brister i informationen. Den utgör inte oberoende, objektiv investeringsanalys och skyddas därför inte av de bestämmelser som SEB har infört för att förebygga potentiella intressekonflikter. Yttranden från SEB:s Commodities Sales desk kan vara oförenliga med tidigare publicerat material från SEB, då den senare hänvisas uppmanas du att läsa den fullständiga rapporten innan någon åtgärd vidtas.
Dokumentationen utgör inte någon investeringsrådgivning och tillhandahålls till dig utan hänsyn till dina investeringsmål. Du uppmanas att självständigt bedöma och komplettera uppgifterna i denna dokumentation och att basera dina investeringsbeslut på material som bedöms erforderligt. Alla framåtblickande uttalanden, åsikter och förväntningar är föremål för risker, osäkerheter och andra faktorer och kan orsaka att det faktiska resultatet avviker väsentligt från det förväntade. Historisk avkastning är ingen garanti för framtida resultat. Detta dokument utgör inte ett erbjudande att teckna några värdepapper eller andra finansiella instrument. SEB svarar inte för förlust eller skada – direkt eller indirekt, eller av vad slag det vara må – som kan uppkomma till följd av användandet av detta material eller dess innehåll.
Observera att det kan förekomma att SEB, dess ledamöter, dess anställda eller dess moder- och/eller dotterbolag vid olika tillfällen innehar, har innehaft eller kommer att inneha aktier, positioner, rådgivningsuppdrag i samband med corporate finance-transaktioner, investment- eller merchantbanking-uppdrag och/eller lån i de bolag/finansiella instrument som nämns i materialet.
Materialet är avsett för mottagaren, all spridning, distribuering mångfaldigande eller annan användning av detta meddelande får inte ske utan SEB:s medgivande. Materialet riktar sig inte till personer vars medverkan kräver ytterligare prospekt, registrerings- eller andra åtgärder än vad som följer av svensk rätt. Det åligger var och en att iaktta sådana restriktioner. Materialet får inte distribueras i eller till land där distribution kräver ovan nämnda åtgärder eller strider mot reglering i sådant land. Materialet riktar sig således inte till fysiska eller juridiska personer hemmahörande i USA eller i något annat land där publicering eller tillhandahållande av materialet är förbjudet eller strider mot tillämpliga bestämmelser i landet.
Oaktat detta får SEB tillåta omfördelning av materialet till utvald tredje part i enlighet med gällande avtal. Materialet får inte spridas till fysiska eller juridiska personer som är medborgare eller har hemvist i ett land där sådan spridning är otillåten enligt tillämplig lag eller annan bestämmelse.
Skandinaviska Enskilda Banken AB (publ) är ett publikt aktiebolag och står under tillsyn av Finansinspektionen samt de lokala finansiella tillsynsmyndigheter i varje jurisdiktionen där SEB har filial eller dotterbolag.
Selling down on a ”deal”. Brent crude fell 6.2% last week with accelerated weakness towards the end of the week. Close of the week at $87.33/b and low of the week (and on Friday) of $85.8/b. Brent is falling another 4% this morning to $83.7/b on confirmation by Iran that a MoU text has been reached and that it will be signed on Friday this week.

So what is this ”deal” worth? Talk on the desk here this morning is that it is much like ”putting lipstick on a pig” where Trump has to sell this at home as a victory where ”the SoH has reopened”, the nuclear issue will be ironed out over the coming 60 days (or maybe 600 days?) and US consumers are getting a lower gasoline price and maybe US republicans survives the midterm elections.
The importance for Iran is that it emerges as the defacto winner of this war in the eyes of the non-US public world. That Iran now onwards is the ”ruler of the SoH” (combo of geography and new weapons systems like drones) or more softer: ”the guarantor of safe passage through the SoH”.
Iran doesn’t need nuclear weapons any more. Nuclear deterrence doesn’t work any more. Ukraine has made many attacks deep into Russia without being nuked in return. Plenty of Iranian ballistic rockets blasts over Israel but Iran wasn’t nuked in return.
There is no trust between the US and Iran. We don’t know all the details yet of the MoU. But what we do know is that there is no trust between the US and Iran what so ever. This is probably more like a descriptive text on how they can cooperate in a way where both sides keeps tactical leverage. Neither side makes irreversible concessions. Violations can be punished quickly. Cooperation produces immediate benefits.
This is a fragile structure. It can easily break down. There may be details which cannot be overcome. To be seen on Friday. The US has to show that it is willing put enough force behind managing and restraining Israel versus Hezbollah in Lebanon. We have seen that Netanyahu hasn’t listened all that much to Trump’s directives and wishes. This could be a major obstacle.
A gradual reopening is tactically preferable for Iran. A tactical leverage for Iran right now is that global oil stocks have been drawn down towards painful and increasingly dangerous levels with increasing risks for oil price spikes in mid-July to August. This together with US midterm elections on 3 November gives tactical leverage to Iran. Iran probably doesn’t want to fully give up on that leverage. A rapid, full reopening where global stocks are able to refill over the coming 60 days will significantly erode that leverage. If Iran reinstates a closure of the SoH after 60 days (if talks break down again), then the effect won’t be that impactful in terms of prices and the US midterm elections.
So a gradual and partial reopening where global markets gets the oil they need while they are unable to rebuild stocks could be a practical middle way for both parties. Trump can sell it as ”the SoH has reopened” and get affordable gasoline for US consumers. Iran can sell it as ”the SoH has fully reopened, but there is some friction” so flow is only 60-80% of normal.
Not much real demand destruction below $100/b. What we do know is that there is not much real price pain demand destruction for oil globally at an oil price below $100/b. A lot of demand-shock destruction. Fear. But demand should now come roaring back towards normal with fear for exceptionally high prices now is rapidly receding.
Sudden China demand destruction due to EVs? Bullocks. EV share of total Chinese carpool now around 13%. Share of new sales of EVs has reached 50%. This is a very gradual process. It doesn’t make oil demand fall like a rock over night. When EV new sales share reaches 100%, then the gasoline car pool will contract by some 5-10% per year. But that is only gasoline. Sudden reduction in Chinese oil demand is more about shock and risk.
Chinese crude oil imports will come roaring back. At what price? Today’s ”neutral” oil price is $70/b. That is the five year price which has steadily traded around the $70/b mark over the past 3-4 years. With still a risky picture one would think that China and the rest of the world will be big buyers of oil in the range of $70-85/b.
Global demand will likely snap back towards normal, forecasted demand and growth at such prices.
Physical reopening is a gradual process. The physical and practical reopening of the SoH will likely be gradual rather than sudden. And that probably suites Iran tactically as well.
Brent M1 price versus the Brent 5-yr (today’s ”normal” price)

Market is starting to take US/Iran headlines with a pinch of salt. Brent crude rose $2.8/b yesterday to an official close of $112.1/b. But after that it traded as low as $108.05/b before ending late night at around $109.7/b. Through the day it traded in a range of $106.87 – 112.72/b amid a flurry of news or rumors from Iran and the US. ”US temporary sanctions during negotiations” (falls alarm). ”We will bomb Iran” (not anyhow),… etc. While the market is still fluctuating to this kind of news flow, it is starting to take such headlines with a pinch of salt.
We’ll see. Maybe, maybe not. The Brent M1 contract is trading at $110.2/b this morning which very close to the average ticks through yesterday of $110.4/b.
Trump with bearish, verbal intervention whenever Brent trades above $110/b it seems. What seems to be a pattern is that Trump states something like ”very good negotiations going on with Iran”, ”New leaders in Iran are great,..”, ”Great progress in negotiations,…”, ”Deal in sight,..” etc whenever the Brent M1 contract trades above $110/b. An effort to cool the market. These hot air verbal interventions from Trump used to have a heavy bearish impact on prices, but they now seems to have less and less effect unless they are backed by reality.
As far as we can see there has been no real progress in the negotiations between the US and Iran with both sides still standing by their previous demands.
Iran is getting stronger while the cease fire lasts making a return to war for Trump yet harder. Iran is naturally in constant preparation for a return to war given Trump’s steady threats of bombing Iran again. Iran is naturally doing what ever is possible to prepare for a return to war. And every day the cease fire lasts it is better prepared. This naturally makes it more and more difficult and dangerous for the US to return to warring activity versus Iran as the consequences for energy infrastructure in the Persian Gulf will be more and more severe the longer the cease fire lasts. Israel seems to see it this way as well. That the war is not won and that current frozen state of a cease fire gives Iran opportunity to rebuild military and politically.
Global inventories are drawing down day by day. How much? In the meantime the Strait of Hormuz stays closed. There is varying measures and estimates of how much global inventories are drawing down. Our rough estimate, back of the envelope, is that global inventories are drawing down by at least some 10 mb/d or about 300 mb/d in a balance between loss of supply versus demand destruction. Other estimates we see are a monthly draw of 250-270 mb/d. The IEA only ’measured’ a draw in global observable stocks of 117 mb in April with oil on water rising 53 mb while on shore stocks fell 170 mb. But global stocks are hard to measure with large invisible, unmeasured stocks. As such a back of the envelope approach may be better.
Oil products is what the world is consuming. Oil product prices likely to rise while product stocks fall. Strategic Petroleum Reserves (SPR) are predominantly crude oil. Discharging oil from OECD SPR stocks, a sharp reduction in Chinese crude imports and a reduction in global refinery throughput of 6-7 mb/d has helped to keep crude oil markets satisfactorily supplied. But global inventories are drawing down none the less. And oil products is really what the world is consuming. So if global refinery throughput stays subdued, then demand will eventually have to match the supply of oil products. The likely path forward this summer is a steady draw down in jet fuel, diesel and gasoline. Higher prices for these. Then, if possible, higher refinery throughput and higher usage of crude in response to very profitable refinery margins. And lastly sharper draw in crude stocks and higher prices for these. But some 6 mb/d of oil products used to be exported through the Strait of Hormuz. And it may not be so easy to ramp up refinery activity across the world to compensate. Especially as Ukraine continues to damage Russian refineries as well as Russian crude production and export facilities.
Watch oil product stocks and prices as well as Brent calendar 2027. What to watch for this summer is thus oil product inventories falling and oil product premiums to crude rising. Another measure to watch is the Brent crude 2027 contract as it rises steadily day by day as the Strait of Hormuz stays closed and global oil inventories decline. The latter is close to the highest level since the start of the war and keeps rising.
The Brent M1 contract and the Brent 2027 prices and current price of jet fuel in Europe (ARA). All in USD/b

Our back of the envelope calculation of the global shortage created by the closure of the Strait of Hormuz. Note that 3.5 mb/d of discharge from SPR is also a draw. Note also that ’Forced demand loss’ of 2.5 mb/d is probably temporary and will fall back towards zero as logistics are sorted out leaving ’Price demand loss’ to do the job of balancing the market. Thus a shortfall of at least 9 mb/d created by the closure. More if SPR discharge is included and more if Forced demand loss recedes.

Brent is climbing higher. Front-month is at USD 106.3/bl this morning, close to a weekly high and a USD 9/bl jump from Mondays open. This is the move we flagged as a risk earlier in the week: the market shifting from ”a deal is around the corner” to ”this is going to take longer than we thought”.

Analyst Commodities, SEB
During April, rest-of-year Brent remained remarkably stable around USD 90/bl. A stability which rested on one single assumption: the SoH reopens around 1 May. That assumption is now slowly falling apart.
As we highlighted yesterday: every week of delay beyond 1 May adds (theoretically) ish USD 5/bl to the rest-of-year average, as global inventories draw 100 million barrels per week. i.e., a mid-May reopening implies rest-of-year Brent closer to USD 100/bl, and anything pushing into June or July takes us meaningfully higher.
What’s changed in the last 48 hours:
#1: The US military has formally warned that clearing suspected sea mines from SoH could take up to six months. That is a completely different timescale from what the financial market is pricing. Even a political deal tomorrow does not immediately reopen the strait.
#2: Trump has shifted his tone from urgency to ”strategic patience”. In yesterday’s press conference: ”Don’t rush me… I want a great deal.” The market is reading this as a president no longer feeling pressured by timelines, with the naval blockade running in the background.
#3: So far, the military activity is escalating, not de-escalating. Axios reports Iran is laying more mines in SoH. The US 3rd carrier strike group (USS George H.W. Bush) is arriving with two countermine vessels. Trump yesterday ordered the US Navy to destroy any Iranian boats caught laying mines. While CNN reports that the Pentagon is actively drawing up plans to strike Iranian SoH capabilities and individual Iranian military leaders if the ceasefire collapses. i.e., NOT a attitude consistent with an imminent deal!
Spot crude and product prices eased off the early-April highs on a combination of system rerouting and deal optimism. Both now weakening. Goldman estimates April Gulf output is reduced by 14.5 mbl/d, or 57% of pre-war supply, a number that keeps getting worse the longer this drags on.
Demand-side adaptation is ongoing: S. Korea has cut its Middle East crude dependence from 69% to 56% by pulling more from the Americas and Africa, and Japan is kicking off a second round of SPR releases from 1 May. But SPRs are finite.
Ref. to the negotiations, we should not bet on speed. The current Iranian leadership is dominated by genuine hardliners willing to absorb economic pain and run the clock to extract concessions. That is not a setup for a rapid resolution. US/Israeli media briefings keep framing the delay as ”internal Iranian divisions”, the reality is more complicated and points toward weeks and months, not days.
Our point is that the complexity is large, and higher prices have only just started (given a scenario where the negotiations drag out in time). The market spent April leaning on the USD 90/bl rest-of-year assumption; that case is diminishing by the hour. If ”early May reopening” is replaced by ”June, July or later” over the next week or two, both crude and products have meaningful room to reprice higher from here. There is a high risk being short energy and betting on any immediate political resolution(!).


Vattenfalls och Industrikrafts kärnkraftsbolag Videberg Kraft har valt Rolls-Royce SMR
Selling down on a ”deal”

Sommarväder skapar prisrally på elbörsen
Oil product price pain is set to rise as the Strait of Hormuz stays closed into summer

