Analys
SEB – Jordbruksprodukter, vecka 6 2012
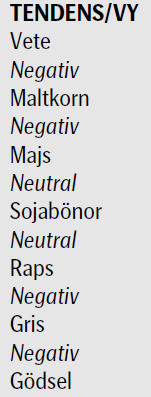
 Vi har hållit på skrivandet och utskicket av det här veckobrevet för att få med intrycken av WASDE-rapporten som släpptes av USDA klockan 14:30 igår torsdag. Rapporten, vars siffror nog förefaller vara övermåttan försiktigt justerade med anledning av torkan i Argentina, togs emot med något av en axelryckning av marknaden, men med tydliga prisnedgångar för alla grödor, mest för vete, där utgående lager justerades upp.
NOAA rapporterar i sin senaste synopsis att La Niña torde övergå till ”neutrala” ENSO-förållanden under perioden mars till maj 2012. Detta skulle betyda att hotet mot torka för norra halvklotets skörd kraftigt har minskat. Detta är klart negativ information för marknaderna för majs, vete, sojabönor och raps.
Vete
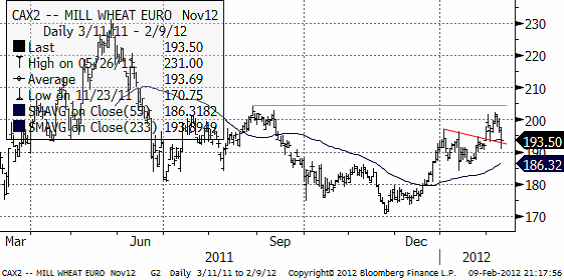
Terminspriset på Matif-vete (november) föll kraftigt till 193.50 euro / ton efter WASDE-rapporten
Marknadens oro över ett ryskt exportförbud har kvarstått under veckan och de blandade budskap som kommit från Rysslands regering har orsakat en viss förvirring.
Rysslands premiärminister Viktor Zubkov sa att med tanke på att spannmålsskörden reviderats till 93,9 miljoner ton så har prognosen för spannmålsexporten 2011/12 höjts till 27 miljoner ton och att det därmed inte skulle finnas något behov av att införa restriktioner, vilket hade diskuterats till följd av den höga exporttakt som har rått.
 Det uttalandet kom strax efter att regeringskällor sa att Zubkov inte skulle meddela något beslut under fredagen och det i sin tur kom efter att vice premiärministern inte kunde uttala sig i frågan under torsdagen som tidigare angivits. De dubbla budskapen började dock redan på tisdagen då den biträdande jordbruksministern sade att ett beslut om export restriktioner skulle tas i mitten på februari, för att sedan skifta till att Zubkov skulle meddela beslutet under torsdagen.
Den snabba exporttakten av Rysslands spannmål har varit regerings främsta orosmoln genom att den skulle kunna driva upp de inhemska priserna kraftigt med en ökad matinflation och högre kostnader för animalie producenter som följd. Men eftersom spannmålen för export från gårdar och silos i närheten av hamnarna vid Svarta havet börjar sina så tvingas handlarna att se sig om efter spannmål längre in i landet vilket innebär långväga transporter på landets järnvägsnät som också bidrar till högre kostnader.
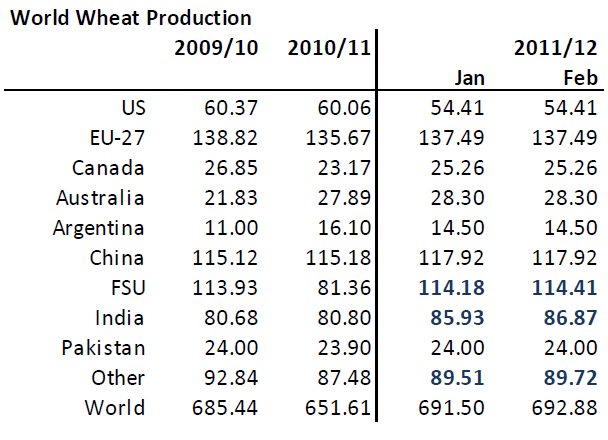
Det kalla vädret har också varit en bidragande faktor till oro. I Ryssland verkar dock snötäcket skydda de flesta grödor medan det kalla vädret i Svarta havsområdet kan komma att orsaka skador på framförallt korn och raps. Trots det kalla vädret i Europa så är påverkan av rapsgrödorna i Tyskland och Frankrike dock mindre oroande. I Ukraina är problemen desto större med effekten av kylan på de grödor som redan har drabbats av en oerhört torr höst och där vissa delar av landet har fått mycket snö, på sina ställen upp till 50 cm, medan andra delar av landet helt saknar snötäcke grödorna därmed exponeras för den extrema kylan. Med en mild höst och en ”varm vinter” kan det hända att grödorna blir något mindre vinterhärdiga än förväntat men det verkar dock som att de flesta europeiska länder har fått ett skyddande snötäcke mot kylan, även om det på vissa ställen vore önskvärt med ett större snödjup. Ännu är det dock för tidigt att sia om eventuella konsekvenser. Nedan ser vi WASDE-rapportens estimat för global veteproduktion.
Indien, Kazakstan och Marocko har justerat upp sina produktionsestimat, vilket slår igenom i en högre global produktion.
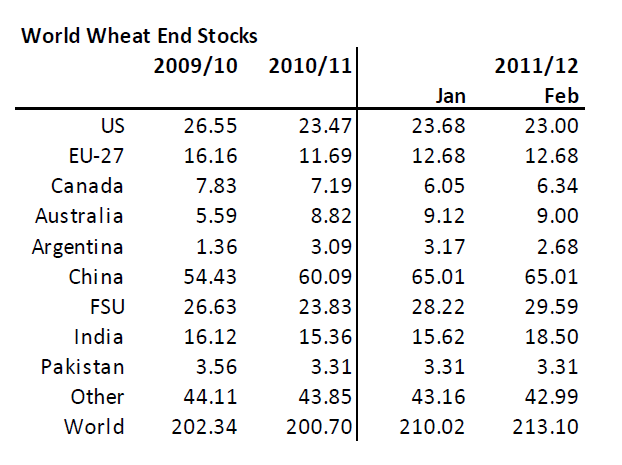
På konsumtionssidan är det främst Indien, som beräknas konsumera 1.6 mt mindre än i januari. Konsumtionen i EU och resten av världen är oförändrad, trots ett mycket högre pris än förra månaden. Men summa summarum – vi har trots allt ett högre utgående lager av vete än förra månaden.
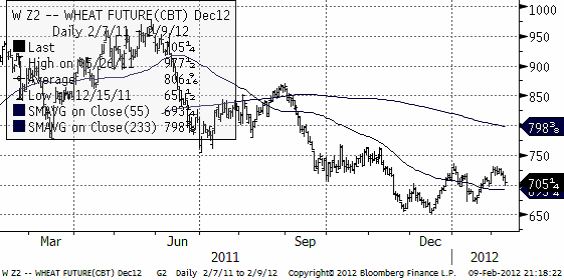
Vi vet sedan tidigare att USDA har en tendens att fortsätta med justeringar ”åt samma håll”. Vi kan alltså förvänta oss högre uppjusteringarna av utgående lager att fortsätta, månad för månad, i WASDE-rapporterna och detta bör understödja en trend av sjunkande priser på vete. Nedan ser vi kursdiagrammet på decemberkontraktet på CBOT.
Maltkorn
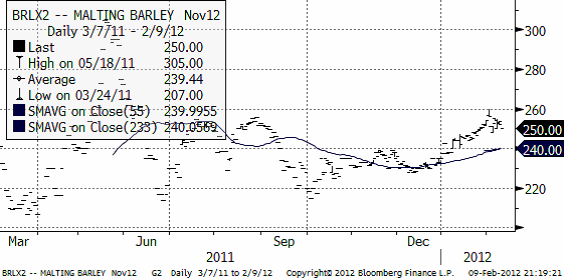
Maltkornsmarknaden har behållit sin styrka relativt andra spannmål med novemberleverans på Matif på 250 euro per ton.
Potatis
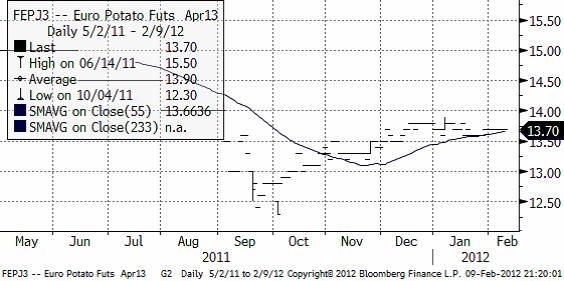
Nedan ser vi kursdiagrammet på europeisk potatis, som handlas på Eurex; terminen avser leverans april 2013.
Majs
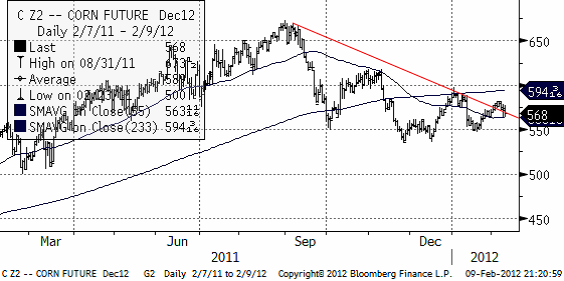
Majspriset föll något lite när börsen öppnade efter USDA-rapporten, som vi ser i kursdiagrammet för decemberkontraktet nedan:
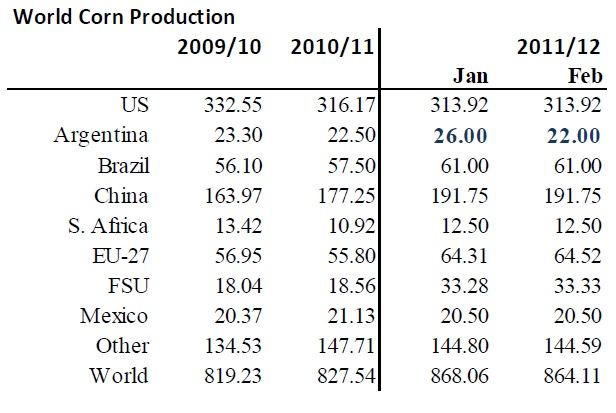
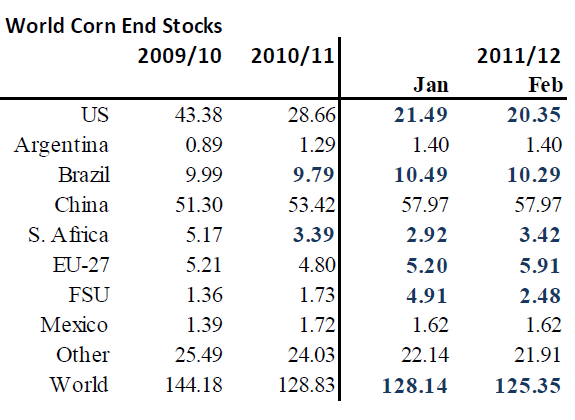
WASDE-rapporten visade dock på lägre produktion och lägre – rekordlåga utgående lager.
USDA justerade ner skörden i Argentina i spåren av torkan, från 26 mt till 22 mt. 22 mt ligger på den högsta nivån som vi sett inhemska Argentinska prognosmakare förutspå, som ligger i intervallet 18 – 22 mt. Produktionen skulle alltså ha kunnat minska med 8 mt istället för de 4 mt som USDA förutspår nu i sin februarirapport. USDA gör ingen justering för Brasiliens skörd, vilket stämmer någorlunda bra med vädret där.
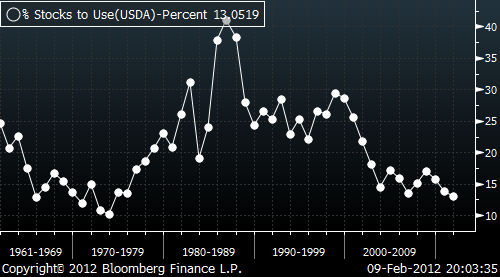
USA:s utgående lager som anges i WASDE:n ligger på den lägsta nivån sedan 1975/76 och utgående lager på global basis i förhållande till konsumtion ligger på 1973 års nivå, som vi ser i nedanstående diagram.
Med ett förmodligen större bortfall från produktion och export från Argentina, måste detta kompenseras med lägre lager i USA. Det kan alltså bli ett riktigt lågt utgående lager i USA – och på global basis.
Å andra sidan väntas amerikanska bönder välja att så majs på bekostnad av sojabönor i vår. Ett högre pris på majs skulle öka denna tendens.
Sojabönor
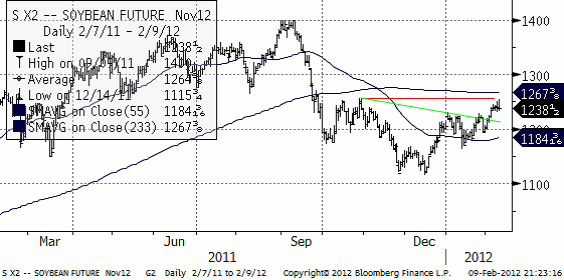
Priset på sojabönor föll efter WASDE-rapporten i linje med de andra grödorna. Tekniskt är situationen intressant. Det finns de, bland annat SEB:s tekniska analytiker, som pekar på att det sedan september bildats en omvänd ”head-and-shoulders” formation, där ”nacklinjen” (grön linje) bröts i månadsskiftet januari – februari. Den skulle signalera en förestående potentiell prisuppgång till 1400 cent / bushel. Prisuppgången har dock stoppats av motståndet som utgörs av toppen som noterades i slutet av oktober. Skulle vi få en uppgång över 1267 får vi anse att vi har en teknisk köpsignal.
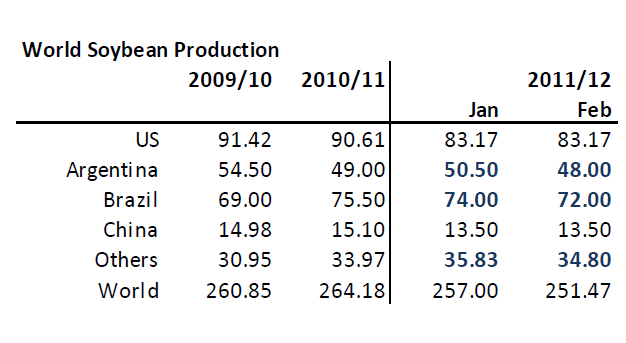
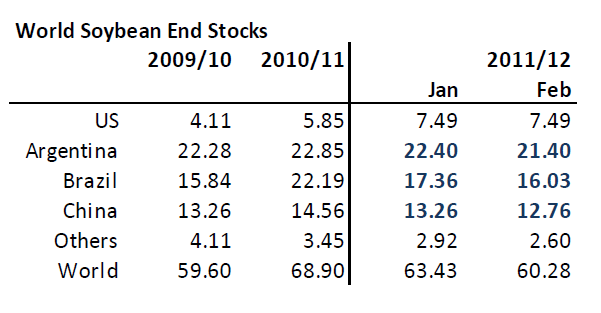
Nedan ser vi USDA:s produktionsestimat från WASDE-rapporten igår.
Argentinas och Brasiliens skörd sänks med 2.5 mt respektive 2 mt i spåren av torkan. Bland ”Others” hittar vi Paraguay och Uruguay och de justeras ner 1 mt också.
Utgående lager sänks 3 mt. Argentinas skörd ligger i det övre intervallet av inhemska skördeestimat. Det känns som om man tagit i lite i underkant i justeringen och det är vanligt att USDA gör så. Vi kan alltså vänta oss att det ligger ytterligare en nedjustering sparad till nästa månad.
Vi är negativa ur tekniskt perspektiv de närmaste tre månaderna.
Raps
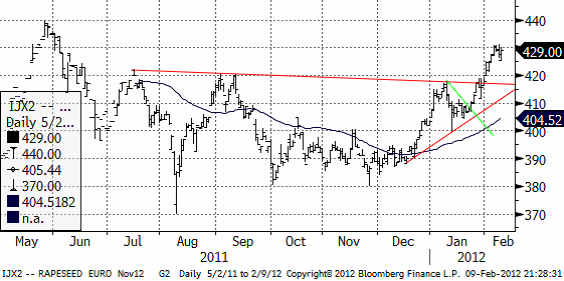
Priset på raps har gått starkt och hejdats på 430, uppenbarligen ett motstånd. Prisuppgången dit är ungefär lika lång från 410 – botten på rekylen i uppgången från 390. Det är 20 euro i båda rusningarna uppåt. Det är vanligt att man ser den typen av rörelser, där det är lika långt från ”halvvägskonsolideringen” uppåt som nedåt. Detta skulle indikera att den kortsiktiga uppgången är över. Vid 440 finns ett större motstånd, där priset vände ner i maj-juni förra året. Detta är alltså ett högt pris i ett historiskt perspektiv och säljvärt, tror vi.
Mjölk
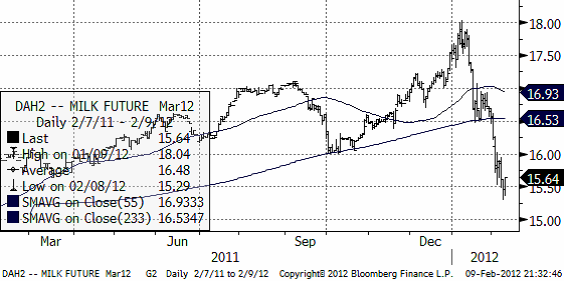
Nedan ser vi priset på marskontraktet på flytande mjölk (kontakt avräknat mot USDA:s prisindex). Priset har som vi ser fallit kraftigt i februari. Marknaden är ”översåld” och ”borde” få en kortsiktig rekyl uppåt den närmaste veckan.
Gris
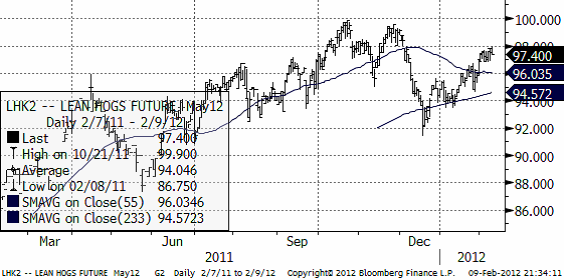
Priset på lean hogs har segat sig uppåt och befinner sig nu återigen i sälj-området. Nedan ser vi terminspriset för leverans i maj.
Valutor
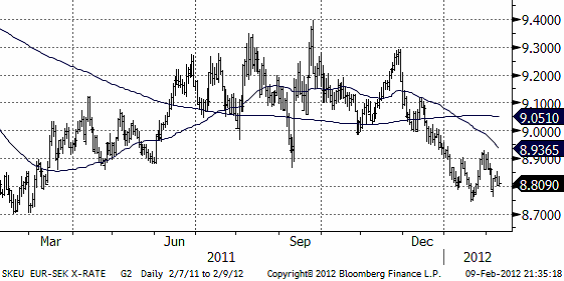
EURSEK som fanns stöd på 8.80 kr och steg till 8.90 har vänt ner igen och ska sannolikt testa 8.80 igen.
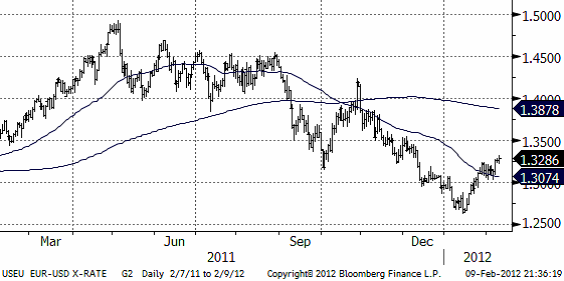
EURUSD har vänt upp och har precis lämnat en konsolidering – kanske halvvägs på väg upp mot 1.35 dollar.
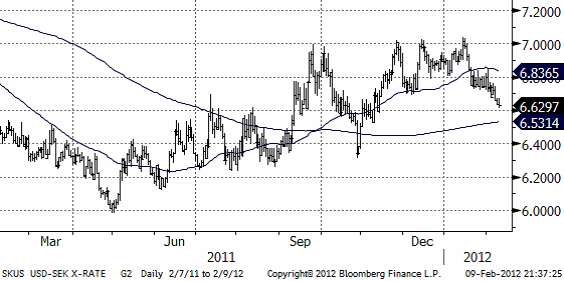
USDSEK har fallit av och tycks vara på väg nedåt.
[box]SEB Veckobrev Jordbruksprodukter är producerat av SEB Merchant Banking och publiceras i samarbete och med tillstånd på Råvarumarknaden.se[/box]
Disclaimer
The information in this document has been compiled by SEB Merchant Banking, a division within Skandinaviska Enskilda Banken AB (publ) (“SEB”).
Opinions contained in this report represent the bank’s present opinion only and are subject to change without notice. All information contained in this report has been compiled in good faith from sources believed to be reliable. However, no representation or warranty, expressed or implied, is made with respect to the completeness or accuracy of its contents and the information is not to be relied upon as authoritative. Anyone considering taking actions based upon the content of this document is urged to base his or her investment decisions upon such investigations as he or she deems necessary. This document is being provided as information only, and no specific actions are being solicited as a result of it; to the extent permitted by law, no liability whatsoever is accepted for any direct or consequential loss arising from use of this document or its contents.
About SEB
SEB is a public company incorporated in Stockholm, Sweden, with limited liability. It is a participant at major Nordic and other European Regulated Markets and Multilateral Trading Facilities (as well as some non-European equivalent markets) for trading in financial instruments, such as markets operated by NASDAQ OMX, NYSE Euronext, London Stock Exchange, Deutsche Börse, Swiss Exchanges, Turquoise and Chi-X. SEB is authorized and regulated by Finansinspektionen in Sweden; it is authorized and subject to limited regulation by the Financial Services Authority for the conduct of designated investment business in the UK, and is subject to the provisions of relevant regulators in all other jurisdictions where SEB conducts operations. SEB Merchant Banking. All rights reserved.
Analys
Crude oil soon coming to a port near you

Rebounding along with most markets. But concerns over solidity of Gaza peace may also contribute. Brent crude fell 0.8% yesterday to $61.91/b and its lowest close since May this year. This morning it is bouncing up 0.9% to $62.5/b along with a softer USD amid positive sentiment with both equities and industrial metals moving higher. Concerns that the peace in Gaza may be less solid than what one might hope for also yields some support to Brent. Bets on tech stocks are rebounding, defying fears of trade war. Money moving back into markets. Gold continues upwards its strong trend and a softer dollar helps it higher today as well.

US crude & products probably rose 5.6 mb last week (API) versus a normal seasonal decline of 2.4 mb. The US API last night partial and thus indicative data for US oil inventories. Their data indicates that US crude stocks rose 7.4 mb last week, gasoline stocks rose 3.0 mb while Distillate stocks fell 4.8 mb. Altogether an increase in commercial crude and product stocks of 5.6 mb. Commercial US crude and product stocks normally decline by 2.4 mb this time of year. So seasonally adjusted the US inventories rose 8 mb last week according to the indicative numbers by the API. That is a lot. Also, the counter seasonal trend of rising stocks versus normally declining stocks this time of year looks on a solid pace of continuation. If the API is correct then total US crude and product stocks would stand 41 mb higher than one year ago and 6 mb higher than the 2015-19 average. And if we combine this with our knowledge of a sharp increase in production and exports by OPEC(+) and a large increase in oil at sea, then the current trend in US oil inventories looks set to continue. So higher stocks and lower crude oil prices until OPEC(+) switch to cuts. Actual US oil inventory data today at 18:00 CET.
US commercial crude and product stocks rising to 1293 mb in week 41 if last nights indicative numbers from API are correct.

Crude oil soon coming to a port near you. OPEC has lifted production sharply higher this autumn. At the same time demand for oil in the Middle-East has fallen as we have moved out of summer heat and crude oil burn for power for air-conditioning. The Middle-East oil producers have thus been able to lift exports higher on both accounts. Crude oil and condensates on water has shot up by 177 mb since mid-August. This oil is now on its way to ports around the world. And when they arrive, it will likely help to lift stocks onshore higher. That is probably when we will lose the last bit of front-end backwardation the the crude oil curves. That will help to drive the front-month Brent crude oil price down to the $60/b line and revisit the high $50ies/b. Then the eyes will be all back on OPEC+ when they meet in early November and then again in early December.
Crude oil and condensates at sea have moved straight up by 177 mb since mid-August as OPEC(+) has produced more, consumed less and exported more.

Analys
The Mid-East anchor dragging crude oil lower

When it starts to move lower it moves rather quickly. Gaza, China, IEA. Brent crude is down 2.1% today to $62/b after having traded as high as $66.58/b last Thursday and above $70/b in late September. The sell-off follows the truce/peace in Gaze, a flareup in US-China trade and yet another bearish oil outlook from the IEA.

A lasting peace in Gaze could drive crude oil at sea to onshore stocks. A lasting peace in Gaza would probably calm down the Houthis and thus allow more normal shipments of crude oil to sail through the Suez Canal, the Red Sea and out through the Bab-el-Mandeb Strait. Crude oil at sea has risen from 48 mb in April to now 91 mb versus a pre-Covid normal of about 50-60 mb. The rise to 91 mb is probably the result of crude sailing around Africa to be shot to pieces by the Houthis. If sailings were to normalize through the Suez Canal, then it could free up some 40 mb in transit at sea moving onshore into stocks.
The US-China trade conflict is of course bearish for demand if it continues.
Bearish IEA yet again. Getting closer to 2026. Credibility rises. We expect OPEC to cut end of 2025. The bearish monthly report from the IEA is what it is, but the closer we get to 2026, the more likely the IEA is of being ball-park right in its outlook. In its monthly report today the IEA estimates that the need for crude oil from OPEC in 2026 will be 25.4 mb/d versus production by the group in September of 29.1 mb/d. The group thus needs to do some serious cutting at the end of 2025 if it wants to keep the market balanced and avoid inventories from skyrocketing. Given that IEA is correct that is. We do however expect OPEC to implement cuts to avoid a large increase in inventories in Q1-26. The group will probably revert to cuts either at its early December meeting when they discuss production for January or in early January when they discuss production for February. The oil price will likely head yet lower until the group reverts to cuts.
Dubai: The Mid-East anchor dragging crude oil lower. Surplus emerging in Mid-East pricing. Crude oil prices held surprisingly strong all through the summer. A sign and a key source of that strength came from the strength in the front-end backwardation of the Dubai crude oil curve. It held out strong from mid-June and all until late September with an average 1-3mth time-spread premium of $1.8/b from mid-June to end of September. The 1-3mth time-spreads for Brent and WTI however were in steady deterioration from late June while their flat prices probably were held up by the strength coming from the Persian Gulf. Then in late September the strength in the Dubai curve suddenly collapsed. Since the start of October it has been weaker than both the Brent and the WTI curves. The Dubai 1-3mth time-spread now only stands at $0.25/b. The Middle East is now exporting more as it is producing more and also consuming less following elevated summer crude burn for power (Aircon) etc.
The only bear-element missing is a sudden and solid rise in OECD stocks. The only thing that is missing for the bear-case everyone have been waiting for is a solid, visible rise in OECD stocks in general and US oil stocks specifically. So watch out for US API indications tomorrow and official US oil inventories on Thursday.
No sign of any kind of fire-sale of oil from Saudi Arabia yet. To what we can see, Saudi Arabia is not at all struggling to sell its oil. It only lowered its Official Selling Prices (OSPs) to Asia marginally for November. A surplus market + Saudi determination to sell its oil to the market would normally lead to a sharp lowering of Saudi OSPs to Asia. Not yet at least and not for November.
The 5yr contract close to fixed at $68/b. Of importance with respect to how far down oil can/will go. When the oil market moves into a surplus then the spot price starts to trade in a large discount to the 5yr contract. Typically $10-15/b below the 5yr contract on average in bear-years (2009, 2015, 2016, 2020). But the 5yr contract is usually pulled lower as well thus making this approach a moving target. But the 5yr contract price has now been rock solidly been pegged to $68/b since 2022. And in the 2022 bull-year (Brent spot average $99/b), the 5yr contract only went to $72/b on average. If we assume that the same goes for the downside and that 2026 is a bear-year then the 5yr goes to $64/b while the spot is trading at a $10-15/b discount to that. That would imply an average spot price next year of $49-54/b. But that is if OPEC doesn’t revert to cuts and instead keeps production flowing. We think OPEC(+) will trim/cut production as needed into 2026 to prevent a huge build-up in global oil stocks and a crash in prices. But for now we are still heading lower. Into the $50ies/b.
Analys
More weakness and lower price levels ahead, but the world won’t drown in oil in 2026

Some rebound but not much. Brent crude rebounded 1.5% yesterday to $65.47/b. This morning it is inching 0.2% up to $65.6/b. The lowest close last week was on Thursday at $64.11/b.

The curve structure is almost as week as it was before the weekend. The rebound we now have gotten post the message from OPEC+ over the weekend is to a large degree a rebound along the curve rather than much strengthening at the front-end of the curve. That part of the curve structure is almost as weak as it was last Thursday.
We are still on a weakening path. The message from OPEC+ over the weekend was we are still on a weakening path with rising supply from the group. It is just not as rapidly weakening as was feared ahead of the weekend when a quota hike of 500 kb/d/mth for November was discussed.
The Brent curve is on its way to full contango with Brent dipping into the $50ies/b. Thus the ongoing weakening we have had in the crude curve since the start of the year, and especially since early June, will continue until the Brent crude oil forward curve is in full contango along with visibly rising US and OECD oil inventories. The front-month Brent contract will then flip down towards the $60/b-line and below into the $50ies/b.
At what point will OPEC+ turn to cuts? The big question then becomes: When will OPEC+ turn around to make some cuts? At what (price) point will they choose to stabilize the market? Because for sure they will. Higher oil inventories, some more shedding of drilling rigs in US shale and Brent into the 50ies somewhere is probably where the group will step in.
There is nothing we have seen from the group so far which indicates that they will close their eyes, let the world drown in oil and the oil price crash to $40/b or below.
The message from OPEC+ is also about balance and stability. The world won’t drown in oil in 2026. The message from the group as far as we manage to interpret it is twofold: 1) Taking back market share which requires a lower price for non-OPEC+ to back off a bit, and 2) Oil market stability and balance. It is not just about 1. Thus fretting about how we are all going to drown in oil in 2026 is totally off the mark by just focusing on point 1.
When to buy cal 2026? Before Christmas when Brent hits $55/b and before OPEC+ holds its last meeting of the year which is likely to be in early December.
Brent crude oil prices have rebounded a bit along the forward curve. Not much strengthening in the structure of the curve. The front-end backwardation is not much stronger today than on its weakest level so far this year which was on Thursday last week.

The front-end backwardation fell to its weakest level so far this year on Thursday last week. A slight pickup yesterday and today, but still very close to the weakest year to date. More oil from OPEC+ in the coming months and softer demand and rising inventories. We are heading for yet softer levels.

-

 Nyheter3 veckor sedan
OPEC+ missar produktionsmål, stöder oljepriserna
-

 Nyheter4 veckor sedan
Ett samtal om guld, olja, fjärrvärme och förnybar energi
-

 Nyheter2 veckor sedan
Goldman Sachs höjer prognosen för guld, tror priset når 4900 USD
-

 Nyheter2 veckor sedan
Guld nära 4000 USD och silver 50 USD, därför kan de fortsätta stiga
-

 Analys3 veckor sedan
Are Ukraine’s attacks on Russian energy infrastructure working?
-

 Nyheter2 veckor sedan
Blykalla och amerikanska Oklo inleder ett samarbete
-

 Nyheter4 veckor sedan
Guldpriset uppe på nya höjder, nu 3750 USD
-

 Nyheter2 veckor sedan
Ett samtal om guld, olja, koppar och stål


