

Analys
SEB Jordbruksprodukter, 29 april 2013


 Sådden av majs i USA har inte kunnat ske på grund av den sena våren. Deadline, som anses vara den 10 maj närmar sig. Väderleksprognosen visar dock ett ”fönster” av gott väder, där sådden kan ske innan dess. De närmaste dagarnas väderutveckling kommer att ha ett avgörande inflytande över prisutvecklingen. Den kinesiska fågelinfluensan har sänkt konsumtionen av kyckling med upp till 80%. Det sänker efterfrågan på sojabönor i världen. Vi tror alltjämt på sjunkande priser på alla jordbruksprodukter. Grispriset i USA testar dock tekniska motståndsnivåer, möjligen just beroende på fågelinfluensan i Kina.
Odlingsväder
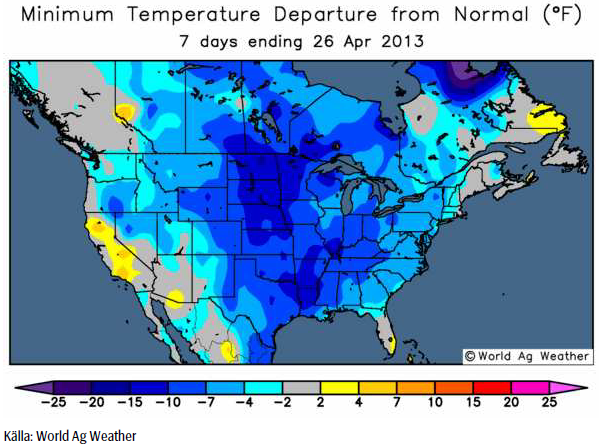
USA och Kanada var fortsatt kallare än normalt i veckan som gick. Prognosen för de kommande 7 dagarna är att detta ska bestå. Därefter för dag 7 till 14 väntas varmare väder, i synnerhet i Kanada.
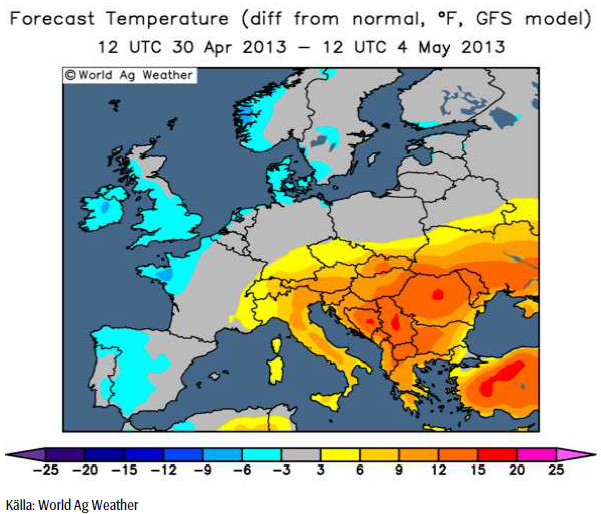
I ett område från Tyskland och österut har varit varmare än normalt den senaste veckan. Prognosen för de närmaste 7 dagarna är normal temperatur i centrala och norra Europa. Däremot väntas det bli varmare än normalt i Italien, på Balkan och i Stillahavsområdet.
I Australien är det fortsatt väldigt torrt inför sådden som börjar snart.
MARS
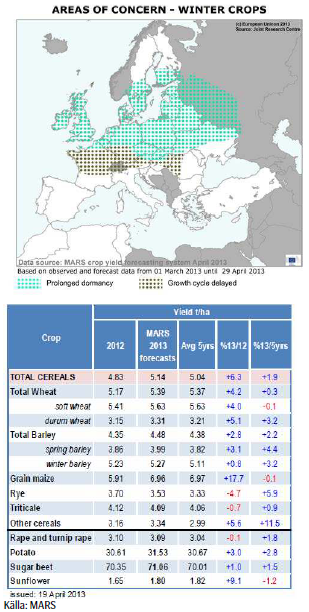
Enligt den senaste rapporten från EU-kommissionens MARS-enhet så har den kyliga starten på våren i Europa, som har fått Mars månad att noteras som en av de kallaste någonsin, orsakat en kraftig försening – mer än en månad – gällande höstgrödornas utveckling, och dessutom försenat vårsådden (med undantag av Medelhavsområdet och runt Svarta Havet). Förseningar är särskilt tydliga i Storbritannien, men även i Tyskland och Frankrike. Trots detta gör de inga justeringar i sitt estimat för avkastning med motiveringen att det är för tidigt att uttala sig om en avkastning under genomsnittet.
Vete
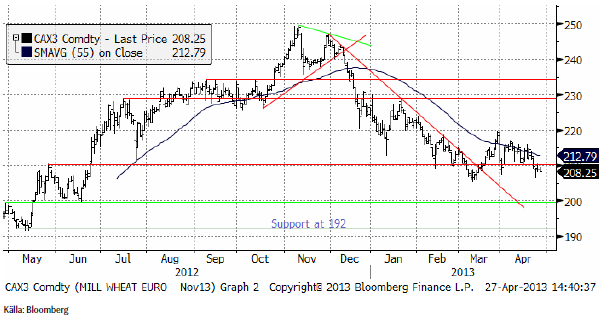
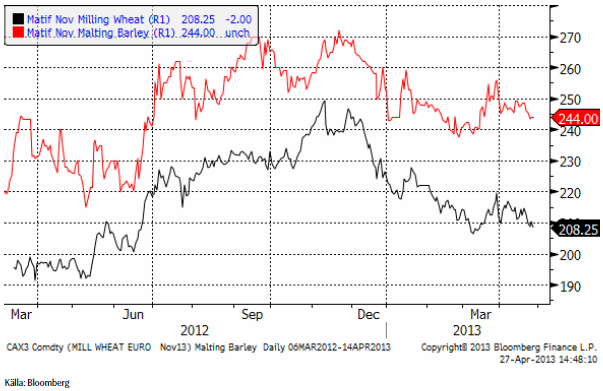
Priset på november (2013) har hållit sig över 210 euro, som nu återigen fungerar som ett tekniskt stöd. Frågan är om priset ska bryta uppåt och testa 230.
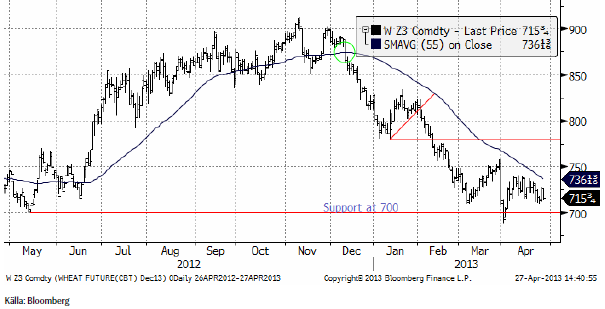
Decemberkontraktet på CBOT ser mindre ”bullish” ut än grafen för Matif-vetet. Så som Chicagovetet handlats förefaller ett test av 700 cent på nedsidan vara troligare.
I onsdags drabbades Oklahoma av frost och det fick priset att gå upp temporärt.
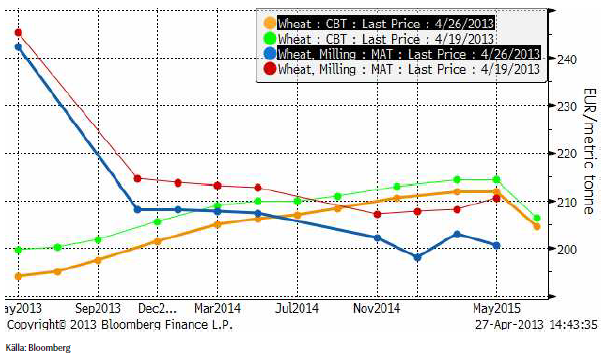
Ser vi på den senaste veckan förändring av terminskurvorna, ser vi att priserna gått ner både i Europa och i USA och ungefär lika mycket oavsett löptid, undantaget gammal skörd. Weetabix har slutat producera vissa frukostflingor i väntan på ny skörd. Det saknas helt enkelt brittiskt vete av gammal skörd.
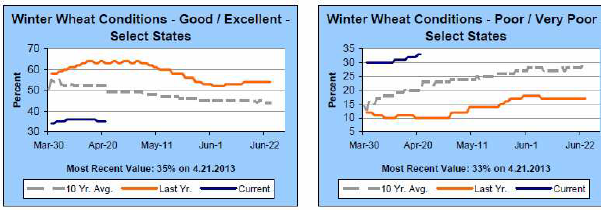
Måndagens crop condition-rapport ser vi i sammanfattning nedan.
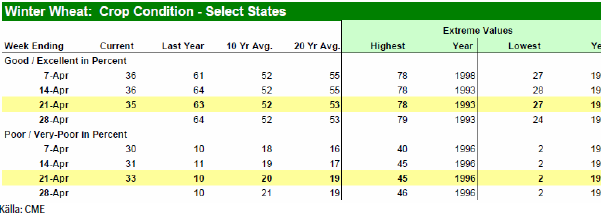
Måndagens Crop Progress rapport från USDA visar att tillståndet för det amerikanska höstvetet har försämrats något. Sammantaget för de 18 största höstvete producerande så var 35% klassat som ”good/excellent” per den 21 januari, en marginell nedjustering från förra veckans 36%. Höstvete klassat som ”poor/very poor” justeras upp till 33% från förra veckans 31% och är en kategori som har ökat i bl.a Kansas och Colorado, men som har minskat kraftigt i South Dakota, Nebraska och Texas – även om klassificeringen ”good/excellent” i dessa stater fortfarande är urusla.
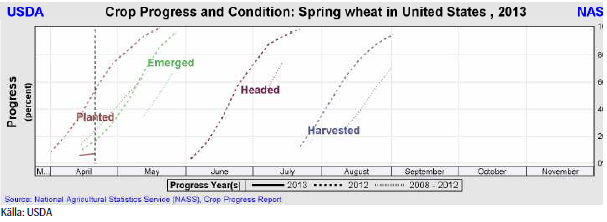
Sådden av vårvete gör minimala framsteg då endast 7% är avklarad i de 6 största staterna, vilket är en marginell ökning från förra veckans 6% och att jämföra med 52% för ett år sedan och det femåriga genomsnittet på 24%. Kallt väder och även snö har hindrat fältaktiviteter i vissa delar och hos topproducenten North Dakota har man ännu inte påbörjat sådden.
Ett tredje tecken på att skörden ligger efter i år är att bara 8% av höstvetet har gått i ax. Förra året den här tiden var det 42%.
StatsCanada skriver den 24 april att vårvetearealen ökar 14.4% till 19.4 miljoner acres. Det var mycket mer än marknaden väntat sig. Durum-arealen väntas också öka för tredje året i rad till 5.1 miljoner acres. I USDA:s prospective plantingsrapport för en månad sedan visades en minskning av arealen. Kanadensarna går alltså åt andra hållet.
Vi fortsätter att tro på sidledes eller lägre priser. Uppgångar bör ses som tillfällen att sälja.
Maltkorn
Priset på maltkorn med leverans i november har fortsatt att visa mer styrka än höstvetet / kvarnvetet på Matif.
StatsCanada rapporterar en korn-areal som är 2.2% mindre än förra året. Havrearealen ökar med 18.4%.
Lokala estimat pekar på väsentligt lägre sådd av maltkorn i Tyskland. På grund av den kalla och våta våren väntas arealen uppgå till 360,000 ha. Det är 40% mindre än förra året. Tyskland är EU:s största konsument av maltkorn och landet väntas behöva öka importen till 1 mt under 2013/14. Evergrain, den schweiziska mäklaren, estimerar Tysklands import i år (2012/13) till 265,000 ton.
Sådden av korn i USA ligger i linje med vad som är normalt. Tvärt emot vad som rapporterats på t ex Agrimoney. 23% är sått. Det var 43% förra året så här års, men 24% är det normala.
Det finns viss ”uppsidesrisk” för maltkornspriset med tanke på Kanadas och Tysklands mindre väntade skördar. Den senaste utvecklingen vi skriver om ovan, kan vi inte riktigt se fullt ut i starkare prisutveckling på maltkorn jämfört med vete.
Majs
Majspriset (december 2013) bröt stödet på 530 cent, rekylerade upp och slutade veckan nedåt igen. Trenden är stadigt nedåtriktad.
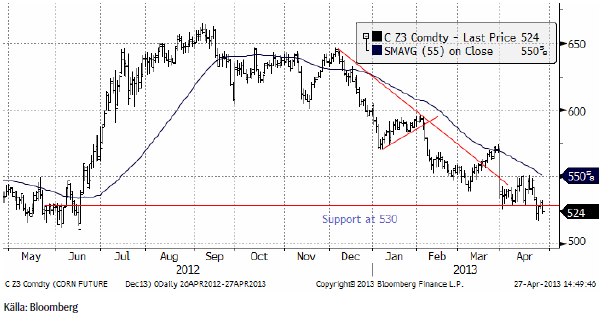
Sådden ligger kraftigt efter i USA. Den 19 april var endast 4% sått. Förra året var det 28% och det tidiga året 2010 var det 50%. En åkerareal stor som Belgien och Holland tillsammans borde ha varit sådd, men har inte blivit det på grund av det kalla vädret. Sådden har ännu inte börjats i den största producerande staten, Iowa, och inte heller i Colorado, Michigan, Minnesota, Nebraska, North Dakota, South Dakota eller i Wisconsin. I Illinois, Indiana och Ohio är sådden endast avklarad till 1%.
Nedan ser vi såddens framåtskridande i USA. 6-årsintervallet sträcker sig från 2007 till 2012.
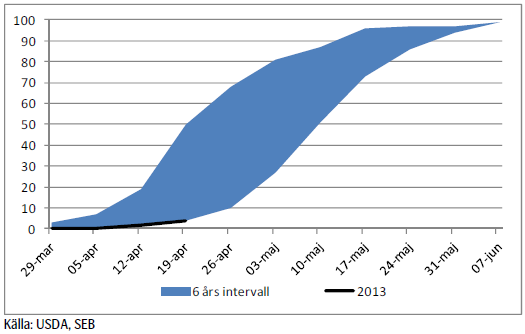
Utvecklingen sker exakt lika långsamt som år 2008, ett år där priserna trots allt föll kraftigt. På grund av att vädret i veckan inte varit perfekt, kan man inte vänta sig att sådden kommit upp till mer än 6-10% nu i rapporten som kommer på måndagskvällen. Därefter väntas, som vi såg ovan under ”odlingsväder” bättre väder komma, vilket ger ett tillfälle att så. Sås majsen för sent, den 10 maj betraktas som en slags deadline, får varje försening en negativ effekt på avkastningen. De närmaste dagarnas väder är alltså avgörande för priset.
Väderleksrapporten säger att det kommer att gå bra. Därför tror vi alltjämt på fallande priser.
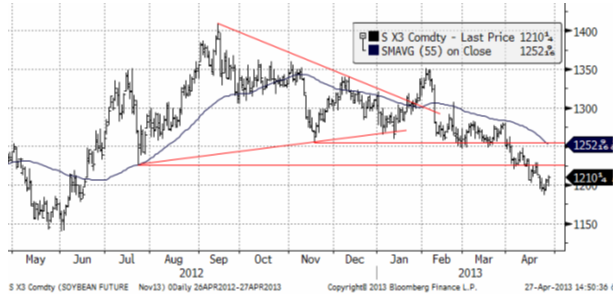
Sojabönor
Sojabönorna (november 2013) ligger i en stadigt sjunkande pristrend. Amerikans sådd av soja har inte kommit igång alls. Förra året var 6% sått redan. Den kinesiska fågelinfluensan har ökat i nyhetsflödet och det fjäderfä i Kina är närmast osäljbart vad vi kan förstå från nyhetsrapporteringen.
Den argentinska skörden är 56% klar, men bönderna håller inne med sin vara. BAGE estimerar skörden till 48.5 mt (USDA har den senat på 51.5 mt). Den argentinska staten har just klubbat igenom lagar som reducerar möjligheten för företag och privatpersoner att värna sin egendom gentemot staten.
Statsinkomsterna kommer till stor del från exportskatter på soja. Den argentinska peson handlas på gatan till halva den officiella växlingskursen. Presidentens socialistiska och värdenihilistiska politik ser ut att föra landet mot en mörk framtid.
Väderutvecklingen i USA och dämpad efterfrågan från Kina gör att vi tror att priset kommer att fortsätta falla och rekommenderar en såld position i sojabönor. 1150 cent är nästa målkurs.
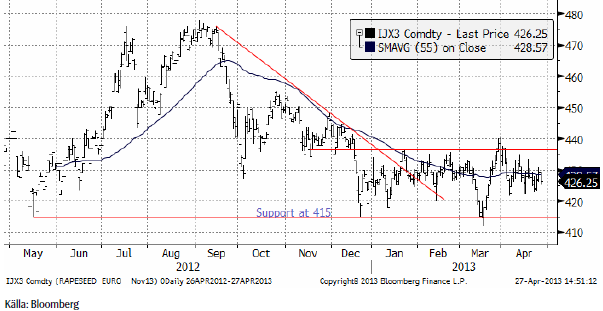
Raps
Rapspriset (november 2013) ligger kvar på någorlunda hög nivå. En anledning är att skörden i Europa väntas bli ca 1 månad senare än normalt.
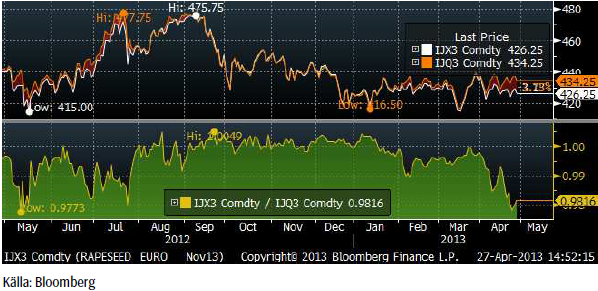
Förra veckan skrev vi om ”spreaden” mellan augustikontraktet och novemberkontraktet. Den prisskillnaden ligger fortsatt på en onormal nivå, som indikerar att många väntar sig ett högre pris på augusti (som för gammal skörd) än ny-skörds-kontraktet november. Vi tror att vädret kommer att fortsätta förbättras, så att augusti är säljvärt.
StatsCanada rapporterade i onsdags den 24 april att kanadensiska lantbrukare kommer att så 19.1 miljoner acres med canola. Det är 11% mindre än förra året och den första minskningen sedan 2006.
Det är ändå svårt att se att rapsmarknaden ska hålla sig så stark, medan priset på sojabönor faller. Vi fortsätter att rekommendera en såld position i raps. Den börjar dessutom bygga upp fallhöjd om och när ett brott av den tekniska stödnivån inträffar.
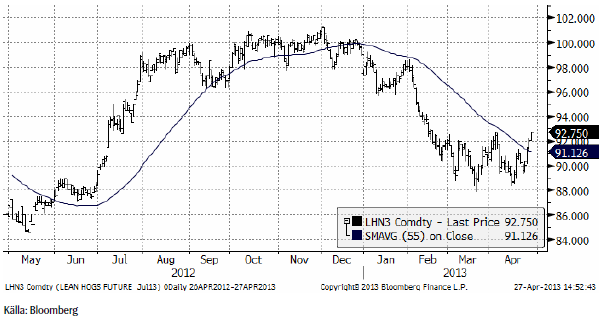
Gris
Grispriset (September 13) testar nu den nedåtgående trenden. Beroende på hur marknaden går i veckan, kan vi få en köpsignal från den tekniska analysen.
Mjölk
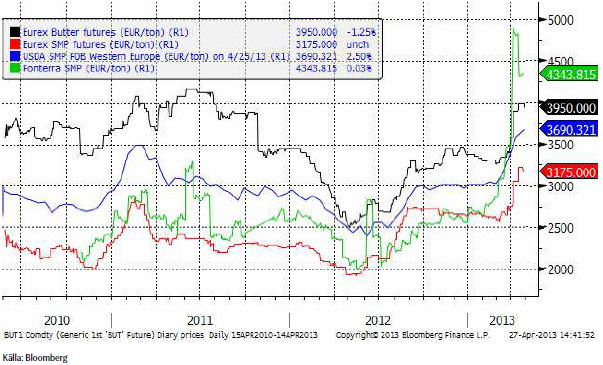
Eurexmarknaden gick ner i veckan som gick – på de korta kontrakten. De långa steg däremot både på SMP och smör.
I kursdiagrammet nedan ser vi priserna på Fonterras SMP, USDA:s prisnotering på SMP i Europa och Eurexbörsens pris, samt Eurex pris på smör. Alla priser är angivna i euro per ton.
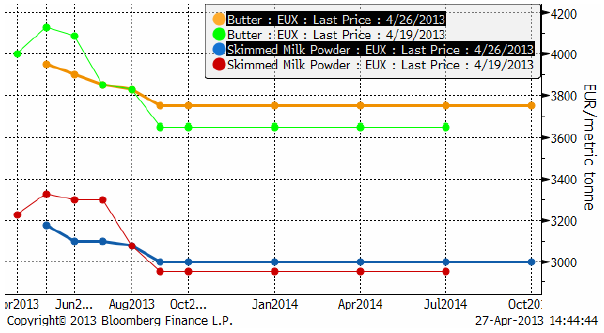
Nedan ser vi terminskurvorna för smör och skummjölkspulver på Eurex i fredags vid börsens stängning och veckan innan.
SEB Commodities erbjuder ett litet ”prova-på” kontrakt som består av 0.5 ton Eurex-smör och 0.9 ton Eurex SMP. Ett paket som motsvarar 10 ton flytande mjölkråvara. Just nu är det underliggande värdet på ett sådant kontrakt drygt 33 000 kronor. Vi garanterar börspris eller bättre.
Den som vill följa priset på SMP på Eurex gör det via länken:
www.eurexchange.com/exchange-en/products/com/agr/14016/
Vi tycker att den här haussen på världsmarknaden skapar ett bra tillfälle att säkra via terminer.
[box]SEB Veckobrev Jordbruksprodukter är producerat av SEB Merchant Banking och publiceras i samarbete och med tillstånd på Råvarumarknaden.se[/box]
Disclaimer
The information in this document has been compiled by SEB Merchant Banking, a division within Skandinaviska Enskilda Banken AB (publ) (“SEB”).
Opinions contained in this report represent the bank’s present opinion only and are subject to change without notice. All information contained in this report has been compiled in good faith from sources believed to be reliable. However, no representation or warranty, expressed or implied, is made with respect to the completeness or accuracy of its contents and the information is not to be relied upon as authoritative. Anyone considering taking actions based upon the content of this document is urged to base his or her investment decisions upon such investigations as he or she deems necessary. This document is being provided as information only, and no specific actions are being solicited as a result of it; to the extent permitted by law, no liability whatsoever is accepted for any direct or consequential loss arising from use of this document or its contents.
About SEB
SEB is a public company incorporated in Stockholm, Sweden, with limited liability. It is a participant at major Nordic and other European Regulated Markets and Multilateral Trading Facilities (as well as some non-European equivalent markets) for trading in financial instruments, such as markets operated by NASDAQ OMX, NYSE Euronext, London Stock Exchange, Deutsche Börse, Swiss Exchanges, Turquoise and Chi-X. SEB is authorized and regulated by Finansinspektionen in Sweden; it is authorized and subject to limited regulation by the Financial Services Authority for the conduct of designated investment business in the UK, and is subject to the provisions of relevant regulators in all other jurisdictions where SEB conducts operations. SEB Merchant Banking. All rights reserved.

Hesitant today. Brent jumped to an intraday high of $66.36/b yesterday after having touched an intraday low of $60.07/b on Monday as Indian and Chinese buyers cancelled some Russian oil purchases and instead redirected their purchases towards the Middle East due to the news US sanctions. Brent is falling back 0.4% this morning to $65.8/b.

It’s our strong view that the only sensible thing is to sell this rally. In all Trump’s unpredictability he has become increasingly predictable. Again and again he has rumbled about how he is going to be tough on Putin. Punish Putin if he won’t agree to peace in Ukraine. Recent rumbling was about the Tomahawk rockets which Trump threatened on 10 October and 12 October to sell/send to Ukraine. Then on 17 October he said that ”the U.S. didn’t want to give away weapons (Tomahawks) it needs”.
All of Trump’s threats towards Putin have been hot air. So far Trump’s threats have been all hot air and threats which later have evaporated after ”great talks with Putin”. After all these repetitions it is very hard to believe that this time will be any different. The new sanctions won’t take effect before 21. November. Trump has already said that: ”he was hoping that these new sanctions would be very short-lived in any case”. Come 21. November these new sanctions will either evaporate like all the other threats Trump has thrown at Putin before fading them. Or the sanctions will be postponed by another 4 weeks or 8 weeks with the appearance that Trump is even more angry with Putin. But so far Trump has done nothing that hurt Putin/Russia. We can’t imagine that this will be different. The only way forward in our view for a propre lasting peace in Ukraine is to turn Ukraine into defensive porcupine equipped with a stinging tail if need be.
China will likely stand up to Trump if new sanctions really materialize on 21 Nov. Just one country has really stood up to Trump in his tariff trade war this year: China. China has come of age and strength. I will no longer be bullied. Trump upped tariffs. China responded in kind. Trump cut China off from high-end computer chips. China put on the breaks on rare earth metals. China won’t be bullied any more and it has the power to stand up. Some Chinese state-owned companies like Sinopec have cancelled some of their Russian purchases. But China’s Foreign Ministry spokesperson Guo Jiakun has stated that China “oppose unilateral sanctions which lack a basis in international law and authorization of the UN Security Council”. Thus no one, not even the US shall unilaterally dictate China from whom they can buy oil or not. This is yet another opportunity for China to show its new strength and stand up to Trump in a show of force. Exactly how China choses to play this remains to be seen. But China won’t be bullied by over something as important as its oil purchases. So best guess here is that China will defy Trump on this. But probably China won’t need to make a bid deal over this. Firstly because these new sanctions will either evaporate as all the other threats or be postponed once we get to 21 November. Secondly because the sanctions are explicit towards US persons and companies but only ”may” be enforced versus non-US entities.
Sanctions is not a reduction in global supply of oil. Just some added layer of friction. Anyhow, the new sanctions won’t reduce the supply of Russian crude oil to the market. It will only increase the friction in the market with yet more need for the shadow fleet and ship to ship transfer of Russian oil to dodge the sanctions. If they materialize at all.
The jump in crude oil prices is probably due to redirections of crude purchases to the Mid-East and not because all speculators are now turned bullish. Has oil rallied because all speculators now suddenly have turned bullish? We don’t think so. Brent crude has probably jumped because some Indian and Chinese oil purchasers of have redirected their purchases from Russia towards the Mid-East just in case the sanctions really materializes on 21 November.
Parts of the Brent crude curve dipping into the high $50ies/b. Brent crude fell 2.3% over the week to Friday. It closed the week at $61.29/b, a slight gain on the day, but also traded to a low of $60.14/b that same day and just barely avoided trading into the $50ies/b. This morning it is risk-on in equities which seems to help industrial metals a little higher. But no such luck for oil. It is down 0.8% at $60.8/b. This week looks set for Brent crude to dip its feet in the $50ies/b. The Brent 3mth contract actually traded into the high $50ies/b on Friday.
The front-end backwardation has been on a weakening foot and is now about to fully disappear. The lowest point of the crude oil curve has also moved steadily lower and lower and its discount to the 5yr contract is now $6.8/b. A solid contango. The Brent 3mth contract did actually dip into the $50ies/b intraday on Friday when it traded to a low point of $59.93/b.
More weakness to come as lots of oil at sea comes to ports. Mid-East OPEC countries have boosted exports along with lower post summer consumption and higher production. The result is highly visibly in oil at sea which increased by 17 mb to 1,311 mb over the week to Sunday. Up 185 mb since mid-August. On its way to discharge at a port somewhere over the coming month or two.
Don’t forget that the oil market path ahead is all down to OPEC+. Remember that what is playing out in the oil market now is all by design by OPEC+. The group has decided that the unwind of the voluntary cuts is what it wants to do. In a combination of meeting demand from consumers as well as taking back market share. But we need to remember that how this plays out going forward is all at the mercy of what OPEC+ decides to do. It will halt the unwinding at some point. It will revert to cuts instead of unwind at some point.
A few months with Brent at $55/b and 40-50 US shale oil rigs kicked out may be what is needed. We think OPEC+ needs to see the exit of another 40-50 drilling rigs in the US shale oil patches to set US shale oil production on a path to of a 1 mb/d year on year decline Dec-25 to Dec-26. We are not there yet. But a 2-3 months period with Brent crude averaging $55/b would probably do it.
Oil on water increased 17 mb over the week to Sunday while oil in transit increased by 23 mb. So less oil was standing still. More was moving.

Crude oil floating storage (stationary more than 7 days). Down 11 mb over week to Sunday

The lowest point of the Brent crude oil curve versus the 5yr contract. Weakest so far this year.

Crude oil 1mth to 3mth time-spreads. Dubai held out strongly through summer, but then that center of strength fell apart in late September and has been leading weakness in crude curves lower since then.

Rebounding along with most markets. But concerns over solidity of Gaza peace may also contribute. Brent crude fell 0.8% yesterday to $61.91/b and its lowest close since May this year. This morning it is bouncing up 0.9% to $62.5/b along with a softer USD amid positive sentiment with both equities and industrial metals moving higher. Concerns that the peace in Gaza may be less solid than what one might hope for also yields some support to Brent. Bets on tech stocks are rebounding, defying fears of trade war. Money moving back into markets. Gold continues upwards its strong trend and a softer dollar helps it higher today as well.
US crude & products probably rose 5.6 mb last week (API) versus a normal seasonal decline of 2.4 mb. The US API last night partial and thus indicative data for US oil inventories. Their data indicates that US crude stocks rose 7.4 mb last week, gasoline stocks rose 3.0 mb while Distillate stocks fell 4.8 mb. Altogether an increase in commercial crude and product stocks of 5.6 mb. Commercial US crude and product stocks normally decline by 2.4 mb this time of year. So seasonally adjusted the US inventories rose 8 mb last week according to the indicative numbers by the API. That is a lot. Also, the counter seasonal trend of rising stocks versus normally declining stocks this time of year looks on a solid pace of continuation. If the API is correct then total US crude and product stocks would stand 41 mb higher than one year ago and 6 mb higher than the 2015-19 average. And if we combine this with our knowledge of a sharp increase in production and exports by OPEC(+) and a large increase in oil at sea, then the current trend in US oil inventories looks set to continue. So higher stocks and lower crude oil prices until OPEC(+) switch to cuts. Actual US oil inventory data today at 18:00 CET.
US commercial crude and product stocks rising to 1293 mb in week 41 if last nights indicative numbers from API are correct.

Crude oil soon coming to a port near you. OPEC has lifted production sharply higher this autumn. At the same time demand for oil in the Middle-East has fallen as we have moved out of summer heat and crude oil burn for power for air-conditioning. The Middle-East oil producers have thus been able to lift exports higher on both accounts. Crude oil and condensates on water has shot up by 177 mb since mid-August. This oil is now on its way to ports around the world. And when they arrive, it will likely help to lift stocks onshore higher. That is probably when we will lose the last bit of front-end backwardation the the crude oil curves. That will help to drive the front-month Brent crude oil price down to the $60/b line and revisit the high $50ies/b. Then the eyes will be all back on OPEC+ when they meet in early November and then again in early December.
Crude oil and condensates at sea have moved straight up by 177 mb since mid-August as OPEC(+) has produced more, consumed less and exported more.


Sell the rally. Trump has become predictable in his unpredictability

Gruvbolaget Boliden överträffade analytikernas förväntningar

Australien och USA investerar 8,5 miljarder USD för försörjningskedja av kritiska mineraler
Brent crude set to dip its feet into the high $50ies/b this week

Vad guldets uppgång egentligen betyder för världen

Goldman Sachs höjer prognosen för guld, tror priset når 4900 USD

Blykalla och amerikanska Oklo inleder ett samarbete

Guld nära 4000 USD och silver 50 USD, därför kan de fortsätta stiga

Leading Edge Materials är på rätt plats i rätt tid

Nytt prisrekord, guld stiger över 4000 USD
-
 Nyheter3 veckor sedan
Goldman Sachs höjer prognosen för guld, tror priset når 4900 USD
-
 Nyheter4 veckor sedan
Blykalla och amerikanska Oklo inleder ett samarbete
-
 Nyheter3 veckor sedan
Guld nära 4000 USD och silver 50 USD, därför kan de fortsätta stiga
-
 Nyheter2 veckor sedan
Leading Edge Materials är på rätt plats i rätt tid
-
 Nyheter3 veckor sedan
Nytt prisrekord, guld stiger över 4000 USD
-

 Nyheter4 veckor sedan
Ett samtal om guld, olja, koppar och stål
-
Analys4 veckor sedan
OPEC+ will likely unwind 500 kb/d of voluntary quotas in October. But a full unwind of 1.5 mb/d in one go could be in the cards
-

 Nyheter4 veckor sedan
Neptune Energy bekräftar enorma litiumfyndigheter i Tyskland