

Analys
SEB Jordbruksprodukter, 28 januari 2013
 Torkan i USA fortsätter att skapa oro för USA:s skörd i år. Samtidigt fortsätter vädret i Brasilien, världens nya kornbod, att vara gynnsamt. Vi gör inga ändringar av rekommendationer den här veckan. Majs ska man hålla ett öga på. Om priset bryter nedåt i veckan som kommer kan en sådan prisnedgång få en förlängning. Den kan i så fall smitta av sig på vetemarknaden och sojamarknaden.
Odlingsväder
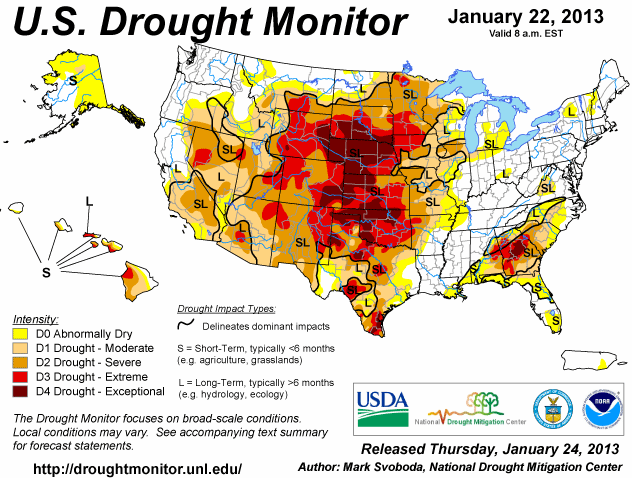
Torkan i USA håller i sig, som vi ser i den senaste ”Drought Monitor”, som publicerades i torsdags. Sedan förra veckan har torkan förbättrats marginellt.
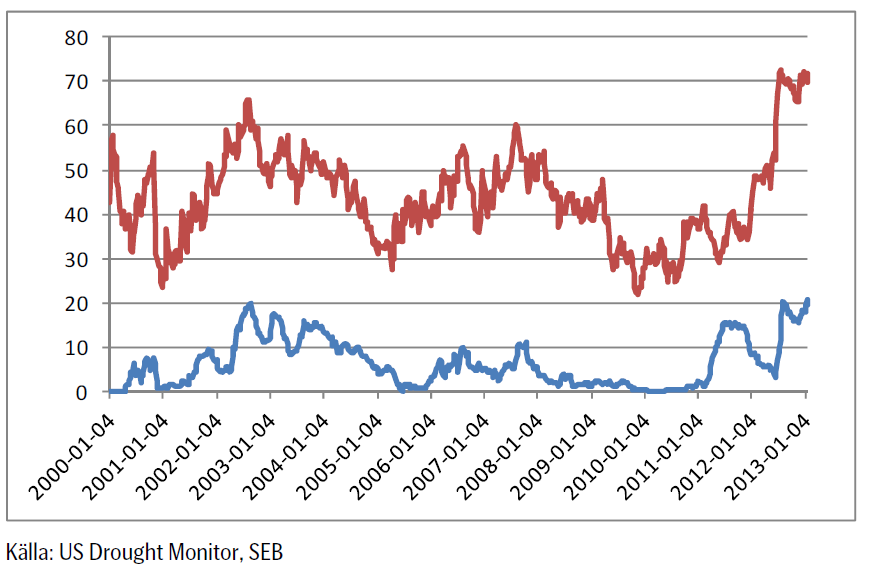
Andelen av USA:s yta som är drabbad av torka minskade marginellt i veckan fram till den rapport som kom förra veckan. Den övre röda linjen visar hur många procent av USA:s areal som är drabbad av någon form av torka. Den nedre blå linjen visar hur många procent som är drabbat av de två värsta varianterna av torka ”extreme” och ”exceptional”.
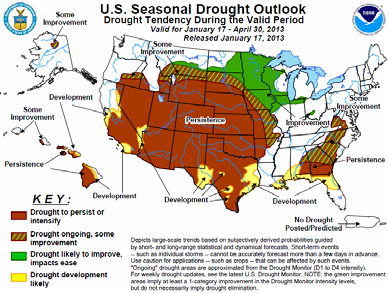
Nedan ser vi prognosen fram till den sista april / första maj, alltså till dess sådden av majs och sojabönor börjar. Alla färgade (ej vita) områden innebär att torkan håller i sig. Det lär alltså vara tämligen torrt när såningsmaskinerna dammar ut på fälten.
Över hela Europa har det kommit nederbörd den senaste tiden, vilket gynnar vintervetet. I västra Ryssland / Ukraina likaså, utom i de allra mest södra delarna. Även Turkiet och nordvästra Afrika har fått ordentlig nederbörd. I nordvästra Afrika avslutade detta en torr period på en månad. Det har också regnat i Sydostasien, vilket gynnar odlingen av ris. I Argentina har det kommit lättare nederbörd i de södra delarna.
De torra delarna av världen är norra Argentina, som är ett viktigt odlingsområde. Australien är rekordtorrt och så USA, som vi sett ovan är nästan rekordtorrt, nästan som 1939, det sista året av ”Dust Bowl” på 1930-talet.
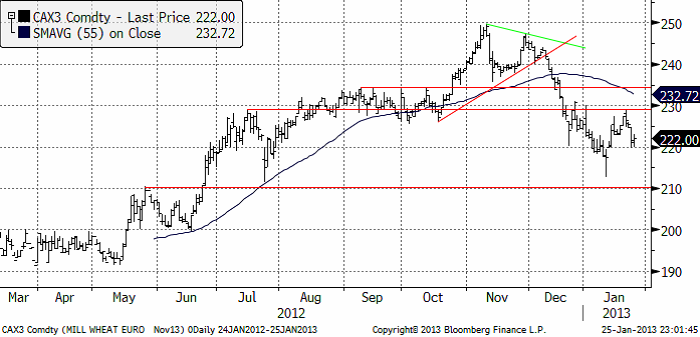
Vete
Priset på november (2013) kontraktet nådde upp till den tekniska motståndslinjen på 229 euro per ton, där det fanns tillräckligt med säljare för att trycka ner priset till 220. Veckan stängde på 222 euro.
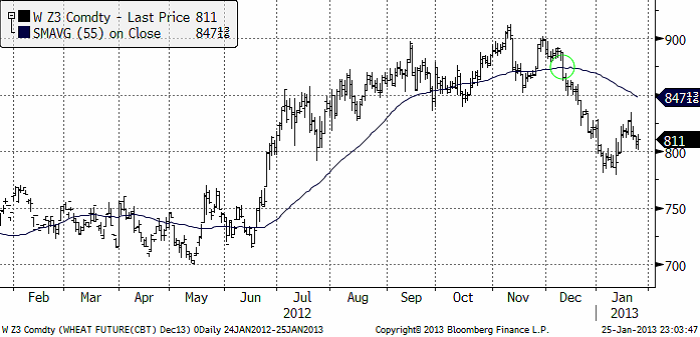
Nedan ser vi decemberkontraktet på CBOT. Uppgången i januari framträder nu allt mer som vi beskrev den i förra veckobrevet. Som en rekyl mot en fallande trend. Marknaden fann dock stöd i torsdags och fredags på 800 cent (en jämn siffra; jämna siffror är naturliga platser att vänta sig stöd och motstånd). Om måndagens handel öppnar uppåt, får vi ta det som tecken på ytterligare en rekyl uppåt, mot trenden. Omvänt, om marknaden öppnar veckans handel med att sjunka under 800 cent, eller gör det senare i veckan, ska vi tolka det som att marknaden kan vara beredd på att fortsätta den nedåtgående trenden.
Det gick rykten i veckan om att Ryssland skulle ta bort importskatten på 5% på vetet. Det har kommit rapporter om brist på vete från Ryssland. I fredags gick dock Rysslands vice premiärminister ut och dementerade att landet skulle ta bort importskatten. Förmodligen är det tullsamarbetet med spannmålsrika Kazakstan som hindrar detta. Till bilden av spannmålsbrist i Ryssland kan fogas nyheten om att den ryska Spannmålsorganisationen skrev av 8% av vintervetet då detta inte grott. De sade också i veckan att 7% sannolikt skadas pga bristen på skyddande snötäcke i kölden. Det ser ut som om Ryssland skulle behöva importera ett par ton.
EU:s vete tar slut den 24 juli med USDA:s prognos för utgående lager. EU:s export har däremot varit ännu högre än USDA räknat med. Därför måste EU:s höga exporttakt resten av säsongen ligga 13% lägre än hittills för att hålla USDA:s prognos, som knappast kan bli lägre, eftersom lagret i praktiken nästan innebär att det är tomt på sina håll.
Fundamentalt ser det alltså ganska oroligt ut. Den globala vetesituationen kan utvecklas både åt det bättre hållet, eller åt det sämre. Just nu ser det ut tämligen oroväckande ut och vi kan trots det höga priset inte rekommendera sälj. Vi fortsätter med neutral rekommendation.
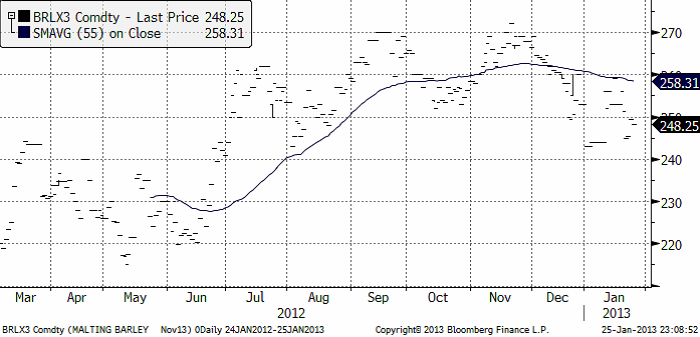
Maltkorn
November 2013-kontraktet föll under veckans oroliga handel från 253 till 248.25 euro per ton. Maltkornet gick därmed ner – samtidigt som vetet steg.
Potatis
Potatispriset för leverans i april nästa år (2014) föll marginellt från 15.90 förra veckan till 15.80 i fredags vid stängning.
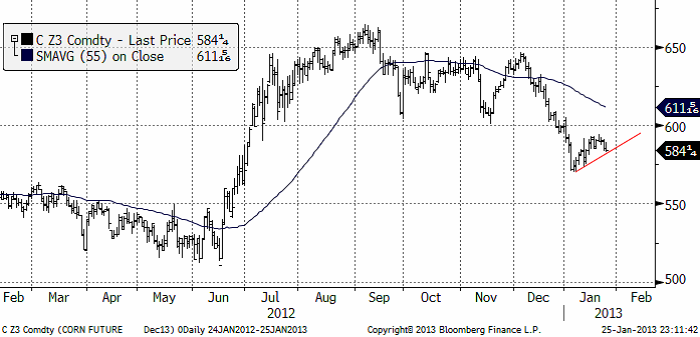
Majs
Majspriset (december 2013) fortsatte sin rekyl uppåt, men slutade veckan med prisnedgångar. Priset ligger nu precis på rekylens tekniska stöd. Om marknaden börjar veckan med att falla, bryts stödet och vi får anse rekylen överstökad. Då finns potential att testa den föregående bottennoteringen från januari på 570 cent. Nästa stöd finns i så fall på 550 cent.
Sådden i Argentina är ännu inte klar, därför att det har varit för torrt. Normalt sett börjar majsen blomma i januari. Den engelska termen är ”silking”, som beskriver mer hur majsen ser ut när den blommar. Effekten tolkas motstridigt av BAGE och regeringen i Argentina, där regeringen är mer avslappnad och frikostig med exportlicenser. Jag tror man ska tolka detta med vetskapen om den allmänna kortsiktighet som präglar landets styrning.
I övrigt väntas rekordstor areal (mitt i torkan i USA, vilket ger enorm osäkerhet). Hur det här kommer att utveckla sig får vi tolka en dag i taget. Den tekniska analysen blir viktig i detta. Just nu ligger som ovan nämnt, priset precis på en stödlinje. Bryts den nedåt i veckan, får vi tolka detta som en kortisktig säljsignal. I annat fall får vi hålla oss neutrala.
Sojabönor
Sojabönorna (november 2013) var i veckan uppe på ett pris över motståndslinjen från toppen i september.
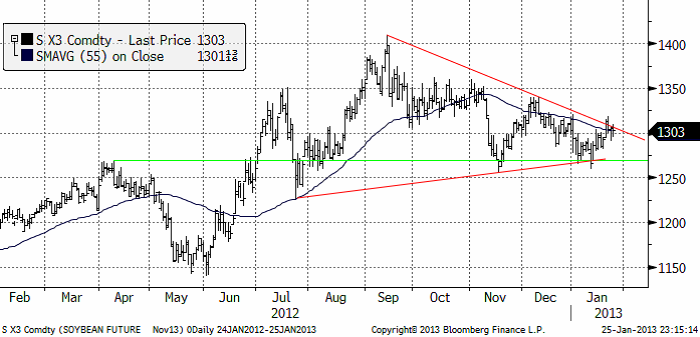
USA:s export ligger över förra årets. Argentinas export ligger dock efter. En tolkning är att bönderna behåller lager som en inflationshedge. Även här får vi ta marknadens utveckling en dag i taget. Den tekniska analysen säger just nu ingenting. Så vi får vänta i neutralt läge.
Raps
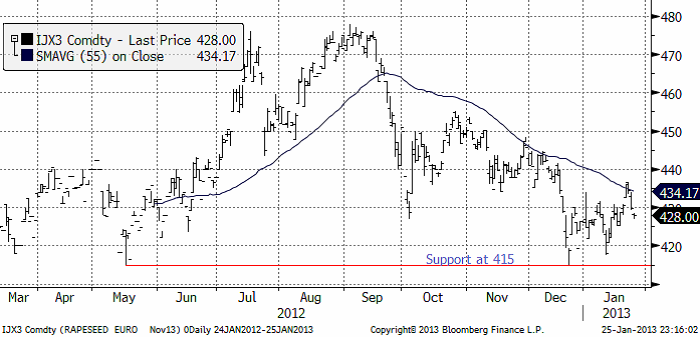
Rapspriset (november 2013) fortsatte upp i början av veckan, men vände sedan ner. Tekniskt ser diagrammet ut som rörelsen sedan december är en rekyl i en fallande marknad. Vi fortsätter därför med säljrekommendationen.
Gris
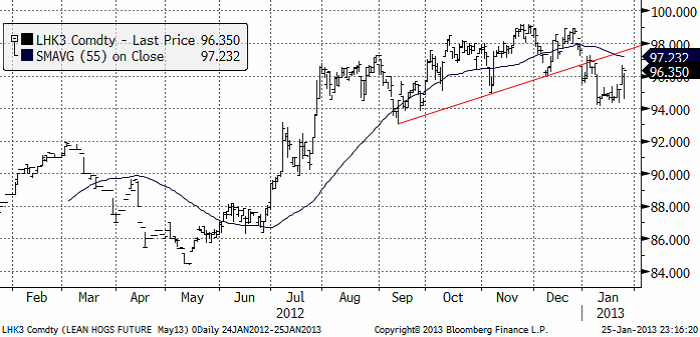
Grispriset (Maj 13), amerikansk Lean Hogs, har rekylerat uppåt efter brottet nedåt av stödlinjen vid årsskiftet. Rekylen uppåt följer ett klassiskt mönster. Den är ett säljtillfälle.
Mjölk
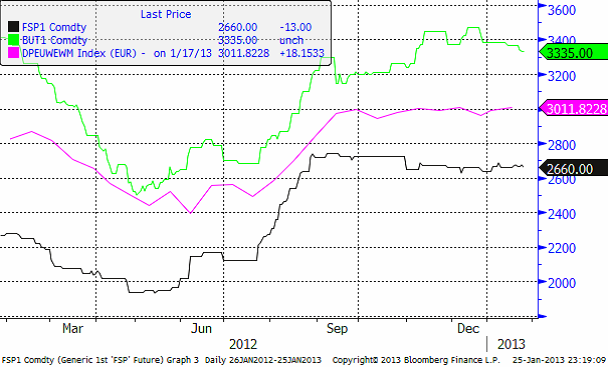
I diagrammet nedan ser vi tre kurvor.Den gröna linjen är priset på skummjölkspulver i euro per ton på Eurex-börsen. Den blå är priset på smör på Eurex börsen. Priserna på Eurex anges i euro per ton.
Slutligen så den gröna linjen. Den visar priset på helmjölkspulver (WMP) FOB Västeuropa. Källan är USDA och priserna uppdateras varannan vecka. Vi ser att WMP-priset legat stabilt det fjärde kvartalet förra året, med en liten nedgång mot slutet av året. 2013 har dock börjat med en liten prisuppgång.
Det börsbaserade priset i svenska kronor beräknas med formeln:

där
BUT = priset på smör i euro per ton
SMP = priset på skummjölkspulver i euro per ton
FX = växelkursen för EURSEK.
EURSEK
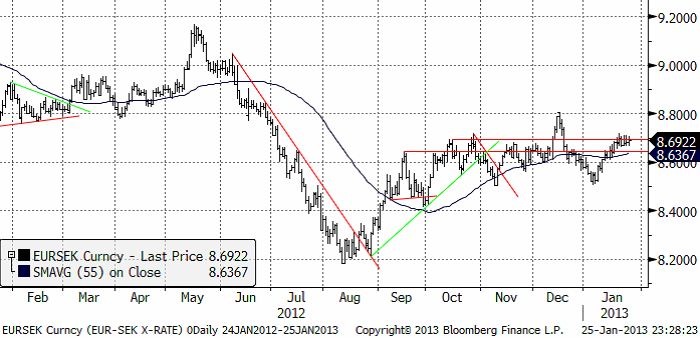
EURSEK rörde sig ”sidledes” i veckan som gick. De som läste vårt förra veckobrev minns att vi skrev att det var det mest troliga. Nu står marknaden och väger, precis på det övre motståndet. Vanligtvis brukar marknaden falla tillbaka i lägen som det här. Men, om veckan börjar med stigande kurser, kan det bli en förlängning på uppgången, i så fall till 8 kronor jämnt i första hand.
USDSEK
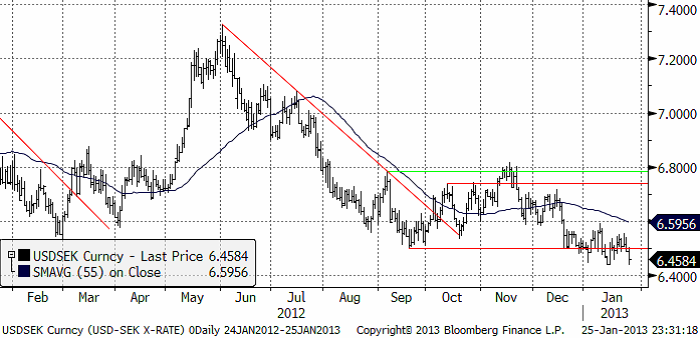
Dollarn har fortsatt att utveckla sig svagt mot kronan. I fredags föll kursen ner mot den senaste månadens stödnivå, som dock höll. I alla fall i fredags. Men det ser ut som om trenden nedåt är stark och gissningsvis vinner den. Vi tror att dollarförsvagningen fortsätter, drivet av att ”Fiscal Cliff” återigen rycker allt närmare.
[box]SEB Veckobrev Jordbruksprodukter är producerat av SEB Merchant Banking och publiceras i samarbete och med tillstånd på Råvarumarknaden.se[/box]
Disclaimer
The information in this document has been compiled by SEB Merchant Banking, a division within Skandinaviska Enskilda Banken AB (publ) (“SEB”).
Opinions contained in this report represent the bank’s present opinion only and are subject to change without notice. All information contained in this report has been compiled in good faith from sources believed to be reliable. However, no representation or warranty, expressed or implied, is made with respect to the completeness or accuracy of its contents and the information is not to be relied upon as authoritative. Anyone considering taking actions based upon the content of this document is urged to base his or her investment decisions upon such investigations as he or she deems necessary. This document is being provided as information only, and no specific actions are being solicited as a result of it; to the extent permitted by law, no liability whatsoever is accepted for any direct or consequential loss arising from use of this document or its contents.
About SEB
SEB is a public company incorporated in Stockholm, Sweden, with limited liability. It is a participant at major Nordic and other European Regulated Markets and Multilateral Trading Facilities (as well as some non-European equivalent markets) for trading in financial instruments, such as markets operated by NASDAQ OMX, NYSE Euronext, London Stock Exchange, Deutsche Börse, Swiss Exchanges, Turquoise and Chi-X. SEB is authorized and regulated by Finansinspektionen in Sweden; it is authorized and subject to limited regulation by the Financial Services Authority for the conduct of designated investment business in the UK, and is subject to the provisions of relevant regulators in all other jurisdictions where SEB conducts operations. SEB Merchant Banking. All rights reserved.

Oil prices are likely to fall for a fourth straight year as OPEC+ unwinds cuts and retakes market share. We expect Brent crude to average USD 55/b in Q4/25 before OPEC+ steps in to stabilise the market into 2026. Surplus, stock building, oil prices are under pressure with OPEC+ calling the shots as to how rough it wants to play it. We see natural gas prices following parity with oil (except for seasonality) until LNG surplus arrives in late 2026/early 2027.

Oil market: Q4/25 and 2026 will be all about how OPEC+ chooses to play it
OPEC+ is in a process of unwinding voluntary cuts by a sub-group of the members and taking back market share. But the process looks set to be different from 2014-16, as the group doesn’t look likely to blindly lift production to take back market share. The group has stated very explicitly that it can just as well cut production as increase it ahead. While the oil price is unlikely to drop as violently and lasting as in 2014-16, it will likely fall further before the group steps in with fresh cuts to stabilise the price. We expect Brent to fall to USD 55/b in Q4/25 before the group steps in with fresh cuts at the end of the year.

Natural gas market: Winter risk ahead, yet LNG balance to loosen from 2026
The global gas market entered 2025 in a fragile state of balance. European reliance on LNG remains high, with Russian pipeline flows limited to Turkey and Russian LNG constrained by sanctions. Planned NCS maintenance in late summer could trim exports by up to 1.3 TWh/day, pressuring EU storage ahead of winter. Meanwhile, NE Asia accounts for more than 50% of global LNG demand, with China alone nearing a 20% share (~80 mt in 2024). US shale gas production has likely peaked after reaching 104.8 bcf/d, even as LNG export capacity expands rapidly, tightening the US balance. Global supply additions are limited until late 2026, when major US, Qatari and Canadian projects are due to start up. Until then, we expect TTF to average EUR 38/MWh through 2025, before easing as the new supply wave likely arrives in late 2026 and then in 2027.
Price action contained withing USD 2/b last week. Likely muted today as well with US closed. The Brent November contract is the new front-month contract as of today. It traded in a range of USD 66.37-68.49/b and closed the week up a mere 0.4% at USD 67.48/b. US oil inventory data didn’t make much of an impact on the Brent price last week as it is totally normal for US crude stocks to decline 2.4 mb/d this time of year as data showed. This morning Brent is up a meager 0.5% to USD 67.8/b. It is US Labor day today with US markets closed. Today’s price action is likely going to be muted due to that.
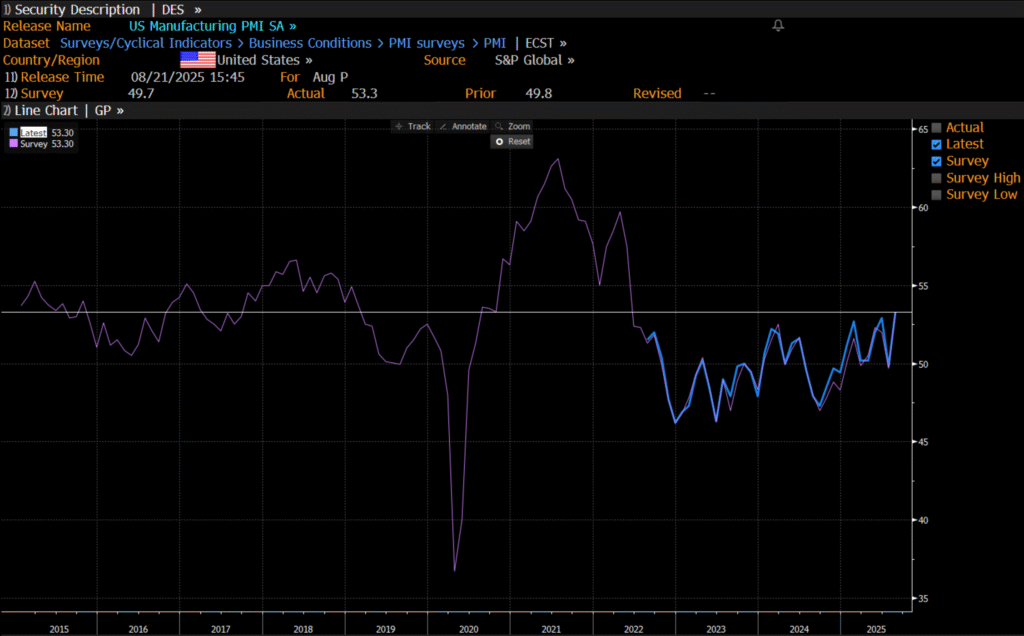
Improving manufacturing readings. China’s manufacturing PMI for August came in at 49.4 versus 49.3 for July. A marginal improvement. The total PMI index ticked up to 50.5 from 50.2 with non-manufacturing also helping it higher. The HCOB Eurozone manufacturing PMI was a disastrous 45.1 last December, but has since then been on a one-way street upwards to its current 50.5 for August. The S&P US manufacturing index jumped to 53.3 in August which was the highest since 2022 (US ISM manufacturing tomorrow). India manufacturing PMI rose further and to 59.3 for August which is the highest since at least 2022.
Are we in for global manufacturing expansion? Would help to explain copper at 10k and resilient oil. JPMorgan global manufacturing index for August is due tomorrow. It was 49.7 in July and has been below the 50-line since February. Looking at the above it looks like a good chance for moving into positive territory for global manufacturing. A copper price of USD 9935/ton, sniffing at the 10k line could be a reflection of that. An oil price holding up fairly well at close to USD 68/b despite the fact that oil balances for Q4-25 and 2026 looks bloated could be another reflection that global manufacturing may be accelerating.
US manufacturing PMI by S&P rose to 53.3 in August. It was published on 21 August, so not at all newly released. But the US ISM manufacturing PMI is due tomorrow and has the potential to follow suite with a strong manufacturing reading.
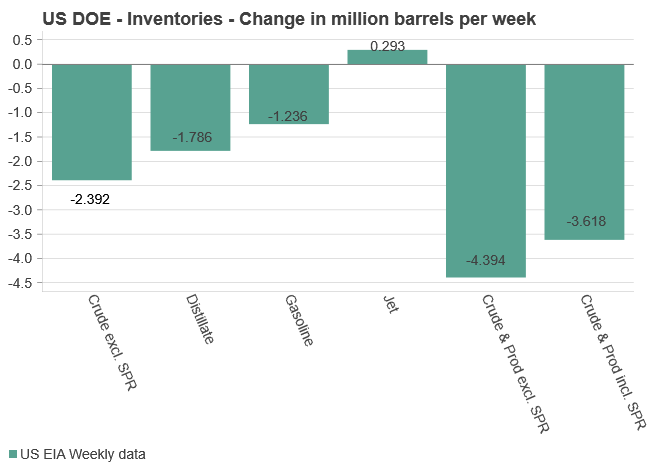
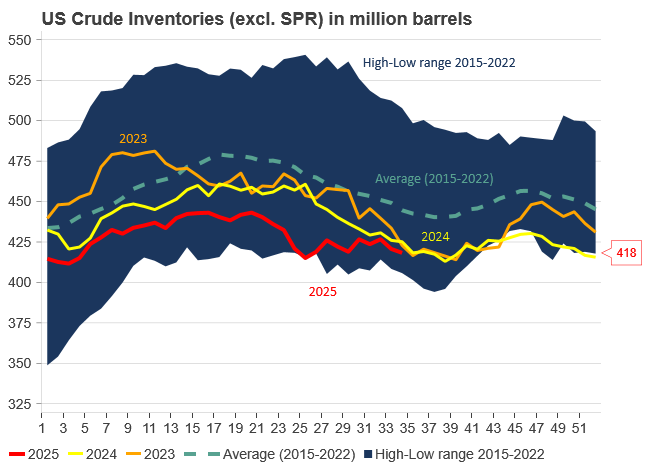
U.S. commercial crude inventories posted another draw last week, falling by 2.4 million barrels to 418.3 million barrels, according to the latest DOE report. Inventories are now 6% below the five-year seasonal average, underlining a persistently tight supply picture as we move into the post-peak demand season.
While the draw was smaller than last week’s 6 million barrel decline, the trend remains consistent with seasonal patterns. Current inventories are still well below the 2015–2022 average of around 449 million barrels.
Gasoline inventories dropped by 1.2 million barrels and are now close to the five-year average. The breakdown showed a modest increase in finished gasoline offset by a decline in blending components – hinting at steady end-user demand.
Diesel inventories saw yet another sharp move, falling by 1.8 million barrels. Stocks are now 15% below the five-year average, pointing to sustained tightness in middle distillates. In fact, diesel remains the most undersupplied segment, with current inventory levels at the very low end of the historical range (see page 3 attached).
Total commercial petroleum inventories – including crude and products but excluding the SPR – fell by 4.4 million barrels on the week, bringing total inventories to approximately 1,259 million barrels. Despite rising refinery utilization at 94.6%, the broader inventory complex remains structurally tight.
On the demand side, the DOE’s ‘products supplied’ metric – a proxy for implied consumption – stayed strong. Total product demand averaged 21.2 million barrels per day over the last four weeks, up 2.5% YoY. Diesel and jet fuel were the standouts, up 7.7% and 1.7%, respectively, while gasoline demand softened slightly, down 1.1% YoY. The figures reflect a still-solid late-summer demand environment, particularly in industrial and freight-related sectors.


Guld kostar för första gången någonsin 3600 USD per uns
OPEC+ in a process of retaking market share
Manufacturing PMIs ticking higher lends support to both copper and oil

Ombytliga elpriser på elmarknaden

Silverpriset når 40 USD, högsta sedan 2011

Omgående mångmiljardfiasko för Equinors satsning på Ørsted och vindkraft

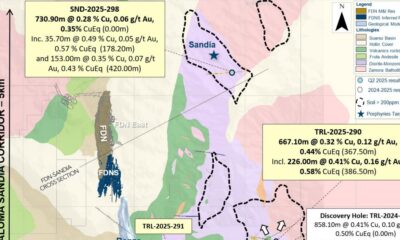
Lundin Gold hittar ny koppar-guld-fyndighet vid Fruta del Norte-gruvan

Meta bygger ett AI-datacenter på 5 GW och 2,25 GW gaskraftverk

Guld stiger till över 3500 USD på osäkerhet i världen
What OPEC+ is doing, what it is saying and what we are hearing
-
 Nyheter3 veckor sedan
Omgående mångmiljardfiasko för Equinors satsning på Ørsted och vindkraft
-
 Nyheter4 veckor sedan
Lundin Gold hittar ny koppar-guld-fyndighet vid Fruta del Norte-gruvan
-
 Nyheter2 veckor sedan
Meta bygger ett AI-datacenter på 5 GW och 2,25 GW gaskraftverk
-
 Nyheter4 veckor sedan
Guld stiger till över 3500 USD på osäkerhet i världen
-
Analys3 veckor sedan
What OPEC+ is doing, what it is saying and what we are hearing
-

 Nyheter4 veckor sedan
Alkane Resources och Mandalay Resources har gått samman, aktör inom guld och antimon
-
 Nyheter2 veckor sedan
Aker BP gör ett av Norges största oljefynd på ett decennium, stärker resurserna i Yggdrasilområdet
-

 Nyheter4 veckor sedan
Lyten, tillverkare av litium-svavelbatterier, tar över Northvolts tillgångar i Sverige och Tyskland