

Analys
SEB Jordbruksprodukter, 25 mars 2013

 Förra veckans handel i jordbruksprodukterna påverkades endast ytligt av svallvågorna från Cypernkrisen. Priserna steg överlag på nästan alla marknader. Starkast gick vete. Jag tror att det huvudsakligen handlar om att priset fallit lite för långt ner på allt för tidigt inkasserade förhoppningar om regn i USA. Torkan i USA registrerades som något värre förra veckan än veckan innan. Europa oroar sig förvånande lite över de extremt låga utgående lager som t ex USDA har för EU-27. Lagerstatistiken som USDA publicerar på torsdag den 28 mars kan skapa en hel del volatilitet. Klockan 17 presenteras uppdaterade siffror på ”prospective plantings” för vete och majs och lagerstatistiken per den första mars.
 Veckans Fonterra-auktion visade priser som återigen ligger rejält mycket högre än förra auktionen. Priserna på Eurex reagerade med att stiga lite grand. Pressen försöker i vanlig ordning hitta på en ”story” bakom prisuppgången. Bland annat nämns torkan i Nya Zealand (som egentligen till stor del är historia) och kinas glupande aptit på SMP (som också hör till förra året). Februaris import jämfört med samma månad förra året visar på en 17%-ig minskning).
Fram till torsdag väntar vi oss inte några stora kursrörelser. Folk kommer att trimma sina positioner för att inte drabbas av slumpen när lagerstatistiken publiceras på torsdag. Oron är att lagren ska visa sig mindre än väntat. Så har det varit 8 av 10 gånger de senaste åren. Det innebär i sig att risk/reward talar för en prisnedgång på rapportsiffrorna, allt annat lika.
Odlingsväder
US Drought Monitor visar återigen mer av USA drabbat av torka. Den 19 mars var 65% av ytan drabbad av torka. Veckan innan var det 63.7%. Extrem och exceptionell torka ökade till 16.85% av ytan från 16.51% för två veckor sedan.
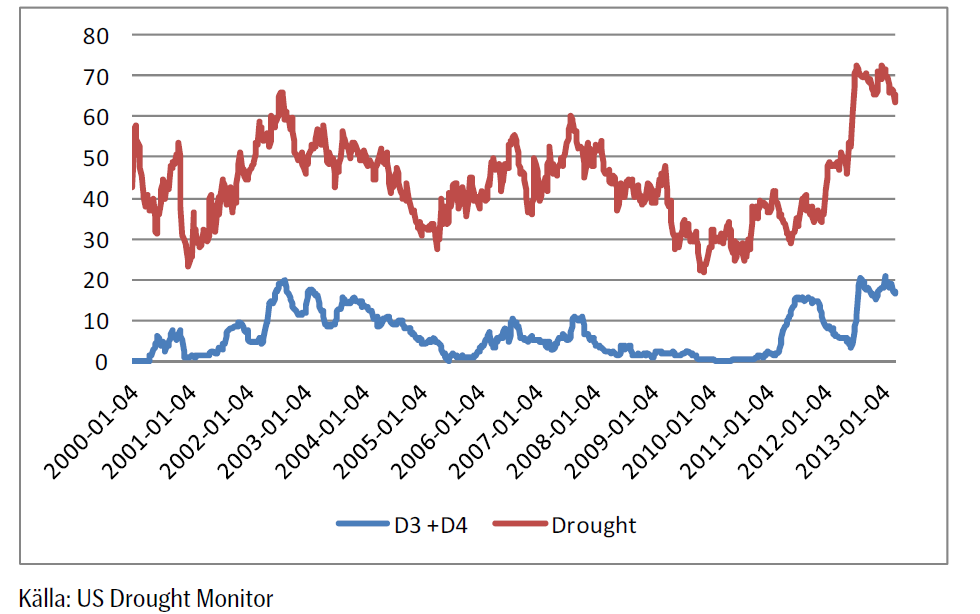
Marknaden har diskonterat att trenden har vänt till våtare väder, men detta är kanske att ropa ”hej” lite för tidigt. Kanske ligger denna tvekan om torkans nära förestående slut bakom veckans prisuppgång på spannmål.
Hela Europa har varit kallt och torrt. Det har varit kallt och torrt även i USA och i Kanada.
I Brasilien är det varmt och med mycket regn.
Vete
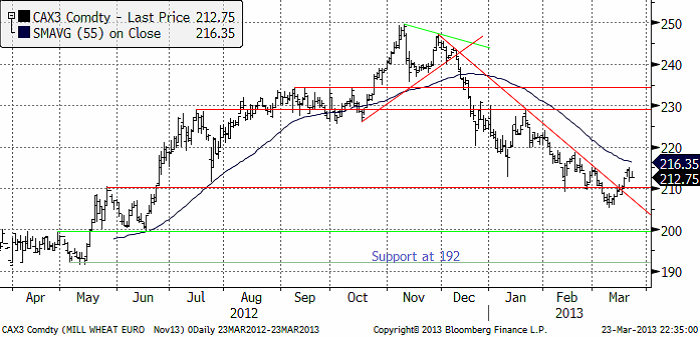
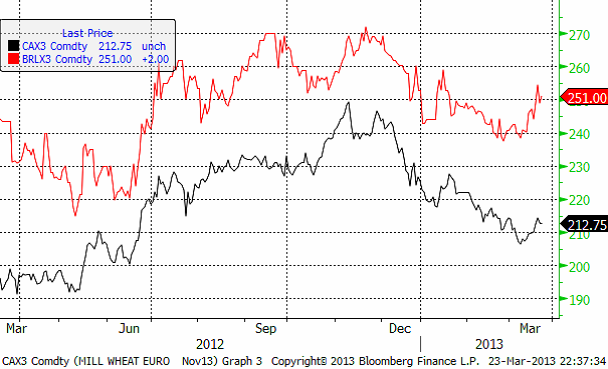
Priset på november (2013) rekylerade som väntat uppåt. 210 Euro bröts och även trendlinjen, motståndet för prisnedgången sedan i början av december. Detta bekräftar tekniskt att prisnedgången är över. Jag tror inte att vi kommer att få se en förlängning av den rekyl uppåt vi sett de senaste dagarna. Det är säkerligen många lantbrukare som passar på att prissäkra nu – i vart fall borde de göra det. Sidledes prisrörelse är mer trolig den närmaste tiden. Det vill säga, en liten prisnedgång i veckan som kommer, kanske ner mot 210 igen.
Decemberkontraktet på CBOT har stigit relativt brant. Sättet som det har skett stämmer väl överens med hur rekyler mot trenden brukar se ut. Det finns säkerligen många lantbrukare som hängt upp sig på 750 cent. Den här marknaden kommer att ha väldigt svårt att gå över den nivån om det inte kommer nya rapporter om väder och skörd som stör.
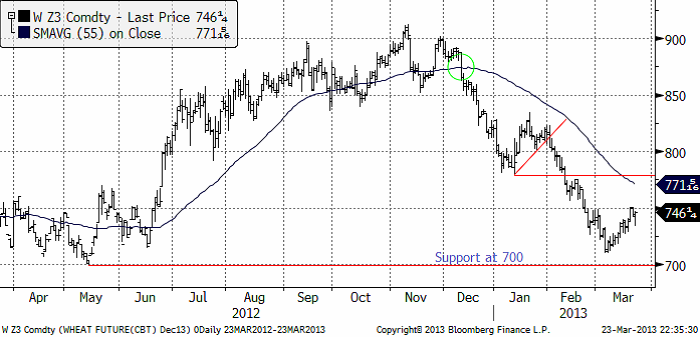
På torsdag kommer som bekant lagerstatistiken per 1 mars i USA. Det brukar vara stor volatilitet när dessa siffror kommer.
Maltkorn
Maltkorn (november 2013) har fortsatt att utveckla sig starkare än kvarnvetet. Prisskillnaden mellan maltkorn och kvarnvete har vidgats nu i mars. Om man kan, kan det vara en god idé att försöka prissäkra maltkorn i maltkornskontraktet, snare än kvarnvetekontraktet, även om maltkornskontraktet är betydligt mer illikvitt. Man kan lägga limiterade säljordrar.
Majs
Majspriset (december 2013) har liksom vetet brutit den fallande trendlinjen. Detta signalerar att prisfallet är över. Liksom för vetet tycker jag däremot inte att man ska ge sig in och köpa majs. Det finns alldeles för mycket osäkerhet i väder, med mera.
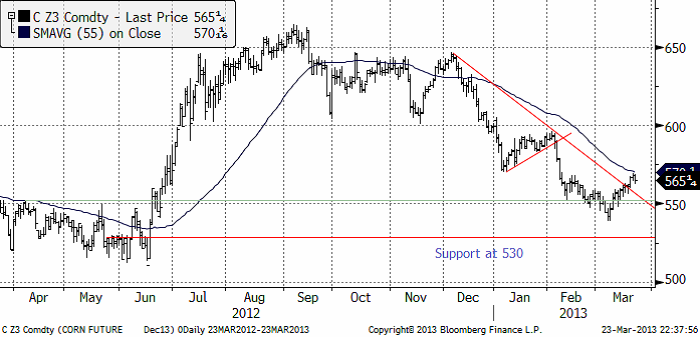
Vi har samma tolkning av marknaden som förra veckan. Prisfallet har troligtvis ebbat ut och priset bör röra sig ”sidledes”. Lagerstatistiken på torsdag kan ändra det.
Sojabönor
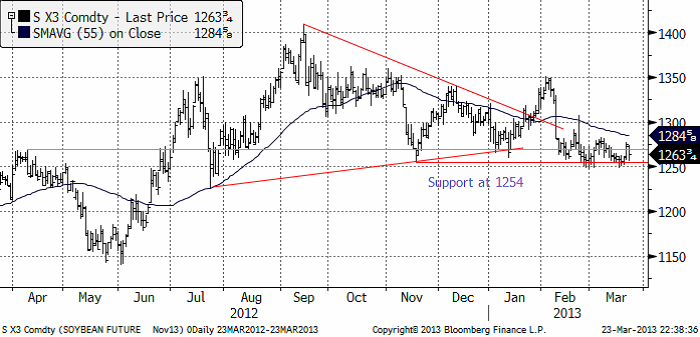
Sojabönorna (november 2013) testar ideligen stödet på 1250 cent / bushel.
Gammal amerikansk skörd tycks vara mer eller mindre slut. Export inspections halverades i veckan som gick. Takten på exporten och på inhemsk efterfrågan från ”crushers” har legat på en ohållbart hög nivå. Det var därför egentligen en tidsfråga innan exporten – och ”crushen” skulle ta minska. Bönorna håller helt enkelt på att ta slut.
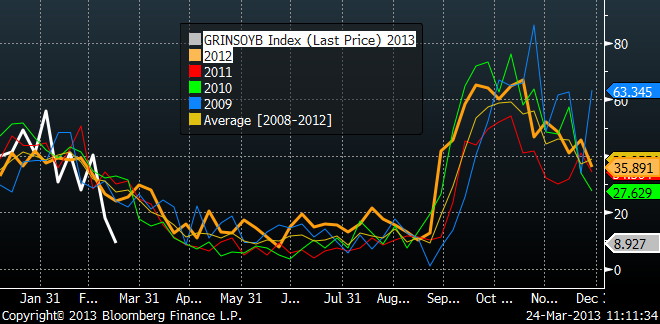
I diagrammet nedan ser vi export inspections för olika kalenderår. Vit kurva är 2013 och orange kurva är 2012. Slutet av 2012 års kurva är 2012/13 års skörd och vit kurva är förstås det också. Vi ser att exporten kom igång förhållandevis tidigt i höstas och att exporten nu tagit slut rekordtidigt.
Skörden i Brasilien ligger lite efter det normala. I början av mars hade 60% skördats. I Mato Grosso är ca 80% klart, men i Santa Catarina och Rio Grande do Sul nere i södra delen av landet är bara 12% klart, enligt CEPEA.
Eftersom det regnar så mycket kring Mato Grosso har man stora problem med vägarna. Det är svårt att få ut produkten till hamnarna. Detta förklarar till viss del att USA fått exportera så mycket och hållit priset uppe på CBOT.
Marknadsläget är oförändrat från förra veckan: I veckan som kommer får man hålla koll på om priset håller sig över det tekniska stödet vid 1254 eller om det bryts. Om det bryts vill vi vara korta sojabönor.
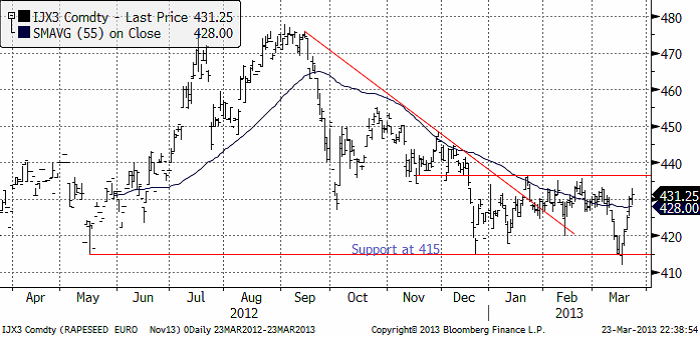
Raps
Rapspriset (november 2013) som i torsdags för en dryg vecka sedan föll rakt ner till stödet på 415 euro, tvärvände och gick rakt upp förra veckan. Nu ligger priset återigen i den övre delen av det prisintervall mellan 415 och 437 euro som priset har legat inom sedan december.
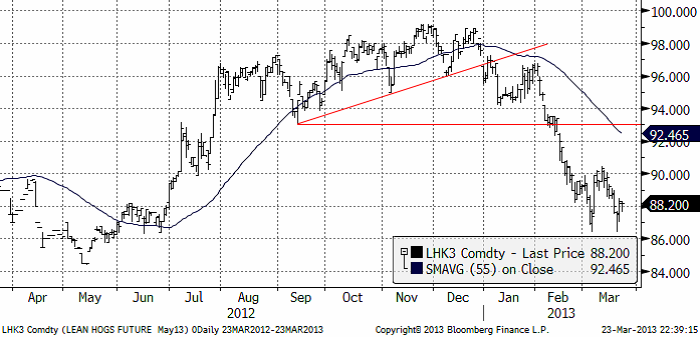
Gris
Grispriset (Maj 13) tycks ha stabiliserat sig efter det stora prisfallet som varit. Frågan är om detta kan utveckla sig till en botten, som priset kan finna ny styrka från.
Mjölk
Tisdagens Fonterra-auktion var visade återigen kraftigt högre priser på SMP. Auktionen åtföljdes i pressen av nyhetsartiklar om den svåra torkan i Nya Zeeland och Kinas växande import av mjölkpulver.
I kursdiagrammet nedan ser vi fyra kurvor, som förra veckan. Överst har vi smör i euro per ton, alla är i euro per ton. Den tunna linjen USDA:s notering för SMP i västra Europa. Den feta röda linjen är terminspriset på SMP på Eurex, som avser snittpriset på SMP i Tyskland, Holland och Frankrike. Den gröna linjen är Fonterras auktionspris på SMP.
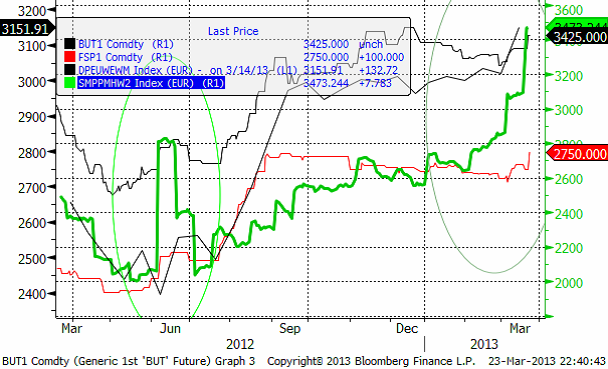
Fonterra-priserna har stigit kraftigt i två månader nu och det har fått priserna på Eurex att reagera. Förra veckan var egentligen första gången som Eurex / den europeiska marknaden tog notis om vad som händer på Fonterra-auktionerna. USDA:s index för helmjölkspulver FOB Västeuropa steg också i förra veckans notering.
När det gäller torkan i Nya Zeeland så har det varit torrt framförallt på den norra ön i februari. Mars har lite mindre nederbörd än normalt. I skrivande stund regnar det på den södra ön.
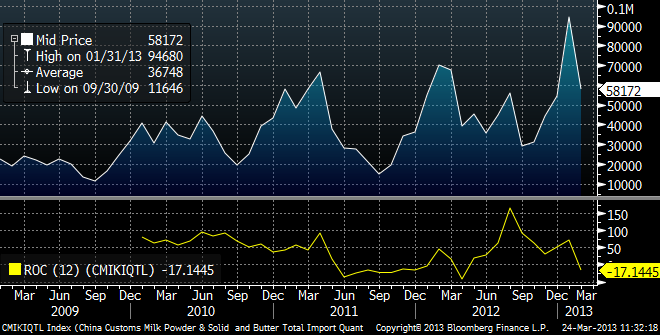
När det gäller Kinas import, ser vi månadsvis statistik nedan. Den senaste noteringen är från februari, som var en månad med mycket ledighet och därmed lägre importaktivitet. I den nedre delen av diagrammet finns en kurva som visar årsvis förändring. Februaris import låg alltså 17% lägre än den gjorde i februari förra året. Sant är att importen från juni och fram till februari visade en stark ökningstakt, uppemot 100% högre än året innan. Men som vi ser har suget avtagit sedan i somras / höstas.
Prisuppgången på Fonterra-auktionen är lite kraftigare än de ”spikar” vi har sett tidigare. Den börjar få effekt på andra prisindikatorer och på marknadspriset på Eurex. Vi har haft en säljrekommendation och tror alltjämt att priset är ”högt”. Den stora importökningen i Kina ligger i historien. I årstakt är faktiskt importen lägre än den var förra året. Kortsiktigt kan den påfallande kraftiga styrkan i Fonterra-priserna sprida sig till andra marknader, så man kanske ska avvakta någon vecka eller två med att sälja terminer. Långsiktigt har vi säljrekommendation på terminerna, men kortsiktigt neutral.
[box]SEB Veckobrev Jordbruksprodukter är producerat av SEB Merchant Banking och publiceras i samarbete och med tillstånd på Råvarumarknaden.se[/box]
Disclaimer
The information in this document has been compiled by SEB Merchant Banking, a division within Skandinaviska Enskilda Banken AB (publ) (“SEB”).
Opinions contained in this report represent the bank’s present opinion only and are subject to change without notice. All information contained in this report has been compiled in good faith from sources believed to be reliable. However, no representation or warranty, expressed or implied, is made with respect to the completeness or accuracy of its contents and the information is not to be relied upon as authoritative. Anyone considering taking actions based upon the content of this document is urged to base his or her investment decisions upon such investigations as he or she deems necessary. This document is being provided as information only, and no specific actions are being solicited as a result of it; to the extent permitted by law, no liability whatsoever is accepted for any direct or consequential loss arising from use of this document or its contents.
About SEB
SEB is a public company incorporated in Stockholm, Sweden, with limited liability. It is a participant at major Nordic and other European Regulated Markets and Multilateral Trading Facilities (as well as some non-European equivalent markets) for trading in financial instruments, such as markets operated by NASDAQ OMX, NYSE Euronext, London Stock Exchange, Deutsche Börse, Swiss Exchanges, Turquoise and Chi-X. SEB is authorized and regulated by Finansinspektionen in Sweden; it is authorized and subject to limited regulation by the Financial Services Authority for the conduct of designated investment business in the UK, and is subject to the provisions of relevant regulators in all other jurisdictions where SEB conducts operations. SEB Merchant Banking. All rights reserved.

Hesitant today. Brent jumped to an intraday high of $66.36/b yesterday after having touched an intraday low of $60.07/b on Monday as Indian and Chinese buyers cancelled some Russian oil purchases and instead redirected their purchases towards the Middle East due to the news US sanctions. Brent is falling back 0.4% this morning to $65.8/b.

It’s our strong view that the only sensible thing is to sell this rally. In all Trump’s unpredictability he has become increasingly predictable. Again and again he has rumbled about how he is going to be tough on Putin. Punish Putin if he won’t agree to peace in Ukraine. Recent rumbling was about the Tomahawk rockets which Trump threatened on 10 October and 12 October to sell/send to Ukraine. Then on 17 October he said that ”the U.S. didn’t want to give away weapons (Tomahawks) it needs”.
All of Trump’s threats towards Putin have been hot air. So far Trump’s threats have been all hot air and threats which later have evaporated after ”great talks with Putin”. After all these repetitions it is very hard to believe that this time will be any different. The new sanctions won’t take effect before 21. November. Trump has already said that: ”he was hoping that these new sanctions would be very short-lived in any case”. Come 21. November these new sanctions will either evaporate like all the other threats Trump has thrown at Putin before fading them. Or the sanctions will be postponed by another 4 weeks or 8 weeks with the appearance that Trump is even more angry with Putin. But so far Trump has done nothing that hurt Putin/Russia. We can’t imagine that this will be different. The only way forward in our view for a propre lasting peace in Ukraine is to turn Ukraine into defensive porcupine equipped with a stinging tail if need be.
China will likely stand up to Trump if new sanctions really materialize on 21 Nov. Just one country has really stood up to Trump in his tariff trade war this year: China. China has come of age and strength. I will no longer be bullied. Trump upped tariffs. China responded in kind. Trump cut China off from high-end computer chips. China put on the breaks on rare earth metals. China won’t be bullied any more and it has the power to stand up. Some Chinese state-owned companies like Sinopec have cancelled some of their Russian purchases. But China’s Foreign Ministry spokesperson Guo Jiakun has stated that China “oppose unilateral sanctions which lack a basis in international law and authorization of the UN Security Council”. Thus no one, not even the US shall unilaterally dictate China from whom they can buy oil or not. This is yet another opportunity for China to show its new strength and stand up to Trump in a show of force. Exactly how China choses to play this remains to be seen. But China won’t be bullied by over something as important as its oil purchases. So best guess here is that China will defy Trump on this. But probably China won’t need to make a bid deal over this. Firstly because these new sanctions will either evaporate as all the other threats or be postponed once we get to 21 November. Secondly because the sanctions are explicit towards US persons and companies but only ”may” be enforced versus non-US entities.
Sanctions is not a reduction in global supply of oil. Just some added layer of friction. Anyhow, the new sanctions won’t reduce the supply of Russian crude oil to the market. It will only increase the friction in the market with yet more need for the shadow fleet and ship to ship transfer of Russian oil to dodge the sanctions. If they materialize at all.
The jump in crude oil prices is probably due to redirections of crude purchases to the Mid-East and not because all speculators are now turned bullish. Has oil rallied because all speculators now suddenly have turned bullish? We don’t think so. Brent crude has probably jumped because some Indian and Chinese oil purchasers of have redirected their purchases from Russia towards the Mid-East just in case the sanctions really materializes on 21 November.
Parts of the Brent crude curve dipping into the high $50ies/b. Brent crude fell 2.3% over the week to Friday. It closed the week at $61.29/b, a slight gain on the day, but also traded to a low of $60.14/b that same day and just barely avoided trading into the $50ies/b. This morning it is risk-on in equities which seems to help industrial metals a little higher. But no such luck for oil. It is down 0.8% at $60.8/b. This week looks set for Brent crude to dip its feet in the $50ies/b. The Brent 3mth contract actually traded into the high $50ies/b on Friday.
The front-end backwardation has been on a weakening foot and is now about to fully disappear. The lowest point of the crude oil curve has also moved steadily lower and lower and its discount to the 5yr contract is now $6.8/b. A solid contango. The Brent 3mth contract did actually dip into the $50ies/b intraday on Friday when it traded to a low point of $59.93/b.
More weakness to come as lots of oil at sea comes to ports. Mid-East OPEC countries have boosted exports along with lower post summer consumption and higher production. The result is highly visibly in oil at sea which increased by 17 mb to 1,311 mb over the week to Sunday. Up 185 mb since mid-August. On its way to discharge at a port somewhere over the coming month or two.
Don’t forget that the oil market path ahead is all down to OPEC+. Remember that what is playing out in the oil market now is all by design by OPEC+. The group has decided that the unwind of the voluntary cuts is what it wants to do. In a combination of meeting demand from consumers as well as taking back market share. But we need to remember that how this plays out going forward is all at the mercy of what OPEC+ decides to do. It will halt the unwinding at some point. It will revert to cuts instead of unwind at some point.
A few months with Brent at $55/b and 40-50 US shale oil rigs kicked out may be what is needed. We think OPEC+ needs to see the exit of another 40-50 drilling rigs in the US shale oil patches to set US shale oil production on a path to of a 1 mb/d year on year decline Dec-25 to Dec-26. We are not there yet. But a 2-3 months period with Brent crude averaging $55/b would probably do it.
Oil on water increased 17 mb over the week to Sunday while oil in transit increased by 23 mb. So less oil was standing still. More was moving.

Crude oil floating storage (stationary more than 7 days). Down 11 mb over week to Sunday

The lowest point of the Brent crude oil curve versus the 5yr contract. Weakest so far this year.

Crude oil 1mth to 3mth time-spreads. Dubai held out strongly through summer, but then that center of strength fell apart in late September and has been leading weakness in crude curves lower since then.

Rebounding along with most markets. But concerns over solidity of Gaza peace may also contribute. Brent crude fell 0.8% yesterday to $61.91/b and its lowest close since May this year. This morning it is bouncing up 0.9% to $62.5/b along with a softer USD amid positive sentiment with both equities and industrial metals moving higher. Concerns that the peace in Gaza may be less solid than what one might hope for also yields some support to Brent. Bets on tech stocks are rebounding, defying fears of trade war. Money moving back into markets. Gold continues upwards its strong trend and a softer dollar helps it higher today as well.
US crude & products probably rose 5.6 mb last week (API) versus a normal seasonal decline of 2.4 mb. The US API last night partial and thus indicative data for US oil inventories. Their data indicates that US crude stocks rose 7.4 mb last week, gasoline stocks rose 3.0 mb while Distillate stocks fell 4.8 mb. Altogether an increase in commercial crude and product stocks of 5.6 mb. Commercial US crude and product stocks normally decline by 2.4 mb this time of year. So seasonally adjusted the US inventories rose 8 mb last week according to the indicative numbers by the API. That is a lot. Also, the counter seasonal trend of rising stocks versus normally declining stocks this time of year looks on a solid pace of continuation. If the API is correct then total US crude and product stocks would stand 41 mb higher than one year ago and 6 mb higher than the 2015-19 average. And if we combine this with our knowledge of a sharp increase in production and exports by OPEC(+) and a large increase in oil at sea, then the current trend in US oil inventories looks set to continue. So higher stocks and lower crude oil prices until OPEC(+) switch to cuts. Actual US oil inventory data today at 18:00 CET.
US commercial crude and product stocks rising to 1293 mb in week 41 if last nights indicative numbers from API are correct.

Crude oil soon coming to a port near you. OPEC has lifted production sharply higher this autumn. At the same time demand for oil in the Middle-East has fallen as we have moved out of summer heat and crude oil burn for power for air-conditioning. The Middle-East oil producers have thus been able to lift exports higher on both accounts. Crude oil and condensates on water has shot up by 177 mb since mid-August. This oil is now on its way to ports around the world. And when they arrive, it will likely help to lift stocks onshore higher. That is probably when we will lose the last bit of front-end backwardation the the crude oil curves. That will help to drive the front-month Brent crude oil price down to the $60/b line and revisit the high $50ies/b. Then the eyes will be all back on OPEC+ when they meet in early November and then again in early December.
Crude oil and condensates at sea have moved straight up by 177 mb since mid-August as OPEC(+) has produced more, consumed less and exported more.


Sell the rally. Trump has become predictable in his unpredictability

Gruvbolaget Boliden överträffade analytikernas förväntningar

Australien och USA investerar 8,5 miljarder USD för försörjningskedja av kritiska mineraler
Brent crude set to dip its feet into the high $50ies/b this week

Vad guldets uppgång egentligen betyder för världen

OPEC+ missar produktionsmål, stöder oljepriserna

Goldman Sachs höjer prognosen för guld, tror priset når 4900 USD

Blykalla och amerikanska Oklo inleder ett samarbete

Guld nära 4000 USD och silver 50 USD, därför kan de fortsätta stiga

Leading Edge Materials är på rätt plats i rätt tid
-
 Nyheter4 veckor sedan
OPEC+ missar produktionsmål, stöder oljepriserna
-
 Nyheter2 veckor sedan
Goldman Sachs höjer prognosen för guld, tror priset når 4900 USD
-
 Nyheter3 veckor sedan
Blykalla och amerikanska Oklo inleder ett samarbete
-
 Nyheter3 veckor sedan
Guld nära 4000 USD och silver 50 USD, därför kan de fortsätta stiga
-
 Nyheter2 veckor sedan
Leading Edge Materials är på rätt plats i rätt tid
-

 Nyheter2 veckor sedan
Nytt prisrekord, guld stiger över 4000 USD
-

 Nyheter3 veckor sedan
Ett samtal om guld, olja, koppar och stål
-
Analys3 veckor sedan
OPEC+ will likely unwind 500 kb/d of voluntary quotas in October. But a full unwind of 1.5 mb/d in one go could be in the cards