

Analys
SEB Jordbruksprodukter, 18 februari 2013

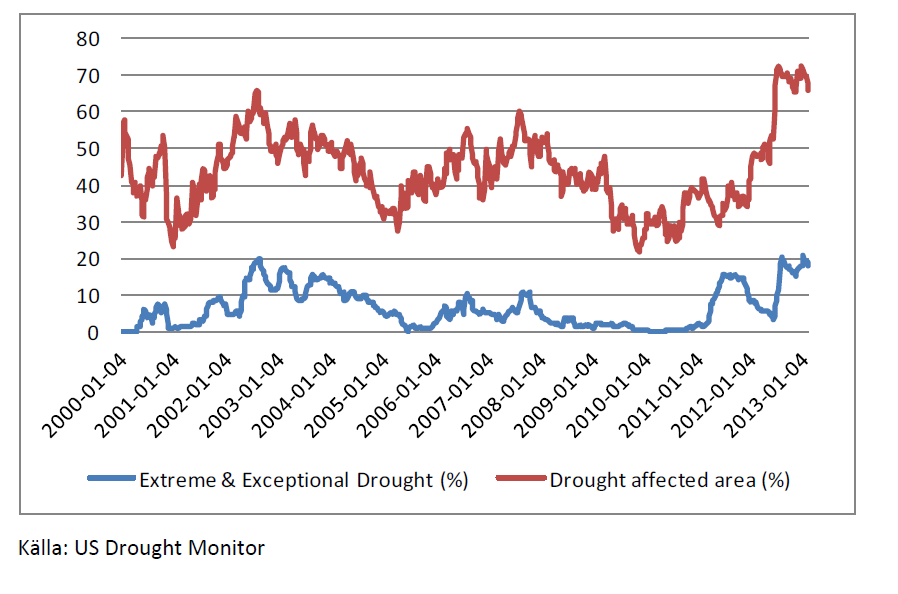
 Det är en något mindre del av USA som är drabbat av torka i den senaste veckans Drought Monitor-rapport, än veckan innan. Frågan är om detta nu är början på mindre torka, bättre utsikter för en god skörd och därmed lägre pris. Det är (nästan) alltid på våren och sommaren som skörden och därmed priset avgörs.
Vädret i Brasilien fortsätter att vara bra. Vädret i Argentina ser ut att förbättras. I Ryssland är det blandat. Det finns faktiskt risk för torka. Den som följt med i temperaturen på potentiella semesterorter, har kanske noterat att det är uppåt 30 grader varmt vid Svarta Havskusten.
Vete
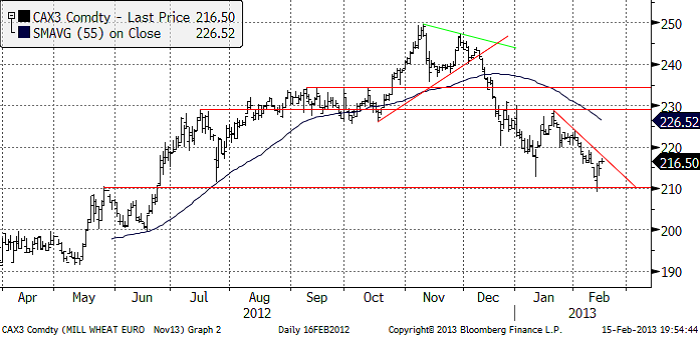
Priset på november (2013) kontraktet slutade 1% lägre än förra veckan, efter att ha börjat med ett kraftigt prisfall ner till 210 euro innan rekylen uppåt kom. 210 euro är ett tekniskt stöd. Bryts detta på uppsidan i veckan som kommer, är prisfallet från början av december troligen hejdat för ett tag framöver. Men det mest sannolika är att priset vänder ner igen för ett nytt test av 210-nivån.
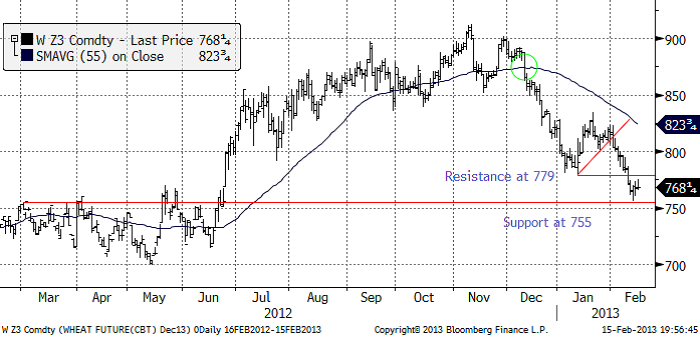
Nedan ser vi decemberkontraktet på CBOT, som inte lyckades rekylera upp lika mycket som Matif, efter att ha inlett veckan med prisfall. Det finns en gammal stödnivå på 755, som även fungerade i veckan som gick. Det finns också ett motstånd på 779 cent. Däremellan ligger nu marknaden. Frågan är vilket av stödet eller motståndet som ska brytas. Vi skulle gissa att stödet bryts, baserat på hur kursutvecklingen brukar bli när det är så här. Det finns i så fall potential för priset att falla ner mot 700 cent, eller strax däröver, det vill säga in i det prisintervall som vetet handlade i under förra våren.
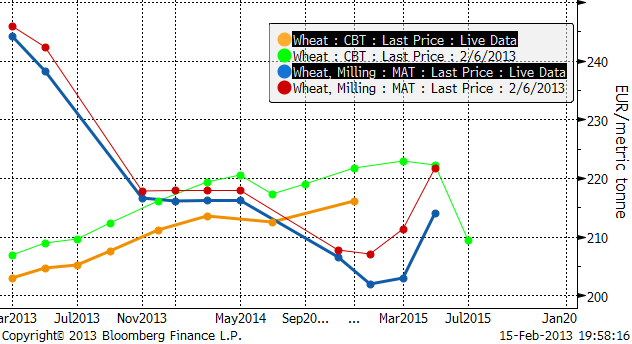
Vi ser i diagrammet nedan att Chicago-terminerna fallit över hela linjen. Notera också de konstiga priserna på de allra längsta terminskontrakten.
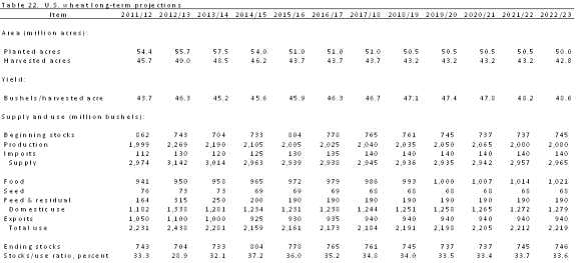
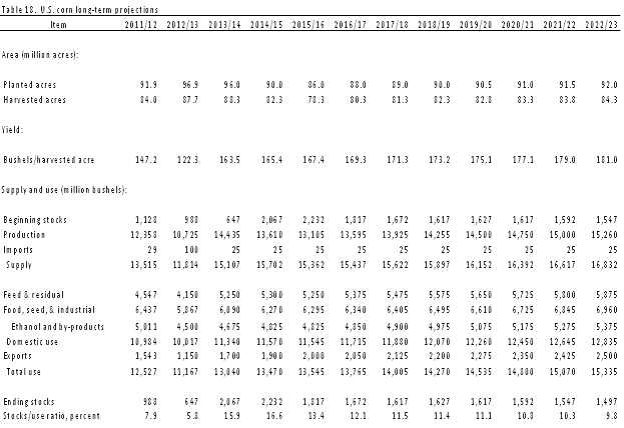
Det amerikanska jordbruksdepartementet USDA kom ut med sin långtidsprognos nu i veckan som sträcker sig fram till 2022. Prognosen för vete 2013/14 visar en ökning med 3% på årsbasis för sådd areal till 57.5 miljoner acres, vilket är den högsta nivån sedan 2009, men under de kommande åren förväntas sådd areal att fortsätta den historiska nedgången. Skördad areal förväntas hamna på 48.5 miljoner acres, vilket är 3% lägre än under 2012 som en följd av grödornas dåliga tillstånd. Långtidsprognosen innehöll också USDA’s första prognos för 2013 års veteproduktion som förväntas uppgå till 2,190 mb, vilket är en minskning med 79 mb jämfört med 2012, men den största produktionen under prognosperioden fram till 2022. Den genomsnittliga avkastningen 2013 beräknas uppgå till 45.2 bu/acre, och förväntas därefter att öka stadigt under åren för att 2022 uppgå till 48.6 bu/acre. Prognosen för ingående lager av vete per den 1 juni 2014 är satt till 733 mb, jämfört med estimatet för 2013 som ligger på 704 mb. Ingående lager 2015 förväntas uppgå till 804 mb, vilket skulle vara den högsta nivån under hela prognosperioden.
Strategie Grains justerar ned sin prognos för EU’s produktion av vete 2013/14 med 1.1 mt till 132.2 mt, som en följd av det blöta vädret i Storbritannien och lägre areal i Frankrike. SG säger att kontinuerliga regn begränsade sådden av höstvete i Storbritannien medan ny information har lett till en minskad uppskattning av vete arealen i Frankrike. De båda ländernas sammanlagda produktion justeras ned med 1.4 mt jämfört med förra månaden, något som dock uppvägdes något av marginellt högre skördeestimat för Litauen, Tjeckien, Rumänien och Bulgarien.
FranceAgriMer säger att EU:s lantbrukare kan komma att öka skördearealen för vete i år med 3% genom ökad sådd i Polen och Rumänien. Arealen förväntas uppgå till 23.8 miljoner hektar mot förra årets 23 miljoner hektar. Frankrikes vete areal kan komma att öka med 3 procent, medan arealen i Tyskland, Polen och Rumänien förväntas öka med 3%, 10% och 9% respektive. Även i Spanien, Italien och Ungern förväntas vetearealen bli högre i år än förra året. Arealen för vete i Storbritannien förvänts däremot att minska med mer än 200 000 hektar till 1.78 miljoner hektar på grund av att sådden försvårades av det kraftiga regnandet, framförallt i de östra delarna av landet.
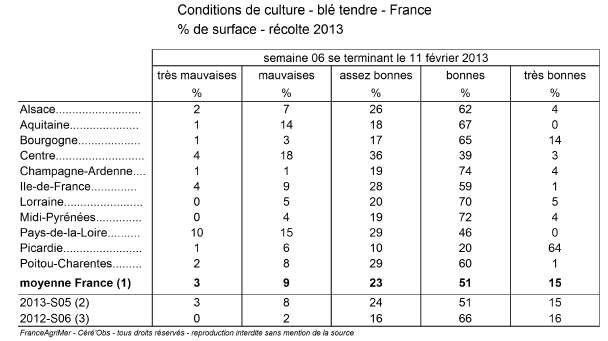
Per den 11 februari klassas 66% av vetet i Frankrike som ”good/excellent” enligt FranceAgriMer i en den första rapporten efter vetets vintervila. Den förra rapporten som släpptes den 3 december, före vintervilan, låg på 74% good/excellent. För ett år sedan var 82% i good/excellent skick.
De två största veteodlingsområdena i Frankrike, Centre och Picardie har fått dubbelt så mycket regn under december som normalt. Utsädesföretaget Groupe Limagrain rapporterar att det finns skador på grödan i alla regioner där det regnat för mycket och marken är mättad av fukt. I tabellen nedan ser vi att Centre har en högre andel vete i dåligt skick än alla andra landsdelar.
Utsikterna för Kinas grödor har återigen aktualiserats. Lokala USDA analytiker säger att veteproduktionen 2012/13 beräknas till 108 mt på grund av problem med fusarium i stora veteproducerande regioner såsom Anhui, Hubei, Jiangsu och Henan provinsen. Detta skulle vara betydligt lägre än den officiella siffran på 121 mt. Slutsatsen man kan dra av detta är att Kinas import av vete därmed kan vara mycket högre än tidigare väntat och vi hör från våra kontakter i marknaden att det ryktas om att Kina nyligen har köpt vete från USA och Australien.
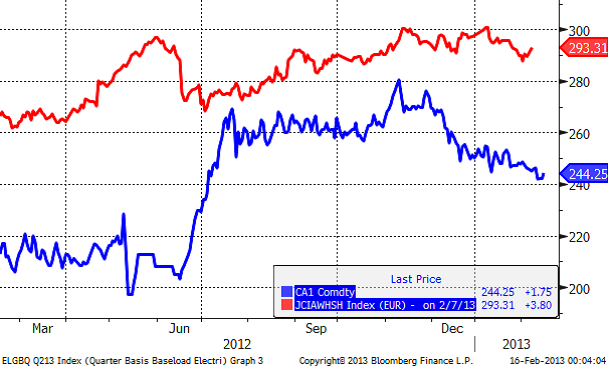
Mellan augusti 2012 och januari 2013 steg det lokala vetepriset från 2169 RMB till 2360 RMB per ton, en ökning med 9 procent, vilket enligt FAS skulle kunna vara en stark indikation på att veteproduktionen och det totala tillgängliga utbudet är lägre än de kinesiska officiella produktionsestimaten. Nedan ser vi priset på spotkontraktet på Matif och Ex-warehouse vetepris i Shanghai, också i euro per ton (omräknat).
Vi fortsätter vår neutrala vy på vetet. Tekniskt lutar det åt lägre pris. Det verkar som om marknaden tagit fasta på att torkan i USA visar tecken på att ha toppat ur. Orosmoment som risken för torka i Ryssland och risken för större importbehov i Kina har hittills inte lyckats gripa tag i marknadens aktörer.
Majs
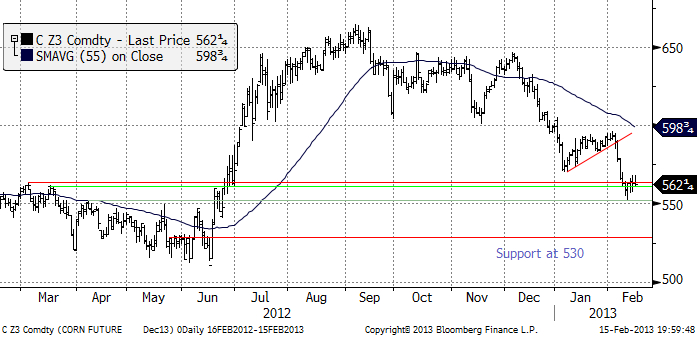
Majspriset (december 2013) nådde 550 cent, vilket var det ”mål” vi nämnde för ett par veckor sedan. Vi tror att den rekyl vi såg mot slutet av veckan är en så teknisk så kallad ”flagga” och att priset kommer att vända ner igen. Nästa stöd finns på 530 cent. Dit tror vi att priset går.
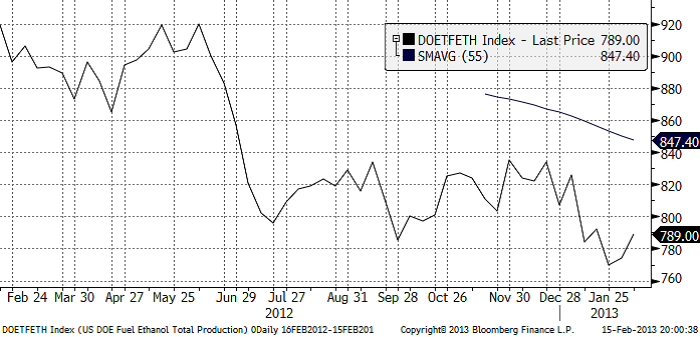
Veckovis etanolproduktion i USA har hämtat sig sedan den 25 januari när den nådde den rekordlåga nivån 770,000 fat / dag.
USDA:s långtidsprognos fram till 2022, visar att sådd majs areal i USA förväntas bli den näst största under 2013 och produktionen förväntas uppgå till rekordhöga 14,435 mb.
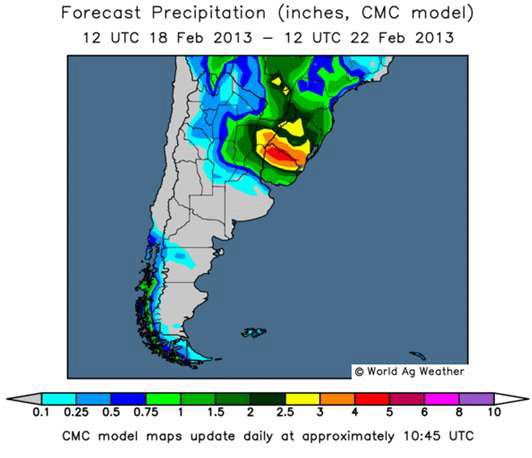
I förra veckan kom Buenos Aires Grain Exchange (BAGE) med sin första prognos för Argentinas majsproduktion 2012/13, som förväntas uppgå till rekordhöga 25 mt, vilket är en ökning från förra årets 21.5 mt när torka drabbade grödorna. BAGE:s prognos är dock betydligt lägre än USDA:s. I den senaste WASDE-rapporten angavs väntad skörd enligt USDA till 27 mt. Argentina är världens tredje största exportör av majs och oro över det torra vädret i Argentina har gett stöd åt de internationella priserna pga låga lager efter torkan i USA under förra säsongen. Den senaste veckan har dock landet fått spridda skurar över delar av provinserna Cordoba, Santa Fe och Buenos Aires men mer nederbörd behövs. Svalare temperaturer och en hel del nederbörd förväntas i de norra delarna under kommande vecka, medan torkan förväntas fortsätta i de centrala delarna.
Strategie Grains justerar upp sin prognos för EU:s produktion av majs 2013/14 med 0.9 mt till 63.7 mt, som en följd av införandet av officiella uppskattningar för Tyskland och Ungern i kombination med ett skifte av areal från höstgrödor. Vi fortsätter att ha en neutral (till negativ) vy på majs.
Sojabönor
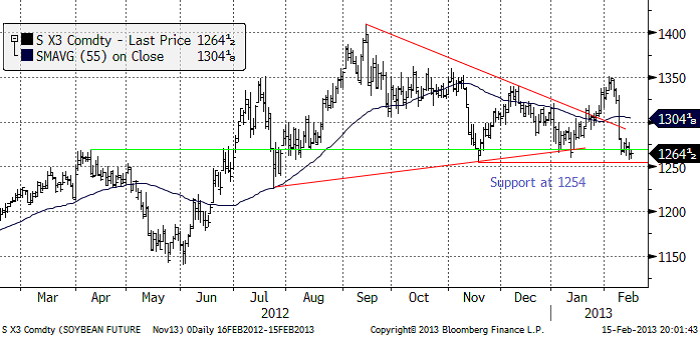
Sojabönorna (november 2013) fortsatte att röra sig nedåt, efter det stora prisfallet när WASDE-rapporten publicerades. 1254 cent är ett viktigt stöd. Bryts det kan prisfallet bli stort.
Norra Argentina / södra Braslien, som har varit torrt har blivit fuktigare och Mato Grosso, där det nu skördas, har det blivit torrare. Perfeito, tycker de säkert.
Om USA nu verkligen skulle bli mindre torrt, kan priset på sojabönor inleda en trend nedåt. Medan det är väldigt ”tight” för gammal skörd, tycks det kunna bli en mindre ansträngd situation för den nya skörden och det nya marknadsföringsåret.
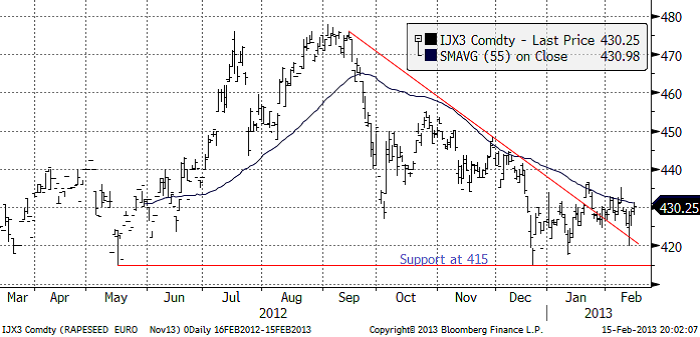
Raps
Rapspriset (november 2013) har fortsatt att röra sig ”sidledes” med ganska tvära kast. Det verkar finnas fyndköpare på 420 euro per ton. Det verkar också finnas en hel del spridda säljintressen kring 430 euro.
ABARE höjde den australiensiska canola-skörden till 3.1 mt (från 2.6 mt).
Vi fortsätter att ha en övervägande negativ vy på prisutvecklingen på raps.
[box]SEB Veckobrev Jordbruksprodukter är producerat av SEB Merchant Banking och publiceras i samarbete och med tillstånd på Råvarumarknaden.se[/box]
Disclaimer
The information in this document has been compiled by SEB Merchant Banking, a division within Skandinaviska Enskilda Banken AB (publ) (“SEB”).
Opinions contained in this report represent the bank’s present opinion only and are subject to change without notice. All information contained in this report has been compiled in good faith from sources believed to be reliable. However, no representation or warranty, expressed or implied, is made with respect to the completeness or accuracy of its contents and the information is not to be relied upon as authoritative. Anyone considering taking actions based upon the content of this document is urged to base his or her investment decisions upon such investigations as he or she deems necessary. This document is being provided as information only, and no specific actions are being solicited as a result of it; to the extent permitted by law, no liability whatsoever is accepted for any direct or consequential loss arising from use of this document or its contents.
About SEB
SEB is a public company incorporated in Stockholm, Sweden, with limited liability. It is a participant at major Nordic and other European Regulated Markets and Multilateral Trading Facilities (as well as some non-European equivalent markets) for trading in financial instruments, such as markets operated by NASDAQ OMX, NYSE Euronext, London Stock Exchange, Deutsche Börse, Swiss Exchanges, Turquoise and Chi-X. SEB is authorized and regulated by Finansinspektionen in Sweden; it is authorized and subject to limited regulation by the Financial Services Authority for the conduct of designated investment business in the UK, and is subject to the provisions of relevant regulators in all other jurisdictions where SEB conducts operations. SEB Merchant Banking. All rights reserved.

Brent crude is essentially flat on the week, but after a volatile ride. Prices started Monday near USD 65.5/bl, climbed steadily to a mid-week high of USD 67.8/bl on Wednesday evening, before falling sharply – losing about USD 2/bl during Thursday’s session.

Brent is currently trading around USD 65.8/bl, right back where it began. The volatility reflects the market’s ongoing struggle to balance growing surplus risks against persistent geopolitical uncertainty and resilient refined product margins. Thursday’s slide snapped a three-day rally and came largely in response to a string of bearish signals, most notably from the IEA’s updated short-term outlook.
The IEA now projects record global oversupply in 2026, reinforcing concerns flagged earlier by the U.S. EIA, which already sees inventories building this quarter. The forecast comes just days after OPEC+ confirmed it will continue returning idle barrels to the market in October – albeit at a slower pace of +137,000 bl/d. While modest, the move underscores a steady push to reclaim market share and adds to supply-side pressure into year-end.
Thursday’s price drop also followed geopolitical incidences: Israeli airstrikes reportedly targeted Hamas leadership in Doha, while Russian drones crossed into Polish airspace – events that initially sent crude higher as traders covered short positions.
Yet, sentiment remains broadly cautious. Strong refining margins and low inventories at key pricing hubs like Europe continue to support the downside. Chinese stockpiling of discounted Russian barrels and tightness in refined product markets – especially diesel – are also lending support.
On the demand side, the IEA revised up its 2025 global demand growth forecast by 60,000 bl/d to 740,000 bl/d YoY, while leaving 2026 unchanged at 698,000 bl/d. Interestingly, the agency also signaled that its next long-term report could show global oil demand rising through 2050.
Meanwhile, OPEC offered a contrasting view in its latest Monthly Oil Market Report, maintaining expectations for a supply deficit both this year and next, even as its members raise output. The group kept its demand growth estimates for 2025 and 2026 unchanged at 1.29 million bl/d and 1.38 million bl/d, respectively.
We continue to watch whether the bearish supply outlook will outweigh geopolitical risk, and if Brent can continue to find support above USD 65/bl – a level increasingly seen as a soft floor for OPEC+ policy.
Brent crude makes some gains as Israel’s attack on Hamas in Qatar rattles markets. Brent crude spiked to a high of USD 67.38/b yesterday as Israel made a strike on Hamas in Qatar. But it wasn’t able to hold on to that level and only closed up 0.6% in the end at USD 66.39/b. This morning it is starting on the up with a gain of 0.9% at USD 67/b. Still rattled by Israel’s attack on Hamas in Qatar yesterday. Brent is getting some help on the margin this morning with Asian equities higher and copper gaining half a percent. But the dark cloud of surplus ahead is nonetheless hanging over the market with Brent trading two dollar lower than last Tuesday.

Geopolitical risk premiums in oil rarely lasts long unless actual supply disruption kicks in. While Israel’s attack on Hamas in Qatar is shocking, the geopolitical risk lifting crude oil yesterday and this morning is unlikely to last very long as such geopolitical risk premiums usually do not last long unless real disruption kicks in.
US API data yesterday indicated a US crude and product stock build last week of 3.1 mb. The US API last evening released partial US oil inventory data indicating that US crude stocks rose 1.3 mb and middle distillates rose 1.5 mb while gasoline rose 0.3 mb. In total a bit more than 3 mb increase. US crude and product stocks usually rise around 1 mb per week this time of year. So US commercial crude and product stock rose 2 mb over the past week adjusted for the seasonal norm. Official and complete data are due today at 16:30.
A 2 mb/week seasonally adj. US stock build implies a 1 – 1.4 mb/d global surplus if it is persistent. Assume that if the global oil market is running a surplus then some 20% to 30% of that surplus ends up in US commercial inventories. A 2 mb seasonally adjusted inventory build equals 286 kb/d. Divide by 0.2 to 0.3 and we get an implied global surplus of 950 kb/d to 1430 kb/d. A 2 mb/week seasonally adjusted build in US oil inventories is close to noise unless it is a persistent pattern every week.
US IEA STEO oil report: Robust surplus ahead and Brent averaging USD 51/b in 2026. The US EIA yesterday released its monthly STEO oil report. It projected a large and persistent surplus ahead. It estimates a global surplus of 2.2 m/d from September to December this year. A 2.4 mb/d surplus in Q1-26 and an average surplus for 2026 of 1.6 mb/d resulting in an average Brent crude oil price of USD 51/b next year. And that includes an assumption where OPEC crude oil production only averages 27.8 mb/d in 2026 versus 27.0 mb/d in 2024 and 28.6 mb/d in August.
Brent will feel the bear-pressure once US/OECD stocks starts visible build. In the meanwhile the oil market sits waiting for this projected surplus to materialize in US and OECD inventories. Once they visibly starts to build on a consistent basis, then Brent crude will likely quickly lose altitude. And unless some unforeseen supply disruption kicks in, it is bound to happen.
US IEA STEO September report. In total not much different than it was in January

US IEA STEO September report. US crude oil production contracting in 2026, but NGLs still growing. Close to zero net liquids growth in total.

Brent crude touched a low of USD 65.07 per barrel on Friday evening before rebounding sharply by USD 2 to USD 67.04 by mid-day Monday. The rally came despite confirmation from OPEC+ of a measured production increase starting next month. Prices have since eased slightly, down USD 0.6 to around USD 66.50 this morning, as the market evaluates the group’s policy, evolving demand signals, and rising geopolitical tension.
On Sunday, OPEC+ approved a 137,000 barrels-per-day increase in collective output beginning in October – a cautious first step in unwinding the final tranche of 1.66 million barrels per day in voluntary cuts, originally set to remain off the market through end-2026. Further adjustments will depend on ”evolving market conditions.” While the pace is modest – especially relative to prior monthly hikes – the signal is clear: OPEC+ is methodically re-entering the market with a strategic intent to reclaim lost market share, rather than defend high prices.
This shift in tone comes as Saudi Aramco also trimmed its official selling prices for Asian buyers, further reinforcing the group’s tilt toward a volume-over-price strategy. We see this as a clear message: OPEC+ intends to expand market share through steady production increases, and a lower price point – potentially below USD 65/b – may be necessary to stimulate demand and crowd out higher-cost competitors, particularly U.S. shale, where average break-evens remain around WTI USD 50/b.
Despite the policy shift, oil prices have held firm. Brent is still hovering near USD 66.50/b, supported by low U.S. and OECD inventories, where crude and product stocks remain well below seasonal norms, keeping front-month backwardation intact. Also, the low inventory levels at key pricing hubs in Europe and continued stockpiling by Chinese refiners are also lending resilience to prices. Tightness in refined product markets, especially diesel, has further underpinned this.
Geopolitical developments are also injecting a slight risk premium. Over the weekend, Russia launched its most intense air assault on Kyiv since the war began, damaging central government infrastructure. This escalation comes as the EU weighs fresh sanctions on Russian oil trade and financial institutions. Several European leaders are expected in Washington this week to coordinate on Ukraine strategy – and the prospect of tighter restrictions on Russian crude could re-emerge as a price stabilizer.
In Asia, China’s crude oil imports rose to 49.5 million tons in August, up 0.8% YoY. The rise coincides with increased Chinese interest in Russian Urals, offered at a discount during falling Indian demand. Chinese refiners appear to be capitalizing on this arbitrage while avoiding direct exposure to U.S. trade penalties.
Going forward, our attention turns to the data calendar. The EIA’s STEO is due today (Tuesday), followed by the IEA and OPEC monthly oil market reports on Thursday. With a pending supply surplus projected during the fourth quarter and into 2026, markets will dissect these updates for any changes in demand assumptions and non-OPEC supply growth. Stay tuned!


Kinas elproduktion slog nytt rekord i augusti, vilket även kolkraft gjorde

Det stigande guldpriset en utmaning för smyckesköpare

Aktier i guldbolag laggar priset på guld
Volatile but going nowhere. Brent crude circles USD 66 as market weighs surplus vs risk

Guld når sin högsta nivå någonsin, nu även justerat för inflation

Meta bygger ett AI-datacenter på 5 GW och 2,25 GW gaskraftverk
Aker BP gör ett av Norges största oljefynd på ett decennium, stärker resurserna i Yggdrasilområdet
Brent sideways on sanctions and peace talks

Ett samtal om koppar, kaffe och spannmål
Sommarens torka kan ge högre elpriser i höst
-
 Nyheter4 veckor sedan
Meta bygger ett AI-datacenter på 5 GW och 2,25 GW gaskraftverk
-
 Nyheter4 veckor sedan
Aker BP gör ett av Norges största oljefynd på ett decennium, stärker resurserna i Yggdrasilområdet
-
Analys4 veckor sedan
Brent sideways on sanctions and peace talks
-
 Nyheter4 veckor sedan
Ett samtal om koppar, kaffe och spannmål
-
 Nyheter4 veckor sedan
Sommarens torka kan ge högre elpriser i höst
-
Analys4 veckor sedan
Brent edges higher as India–Russia oil trade draws U.S. ire and Powell takes the stage at Jackson Hole
-

 Nyheter3 veckor sedan
Mahvie Minerals är verksamt i guldrikt område i Finland
-
Analys3 veckor sedan
Increasing risk that OPEC+ will unwind the last 1.65 mb/d of cuts when they meet on 7 September