

Analys
SEB Jordbruksprodukter, 15 april 2013

 Två tunga USDA-rapporter har kommit med tätt mellanrum. Lagerstatistiken fick vete, majs och sojabönor på fall. April månads WASDE-rapport fick däremot inte några stora effekter på marknaden. Marknaden tyckte nog att de förändringar som analytikerna på USDA gjorde låg inom felmarginalen. De största förändringarna gjordes för Kina.
 Det riktiga vilda västern hittar vi dock på den tidigare stillsamma mjölk-marknaden. Fonterras pris på skummjölkspulver har gått upp med nästan 100% sedan årsskiftet. Oroliga kinesiska föräldrar dammsuger världsmarknaden på mjölkersättningspulver. Till och med the Financial Times berättar om smugglingen av burkar till Kina. Livsmedelskedjor i Storbritannien har startat ransonering av den det åtråvärda pulvret. En kylig vy på detta vore kanske att sälja terminer på SMP för att säkra ett högt pris under det kommande året.
Odlingsväder
Det har regnat kring Mississippi-floden och temperaturen har varit kall. Det har bland annat förekommit rapporter om frostskador från USA. Vädret i Europa har slagit om till både varmare och fuktigare, vilket vi märkte av i helgen här i Sverige. Nedan ser vi senaste Drought Monitor för USA:
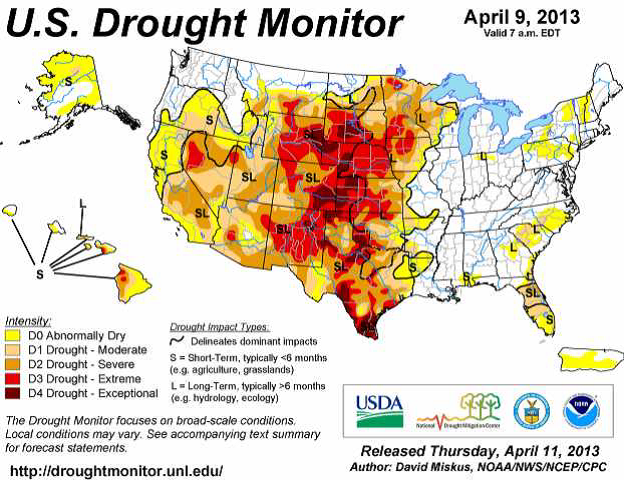
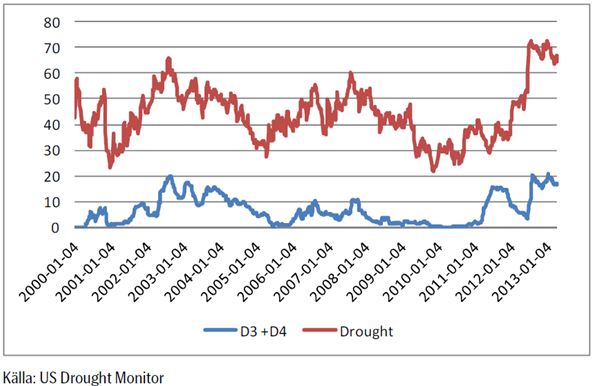
Vi ser att torkan har försvunnit nästan helt från östra halvan av USA. För USA som helhet är fortfarande 66% torrare än normalt eller torkdrabbat. Andelen av USA som är drabbat av de två mest extrema formerna av torka ligger kvar på strax under 20%.
Vete
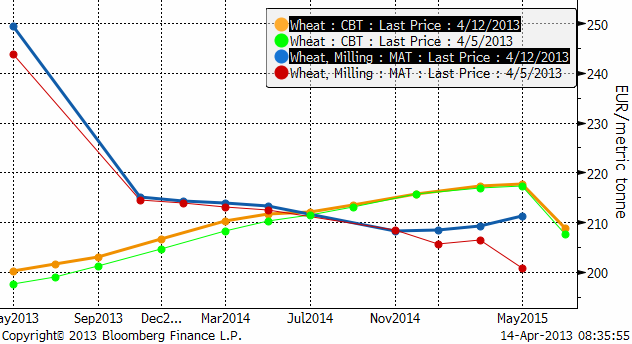
Priset på november (2013) föll omedelbart från 220 euro ner till under 210 euro när lagerstatistiken publicerades av USDA för två veckor sedan. Efter att marknaden hade stirrat sig blind på lagerstatistiken hade man inte tänkt på att crop condition skulle rapporteras igen efter vinteruppehållet på annandag Påsk.
Sista mätningen före vintervilan låg på usla 33% och siffran kom därför föga förvånande in på 34%, uselt alltså. Det fick priset att stiga upp mot 215 igen. Förra veckan siffra var återigen en ökning av ”good/excellent” condition och det gav marknaden en anledning att sälja vetet. Så kom WASDE-rapporten i onsdags som marknaden inte gillade heller. Lagernivåerna ligger betydligt högre än förra månaden. Men med detta ur världen är det nu mer fråga om hur vädret ska utveckla sig de närmaste två-tre månaderna än något annat.
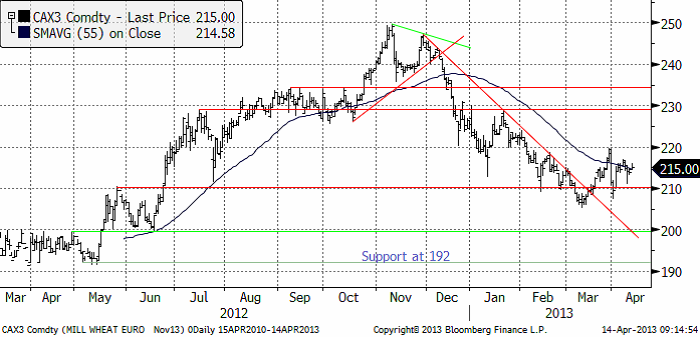
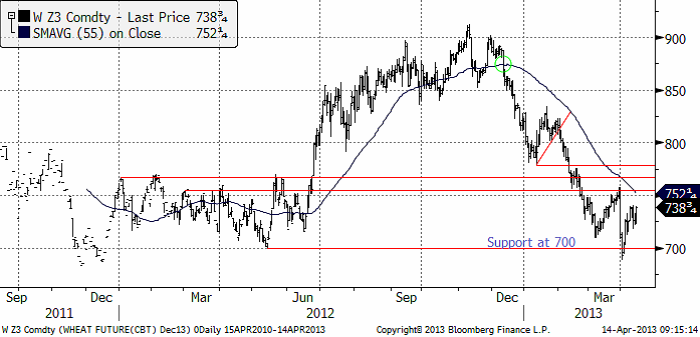
Decemberkontraktet på CBOT var nere och rörde vid 700 cent, som i all fall för närvarande kan betraktas som en bottennivå. Vi har i princip haft sidledes prisrörelse sedan början av mars och det finns ännu inte något som får mig att tro något annat.
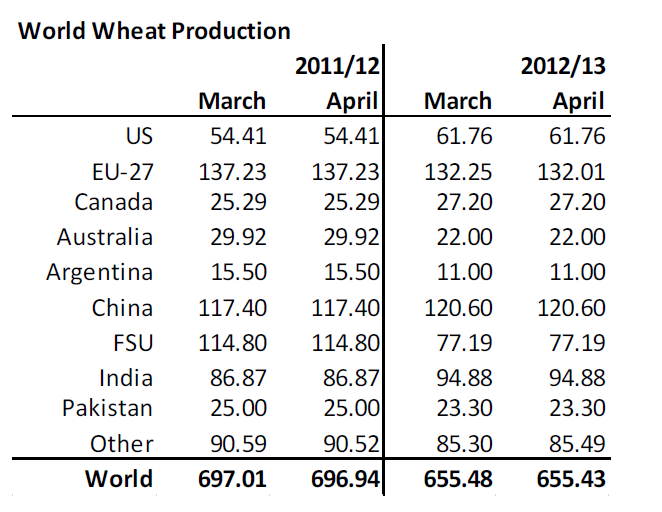
Onsdagens WASDE-rapport är i princip oförändrad vad gäller produktionsestimaten. USDA sänkte inte Argentinas skörd, utan höll den kvar på 11 mt. På Argentinas Bolsa de Cereales hemsida kan man läsa att de tror på 9.8 mt och så har det varit ett tag. Man får väl anta att man har bättre koll på läget i Buenos Aires än i Washington, så vi ska nog räkna med lite lägre global produktion än vad USDA gör.
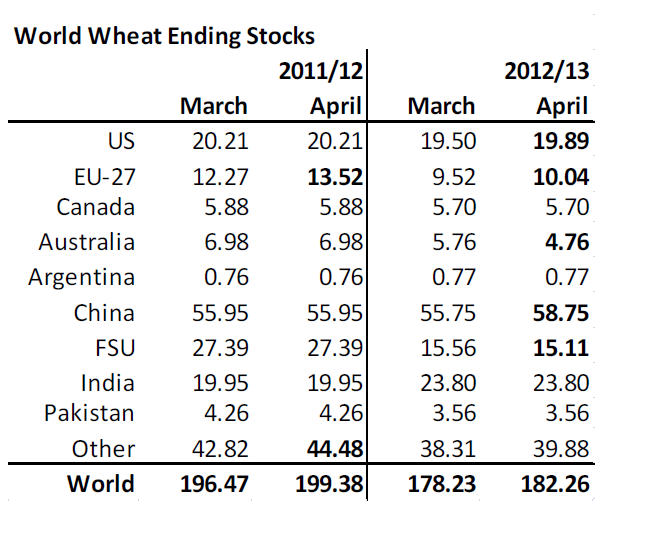
Om vi så ser till utgående lager nedan, höjdes de med 4 mt. Det beror dels på en höjning av EU:s utgående lager med drygt 1 mt, dels på lägre foderefterfrågan i USA och en uppskrivning av lagren i Kina med 3 mt. Det kan förstås hända att man har goda skäl till detta, men frågan är om ens kineserna har stenkoll på lagernivåerna i sitt stora land.
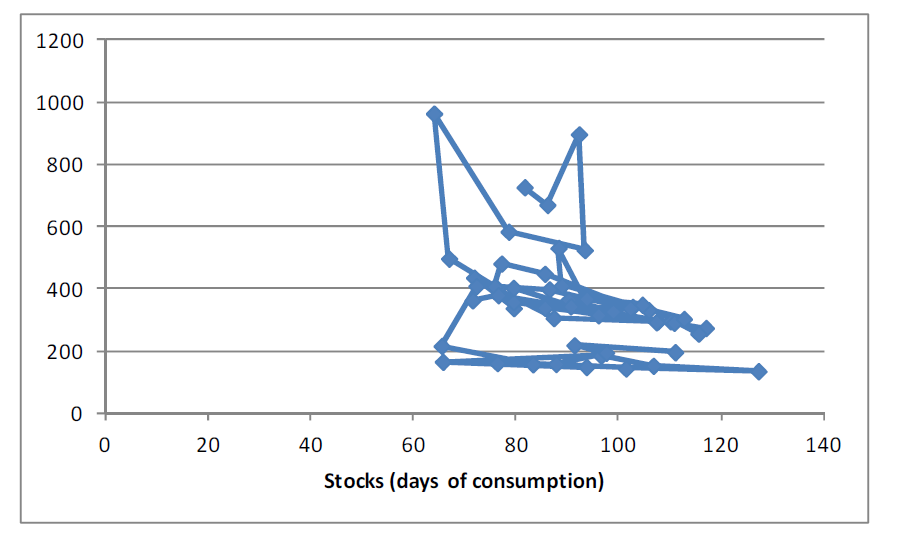
Siffran för utgående lager ligger 4 mt högre i aprilrapporten jämfört med förra månaden. Efter ett initialt prisfall fattade dock marknaden att USDA:s höjningar vilar på ganska osäker grund. En höjning av Kinas lager måste anses hugget som stucket och att man inte sänkte skörden minst 1 mt i Argentina talar egentligen mot bättre vetande (i Argentina). Det initiala prisfallet återhämtades alltså ganska omgående. Nedan ser vi lagernivåerna för varje april bakåt årsvis bakåt i tiden och priset i cent / bushel på Chicagovete. Vi ser att priset nu ser ut att ligga i linje med de senaste årens förhållande mellan lager och pris. Ju lägre lager desto högre pris, och vice versa. Rapporten gav alltså ingen riktning att handla på. Det talar fortsatt för ”sidledes” prisrörelse. Marknaden får ta input från väderutvecklingen för att hitta en riktning att handla på.
Terminskurvorna visar högre priser för gammal skörd den senaste veckan (fredag till fredag). De längre terminskontrakten har inte förändrats prismässigt alls.
Crop progress är en statistik att följa nu när lagerstatistiken och WASDE:n är avklarade. Måndagens Crop Progress från USDA visar på små förändringar gällande tillståndet för det amerikanska höstvetet, men det finns vissa tecken på en viss förbättring – även om de är små. 30% av grödorna klassas fortfarande som ”poor/very poor”, precis som i förra veckan, men 36% av grödorna klassas nu som ”good/excellent” jämfört med 34% veckan innan. Vid denna tid förra året var dock 61% klassat som ”good/excellent” och bara 10% klassat som ”poor/very poor”.
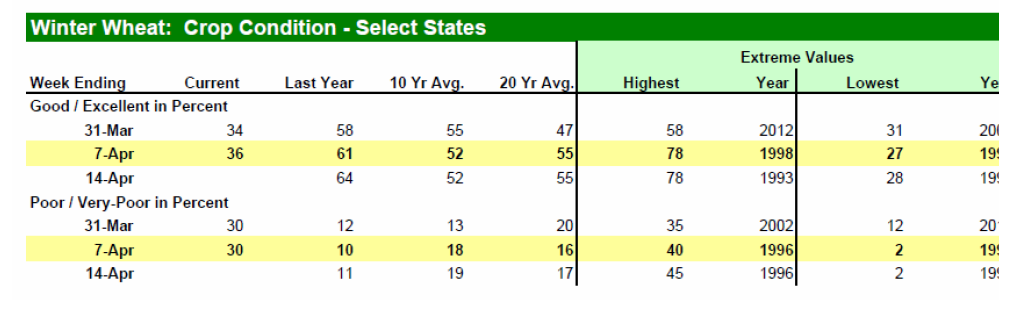
Grödornas tillstånd varierar kraftigt mellan olika regioner och stater. I Kalifornien klassas 95% som ”good/excellent” och andra stater med en hög andel höstvete klassat som ”good/excellent” är bl.a Illinois, Indiana, Missouri, North Carolina och Washington. Förutsättningarna är dock mindre gynnsamma i flera av de viktiga veteproducerande staterna. I Kansas klassas 31% av grödorna som ”good/excellent” medan 31% av dem klassas som ”poor/very poor”. I Oklahoma är fördelningen 28% / 33% medan endast 17% av grödorna i Texas klassas som ”good/excellent” medan 51% klassas som ”poor/very poor”.

Crop progress-rapporten som kommer på kvällen den 15 april förväntas även innehålla sådd av majs för första gången i år. Vi fortsätter tro på sidledes prisrörelse tills vidare. Vi har sett de högsta priserna för året – om det inte blir en rejäl torka i år igen. Allt annat lika bör man passa på att sälja på uppgångar tycker jag.
Maltkorn
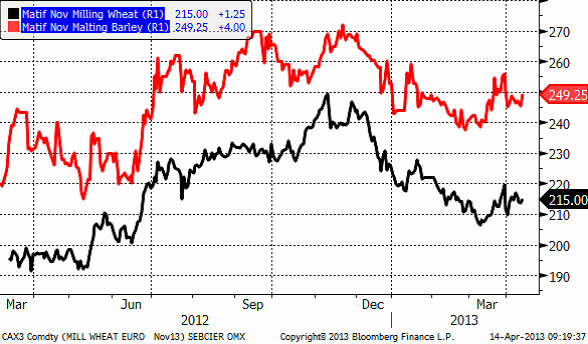
Priset på maltkorn med leverans i november visade mer styrka än vetet för en månad sedan, men har planat ut och går nu som vetet, men avslutade veckan med att stiga med 4 euro samtidigt som vetet bara steg med 1.25 euro.
Majs
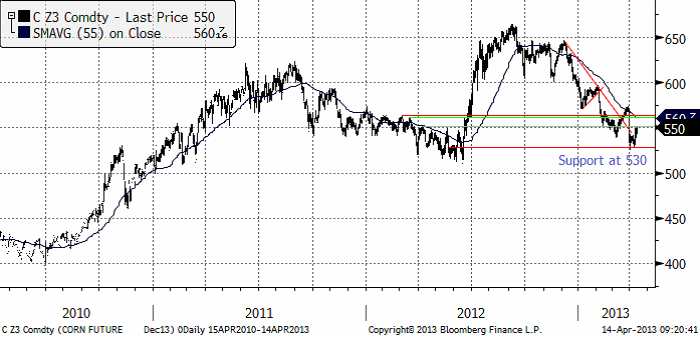
Majspriset (december 2013) har rekylerat ner mot 530 cent, där priset hittat stöd. Den senaste veckan har priset stigit till 550 cent och det gick fort. Lite som en studs på botten.
WASDE-rapporten från USDA visade 2 mt högre global produktion. Det beror på en höjning av Brasiliens skörd, till 74 mt från 72.5. Detta är dock fortfarande lägre än CONAB:s estimat som ligger 3.5 mt högre än USDA:s. Safrinha:n (andra skörden) har utvecklar sig enligt andra rapporter bra i Brasilien.
Globala utgående lager höjdes 8 mt från 117.48 mt av USDA. Av det ligger 3 i USA och 3 i Kina. I USA är det lägre foderefterfrågan men högre etanolefterfrågan. I Kina har vi ingen aning om vad det är som ligger bakom, egentligen. Vi kan notera att av ökningen i vete+majs-lager står Kina för en betydande del. Det är möjligt att detta är rimligt, med tanke på vilka effekter som fågelinfluensan kan få i framtiden för foderefterfrågan, men lager i Kina lär i vart fall inte komma ut på världsmarknaden om de skulle behövas.
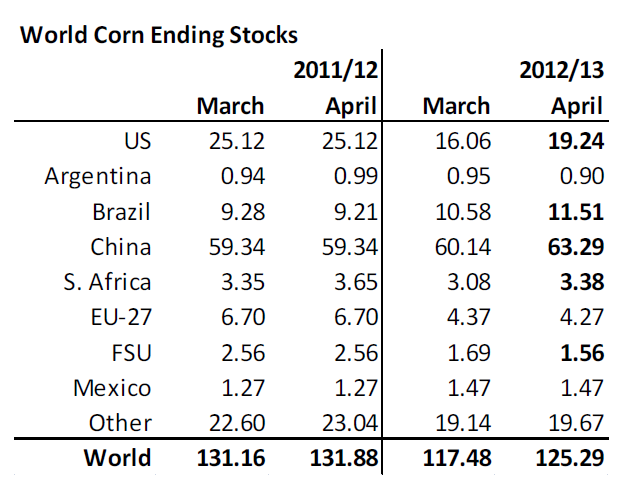
Marknaden tog den här höjningen med en nypa salt, och handlade upp priset. Men från den här punkten är det vädret i USA (och på andra håll) som avgör. Vädret i Brasilien är bra och jag tror att CONAB:s prognos är mer rätt än USDA:s. Nedan ser vi lager och pris. Både lager och pris är som vi ser praktiskt taget på samma nivå som förra året.
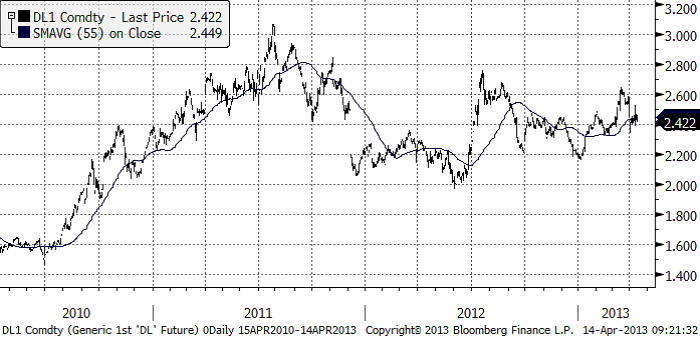
Råoljepriset har fallit en tid och Brent-oljepriset har fallit ner till 103 dollar (från ca 110 – 115 för en månad sedan. Etanolpriset har däremot hållit sig, som vi ser i diagrammet nedan. Men det borde finnas en viss press på det – nedåt – från oljan.
Vi gör samma tolkning som i förra veckobrevet för två veckor sedan. Att vi har sett de högsta priserna och om vädret fortsätter att förbättras är det nedsida som gäller.
Sojabönor
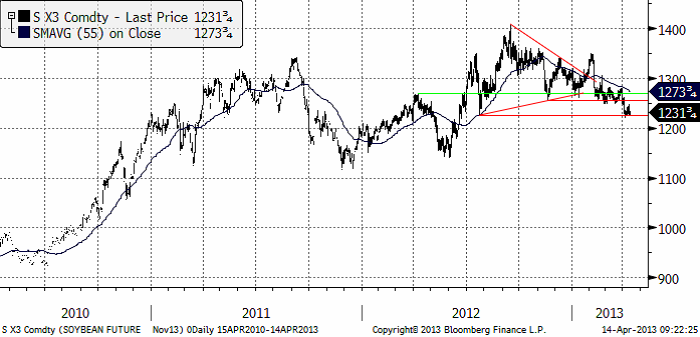
Sojabönorna (november 2013) har fallit ner till 1231, strax ovanför ”nästa” tekniska stöd efter att den långvariga stödnivån på 1270-nivån bröts. Tekniskt ser det väldigt ”bearish” ut. 1150 ser ut att kunna vara nästa anhalt på vägen ner.
USDA justerade upp global skörd med drygt 1.5 mt – i Paraguay och Uruguay. Man lämnade skörden oförändrad i Argentina och Brasilien. Brasilien kan vi kommentera här: Conab (det nationella bolaget för matförsörjning) estimerar en skörd på 81.5 mt. Noticias Agricolas (ledande jordbrukstidning kopplad till jordbruksdepartementet) skrev den 8 april att skörden blir 82.5, 20% mer än förra året. Just nu är skörden till 80% klar enligt lokala tidningar.
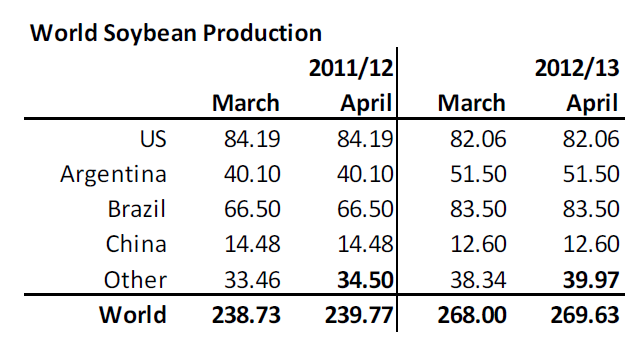
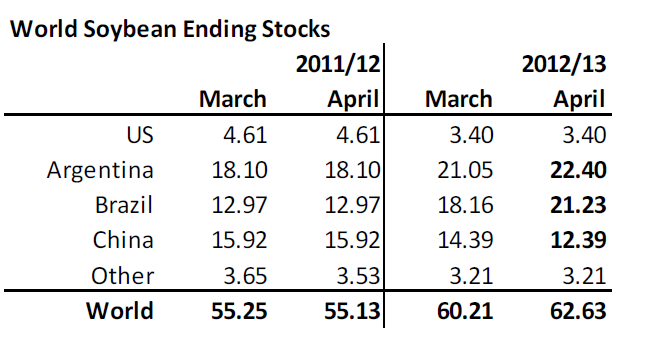
Estimatet för utgående lager höjdes med drygt 2 mt. Höjningarna väntas ske i Argentina och Brasilien, vilket är rimligt att anta givet de mycket större skördarna där och köerna för lastning vid hamnarna (och lägre priser för lantbrukarna inne i landet pga detta). Kinas lager väntas minska och det beror på att man antagit att Kinas import minskar med 3 mt.
Nedan ser vi pris I förhållande till lager. Mot bakgrund av de senaste årens relation mellan pris och lager, ser priset ”högt” ut. Vid den här lagernivån ser ett pris på 1200 eller strax under det motiverat ut.
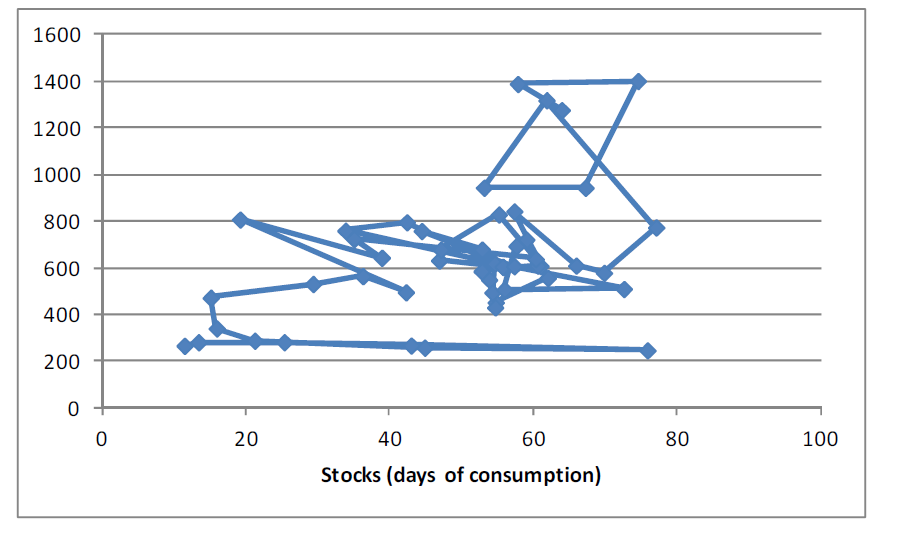
Vi tror att priset kommer att fortsätta falla och rekommenderar en såld position i sojabönor.
Raps
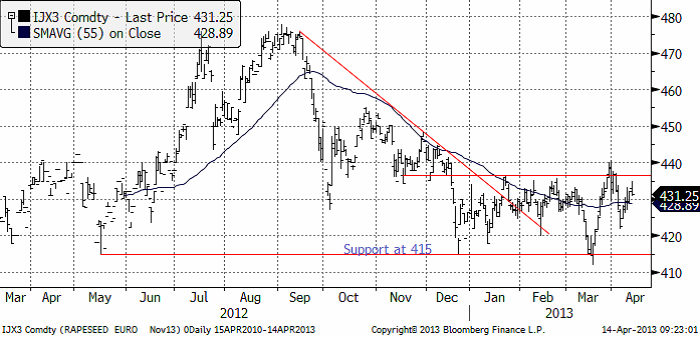
Rapspriset (november 2013) har rekylerat uppåt, vilket vi tror är ett säljtillfälle. I synnerhet om priset på sojabönor fortsätter att sjunka.
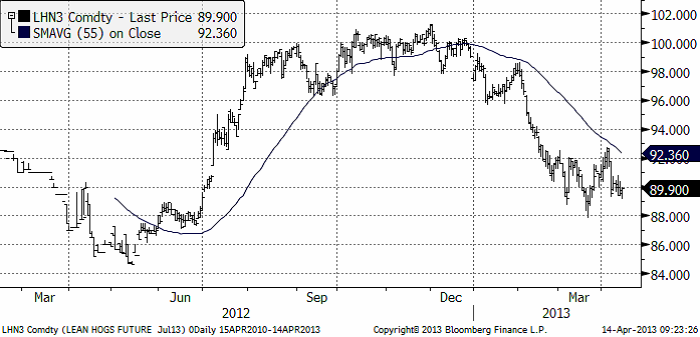
Gris
Grispriset (September 13) som tagit en paus i prisnedgången i drygt en månad, ser ut att kunna fortsätta sin nedgång i veckan som kommer.
Mjölk
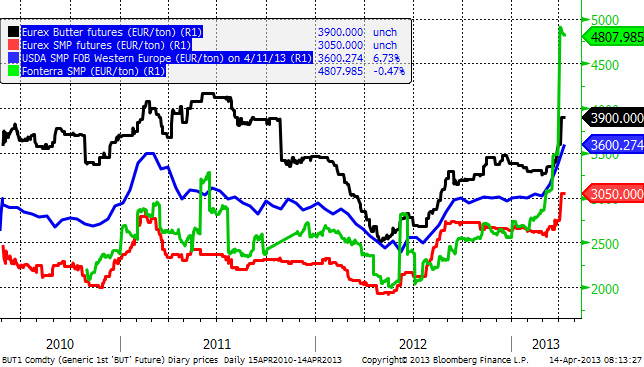
Mjölkmarknaden befinner sig i mega-hausse. Fonterra-priset på SMP har fördubblats i år från 2500 till 4807 euro per ton. The Financial Times skrev i måndags förra veckan om hur flera engelska livsmedelskedjor endast tillåter kunder att köpa två burkar med mjölkersättning för spädbarn. Anledningen är att det uppstått brist därför att vissa personer köper burkar och skickar till Kina. Tidningen skriver att en vanlig burk som kanske kostar 60 – 90 kr i Sverige kan kosta tre gånger så mycket i Kina. Det sägs till och med att resorna till Australien från Kina har blivit fullbokade pga inköpen av mjölkersättning. Melaminskandalen häromåret och andra incidenter har fått kinesiska föräldrar att undvika inhemskt producerade produkter. Med ettbarnspolitiken finns tas inga risker av försiktiga föräldrar, tydligen.
I kursdiagrammet nedan ser vi priserna på Fonterras SMP, USDA:s prisnotering på SMP i Europa och Eurexbörsens pris, samt Eurex pris på smör. Alla priser är angivna i euro per ton.
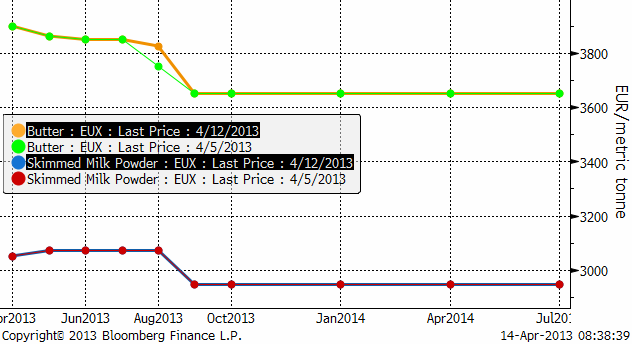
Nedan ser vi terminskurvorna för smör och skummjölkspulver på Eurex.
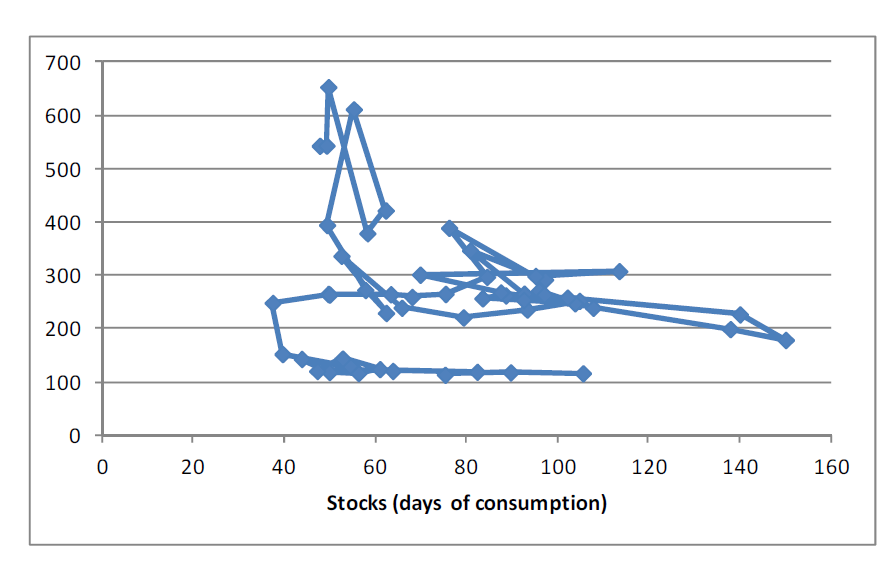
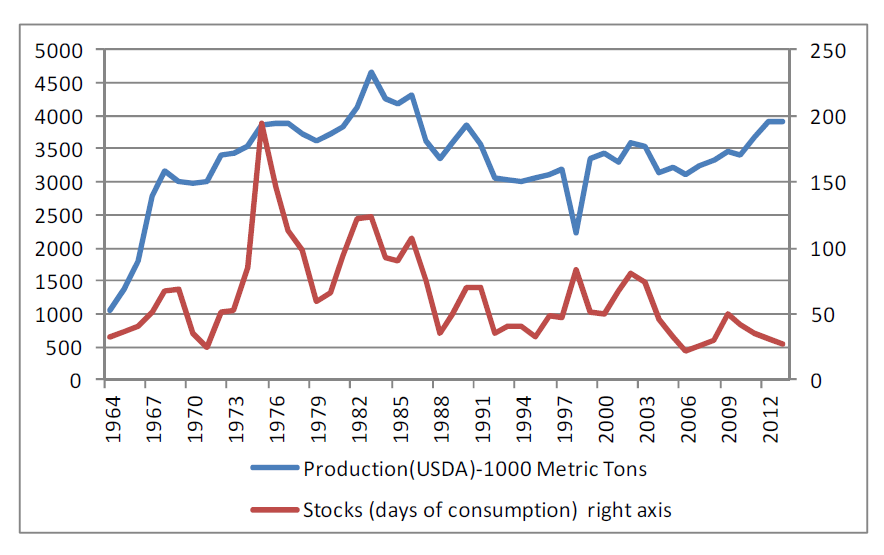
USDA publicerar även statistik på mjölk och mjölkprodukter. I diagrammet nedan ser vi global produktion av
SMP sedan 1965 och estimerade utgående lager i termer av antal dagars konsumtion. Vi ser att globala lager av SMP är på riktigt låga nivåer i ett historiskt perspektiv. Lagren väntas räcka i 27 dagar. År 2006 var det 22 dagar och den lägsta lagernivån på 49 år. Detta är långt från de 81 dagars lager som fanns för 11 år sedan.
SEB Commodities erbjuder ett litet ”prova-på” kontrakt som består av 0.5 ton Eurex-smör och 0.9 ton Eurex SMP. Ett paket som motsvarar 10 ton flytande mjölkråvara. Just nu är det underliggande värdet på ett sådant kontrakt drygt 33 000 kronor.
Den som vill följa priset på SMP på Eurex gör det via länken:
www.eurexchange.com/exchange-en/products/com/agr/14016/
[box]SEB Veckobrev Jordbruksprodukter är producerat av SEB Merchant Banking och publiceras i samarbete och med tillstånd på Råvarumarknaden.se[/box]
Disclaimer
The information in this document has been compiled by SEB Merchant Banking, a division within Skandinaviska Enskilda Banken AB (publ) (“SEB”).
Opinions contained in this report represent the bank’s present opinion only and are subject to change without notice. All information contained in this report has been compiled in good faith from sources believed to be reliable. However, no representation or warranty, expressed or implied, is made with respect to the completeness or accuracy of its contents and the information is not to be relied upon as authoritative. Anyone considering taking actions based upon the content of this document is urged to base his or her investment decisions upon such investigations as he or she deems necessary. This document is being provided as information only, and no specific actions are being solicited as a result of it; to the extent permitted by law, no liability whatsoever is accepted for any direct or consequential loss arising from use of this document or its contents.
About SEB
SEB is a public company incorporated in Stockholm, Sweden, with limited liability. It is a participant at major Nordic and other European Regulated Markets and Multilateral Trading Facilities (as well as some non-European equivalent markets) for trading in financial instruments, such as markets operated by NASDAQ OMX, NYSE Euronext, London Stock Exchange, Deutsche Börse, Swiss Exchanges, Turquoise and Chi-X. SEB is authorized and regulated by Finansinspektionen in Sweden; it is authorized and subject to limited regulation by the Financial Services Authority for the conduct of designated investment business in the UK, and is subject to the provisions of relevant regulators in all other jurisdictions where SEB conducts operations. SEB Merchant Banking. All rights reserved.

Market is starting to take US/Iran headlines with a pinch of salt. Brent crude rose $2.8/b yesterday to an official close of $112.1/b. But after that it traded as low as $108.05/b before ending late night at around $109.7/b. Through the day it traded in a range of $106.87 – 112.72/b amid a flurry of news or rumors from Iran and the US. ”US temporary sanctions during negotiations” (falls alarm). ”We will bomb Iran” (not anyhow),… etc. While the market is still fluctuating to this kind of news flow, it is starting to take such headlines with a pinch of salt.

We’ll see. Maybe, maybe not. The Brent M1 contract is trading at $110.2/b this morning which very close to the average ticks through yesterday of $110.4/b.
Trump with bearish, verbal intervention whenever Brent trades above $110/b it seems. What seems to be a pattern is that Trump states something like ”very good negotiations going on with Iran”, ”New leaders in Iran are great,..”, ”Great progress in negotiations,…”, ”Deal in sight,..” etc whenever the Brent M1 contract trades above $110/b. An effort to cool the market. These hot air verbal interventions from Trump used to have a heavy bearish impact on prices, but they now seems to have less and less effect unless they are backed by reality.
As far as we can see there has been no real progress in the negotiations between the US and Iran with both sides still standing by their previous demands.
Iran is getting stronger while the cease fire lasts making a return to war for Trump yet harder. Iran is naturally in constant preparation for a return to war given Trump’s steady threats of bombing Iran again. Iran is naturally doing what ever is possible to prepare for a return to war. And every day the cease fire lasts it is better prepared. This naturally makes it more and more difficult and dangerous for the US to return to warring activity versus Iran as the consequences for energy infrastructure in the Persian Gulf will be more and more severe the longer the cease fire lasts. Israel seems to see it this way as well. That the war is not won and that current frozen state of a cease fire gives Iran opportunity to rebuild military and politically.
Global inventories are drawing down day by day. How much? In the meantime the Strait of Hormuz stays closed. There is varying measures and estimates of how much global inventories are drawing down. Our rough estimate, back of the envelope, is that global inventories are drawing down by at least some 10 mb/d or about 300 mb/d in a balance between loss of supply versus demand destruction. Other estimates we see are a monthly draw of 250-270 mb/d. The IEA only ’measured’ a draw in global observable stocks of 117 mb in April with oil on water rising 53 mb while on shore stocks fell 170 mb. But global stocks are hard to measure with large invisible, unmeasured stocks. As such a back of the envelope approach may be better.
Oil products is what the world is consuming. Oil product prices likely to rise while product stocks fall. Strategic Petroleum Reserves (SPR) are predominantly crude oil. Discharging oil from OECD SPR stocks, a sharp reduction in Chinese crude imports and a reduction in global refinery throughput of 6-7 mb/d has helped to keep crude oil markets satisfactorily supplied. But global inventories are drawing down none the less. And oil products is really what the world is consuming. So if global refinery throughput stays subdued, then demand will eventually have to match the supply of oil products. The likely path forward this summer is a steady draw down in jet fuel, diesel and gasoline. Higher prices for these. Then, if possible, higher refinery throughput and higher usage of crude in response to very profitable refinery margins. And lastly sharper draw in crude stocks and higher prices for these. But some 6 mb/d of oil products used to be exported through the Strait of Hormuz. And it may not be so easy to ramp up refinery activity across the world to compensate. Especially as Ukraine continues to damage Russian refineries as well as Russian crude production and export facilities.
Watch oil product stocks and prices as well as Brent calendar 2027. What to watch for this summer is thus oil product inventories falling and oil product premiums to crude rising. Another measure to watch is the Brent crude 2027 contract as it rises steadily day by day as the Strait of Hormuz stays closed and global oil inventories decline. The latter is close to the highest level since the start of the war and keeps rising.
The Brent M1 contract and the Brent 2027 prices and current price of jet fuel in Europe (ARA). All in USD/b

Our back of the envelope calculation of the global shortage created by the closure of the Strait of Hormuz. Note that 3.5 mb/d of discharge from SPR is also a draw. Note also that ’Forced demand loss’ of 2.5 mb/d is probably temporary and will fall back towards zero as logistics are sorted out leaving ’Price demand loss’ to do the job of balancing the market. Thus a shortfall of at least 9 mb/d created by the closure. More if SPR discharge is included and more if Forced demand loss recedes.

Brent is climbing higher. Front-month is at USD 106.3/bl this morning, close to a weekly high and a USD 9/bl jump from Mondays open. This is the move we flagged as a risk earlier in the week: the market shifting from ”a deal is around the corner” to ”this is going to take longer than we thought”.

Analyst Commodities, SEB
During April, rest-of-year Brent remained remarkably stable around USD 90/bl. A stability which rested on one single assumption: the SoH reopens around 1 May. That assumption is now slowly falling apart.
As we highlighted yesterday: every week of delay beyond 1 May adds (theoretically) ish USD 5/bl to the rest-of-year average, as global inventories draw 100 million barrels per week. i.e., a mid-May reopening implies rest-of-year Brent closer to USD 100/bl, and anything pushing into June or July takes us meaningfully higher.
What’s changed in the last 48 hours:
#1: The US military has formally warned that clearing suspected sea mines from SoH could take up to six months. That is a completely different timescale from what the financial market is pricing. Even a political deal tomorrow does not immediately reopen the strait.
#2: Trump has shifted his tone from urgency to ”strategic patience”. In yesterday’s press conference: ”Don’t rush me… I want a great deal.” The market is reading this as a president no longer feeling pressured by timelines, with the naval blockade running in the background.
#3: So far, the military activity is escalating, not de-escalating. Axios reports Iran is laying more mines in SoH. The US 3rd carrier strike group (USS George H.W. Bush) is arriving with two countermine vessels. Trump yesterday ordered the US Navy to destroy any Iranian boats caught laying mines. While CNN reports that the Pentagon is actively drawing up plans to strike Iranian SoH capabilities and individual Iranian military leaders if the ceasefire collapses. i.e., NOT a attitude consistent with an imminent deal!
Spot crude and product prices eased off the early-April highs on a combination of system rerouting and deal optimism. Both now weakening. Goldman estimates April Gulf output is reduced by 14.5 mbl/d, or 57% of pre-war supply, a number that keeps getting worse the longer this drags on.
Demand-side adaptation is ongoing: S. Korea has cut its Middle East crude dependence from 69% to 56% by pulling more from the Americas and Africa, and Japan is kicking off a second round of SPR releases from 1 May. But SPRs are finite.
Ref. to the negotiations, we should not bet on speed. The current Iranian leadership is dominated by genuine hardliners willing to absorb economic pain and run the clock to extract concessions. That is not a setup for a rapid resolution. US/Israeli media briefings keep framing the delay as ”internal Iranian divisions”, the reality is more complicated and points toward weeks and months, not days.
Our point is that the complexity is large, and higher prices have only just started (given a scenario where the negotiations drag out in time). The market spent April leaning on the USD 90/bl rest-of-year assumption; that case is diminishing by the hour. If ”early May reopening” is replaced by ”June, July or later” over the next week or two, both crude and products have meaningful room to reprice higher from here. There is a high risk being short energy and betting on any immediate political resolution(!).
Down on Friday. Up on Monday. The Brent June crude oil contract traded down 5.1% last week to a close of $90.38/b. It reached a high of $103.87/b last Monday and a low of $86.09/b on Friday as Iran announced that the Strait of Hormuz was fully open for transit. That quickly changed over the weekend as the US upheld its blockade of Iranian oil exports while Iran naturally responded by closing the SoH again. The US blew a hole in the engine room of the Iranian ship TOUSKA and took custody of the ship on Sunday. Brent crude is up 5.6% this morning to $95.4/b.
The cease-fire is expiring tomorrow. The US has said it will send a delegation for a second round of negotiations in Islamabad in Pakistan. But Iran has for now rejected a second round of talks as it views US demands as unrealistic and excessive while the US is also blocking the Strait of Hormuz.
While Brent is up 5% this morning, the financial market is still very optimistic that progress will be made. That talks will continue and that the SoH will fully open by the start of May which is consistent with a rest-of-year average Brent crude oil price of around $90/b with the market now trading that balance at around $88/b.
Financial optimism vs. physical deterioration. We have a divergence where the financial market is trading negotiations, improvements and resolution while at the same time the physical market is deteriorating day by day. Physical oil flows remain constrained by disrupted flows, longer voyage times and elevated freight and insurance costs.
Financial markets are betting that a US/Iranian resolution will save us in time from violent shortages down the road. But every day that the SoH remains closed is bringing us closer to a potentially very painful point of shortages and much higher prices.
The US blockade is also a weapon of leverage against its European and Asian allies. When Iran closed the SoH it held the world economy as a hostage against the US. The US blockade of the SoH is of course blocking Iranian oil exports. But it is also an action of disruption directed towards Europe and Asia. The US has called for the rest of the world to engaged in the war with Iran: ”If you want oil from the Persian Gulf, then go and get it”. A risk is that the US plays brinkmanship with the global oil market directed towards its European and Asian allies and maybe even towards China to force them to engage and take part. Maybe unthinkable. But unthinkable has become the norm with Trump in the White House.


Oil product price pain is set to rise as the Strait of Hormuz stays closed into summer

Solkraften pressar elpriserna dagtid

Michel Gubel ger sin syn på oljemarknaden


