

Analys
SEB Jordbruksprodukter, 13 maj 2013


 45 mt högre veteskörd globalt och 6 mt högre lager är USDA:s första prognos för säsongen 2013/14, som kom i fredags klockan 18:00 svensk tid. WASDE-rapporten indikerar att rätt pris för vete, sojabönor och majs är väsentligt lägre än dagens höga priser. Lantbrukare som inte prissäkrat sin skörd av spannmål eller raps borde göra det, åtminstone till en betydande del.
Vete
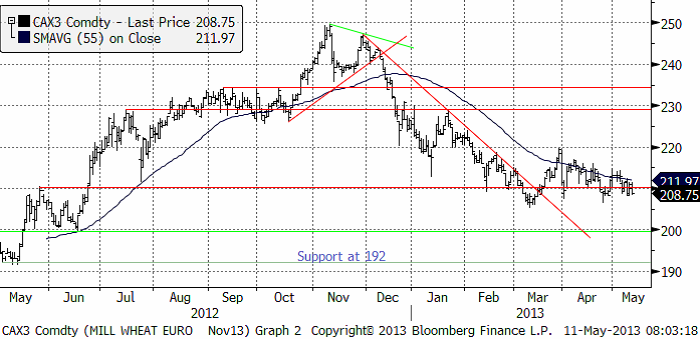
Priset på vete stängde ner på Matif på den halvtimmes handel som var möjlig efter att WASDE-rapporten publicerats i fredags. Det tekniska stödet vid 210 euro lär kunna brytas när handeln drar igång på den nya veckan.
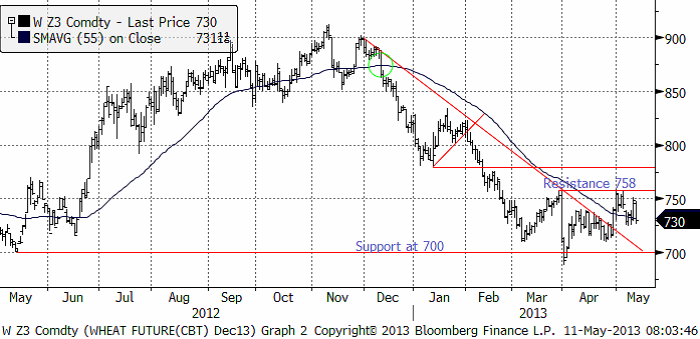
Decemberkontraktet på CBOT steg inför rapporten upp mot motståndet på 758 cent, men föll sedan tillbaka på fredagen efter USDA:s rapport.
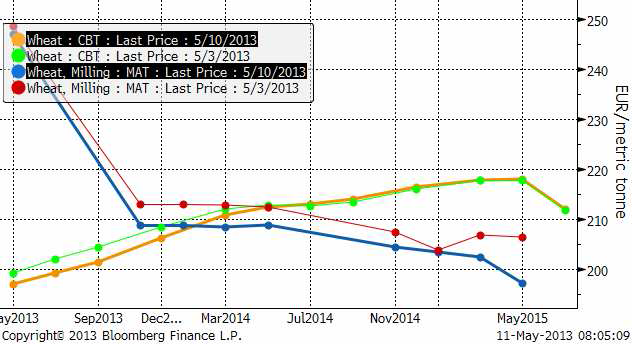
Ser vi på den senaste veckan förändring av terminskurvorna, ser vi att terminspriserna framåt i tiden gått ner ungefär lika mycket oavsett löptid i Europa. I USA, däremot har bara de kortaste terminskurvorna sjunkit. Från och med mars-leverans nästa år ligger priset högre i USA än i Europa. Som vanligt får man alltså bättre betalt om man säljer nästa års skörd via Chicago-terminerna än om man säljer Matif-terminerna.
Nedan ser vi USDA:s estimat för global produktion enligt den senaste rapporten som publicerades i fredags klockan 18 CET.
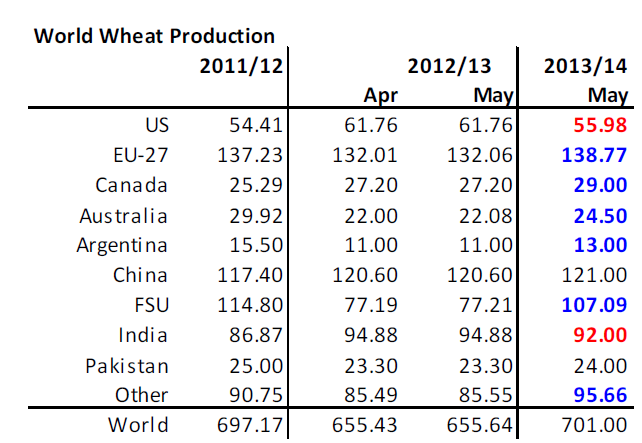
USDA gjorde inga förändringar för 2012/13, men det var första gången de gav ett estimat för 2013/14. Den visar 45 mt högre produktion än förra året och något högre än för två år sedan. Det är lite lägre skörd väntad i USA än förra året, ganska mycket högre i EU (över lokala estimat här). Fd Sovjuetunionen väntas stå för den stora ökningen, med +30 mt. Indien väntas ge lägre skörd än förra året, men mer än för två år sedan.
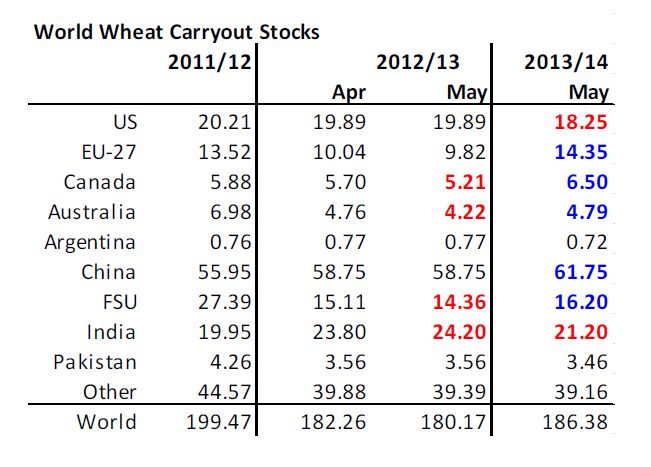
Med den här ökningen av produktionen är det inte konstigt att utgående lager ökar. Men med 45 mt högre produktion, är ökningen av lagren med 6 mt ganska låg. USDA räknar med att foderefterfrågan ökar med 7 mt. För att få en så mycket högre konsumtion av vete i världen totalt sett som USDA räknar med måste priset vara riktigt lågt. Jag tror att de har estimerat utgående lager för lågt, eller varit för optimistiska om den stora ökningen av skörden i fd Sovjetunionen och kanske i USA. Men hur som helst är detta en rapport som indikerar väsentligt lägre pris på vete framöver.
Nedan ser vi priset på decemberkontraktet på CBOT i cent, i förhållande till estimat för utgående lager.
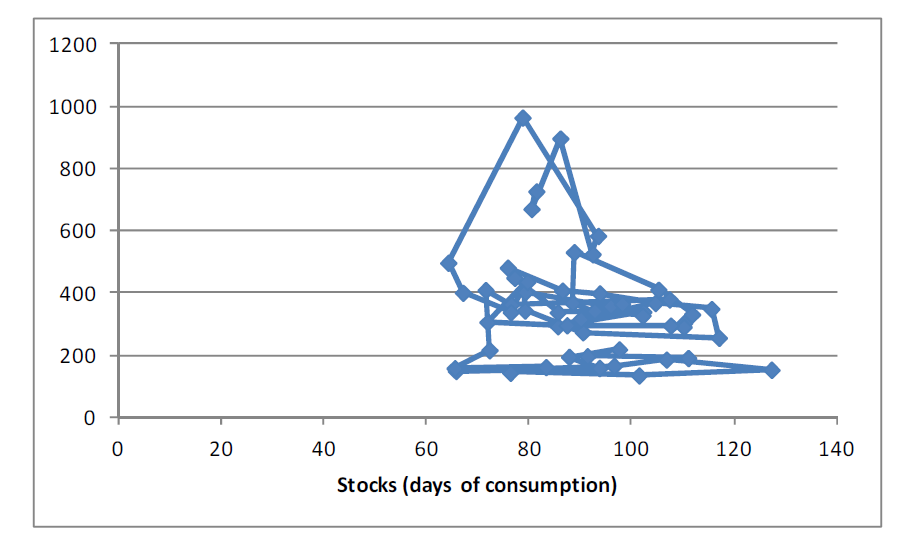
Slutsatsen är att vi behåller vår säljrekommendation på vete.
Maltkorn
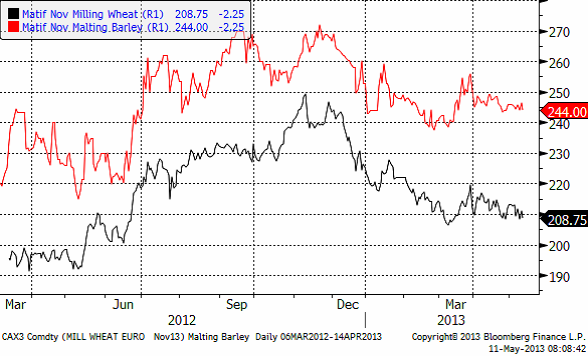
Priset på maltkorn med leverans i november har ännu en vecka fortsatt att visa mer styrka än höstvetet / kvarnvetet på Matif.
Majs
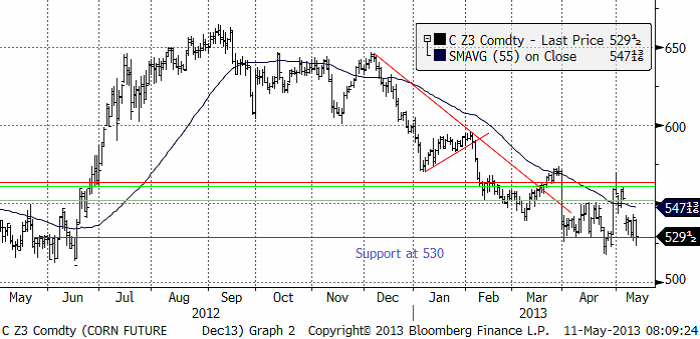
Majspriset (december 2013) som testade en trendvändning uppåt för en vecka sedan föll tillbaka när det i måndags kväll stod klart att sådden trots allt tagit ett större kliv framåt än befarat. När WASDE-rapporten så kom i fredags föll priset ytterligare. Det finns ett starkt tekniskt stöd vid 530 cent och vid den här nivån har vi också bottennoteringarna från förra året, innan torkan och prisuppgången i juli. Det är psykologiskt viktig nivå. Men icke desto mindre – om WASDE-rapporten blir verklighet borde priset ligga på en ännu lägre nivå. Kanske till och med på 400 cent per bushel.
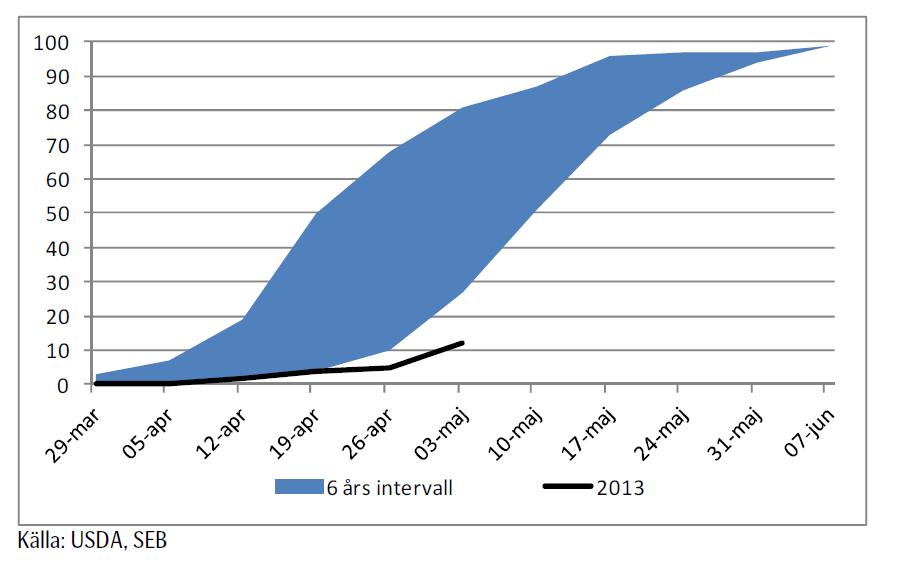
Sådden ligger kraftigt efter i USA. Nedan ser vi såddens framåtskridande i USA. 6-årsintervallet sträcker sig från 2007 till 2012. Förra helgen var 12% sått.
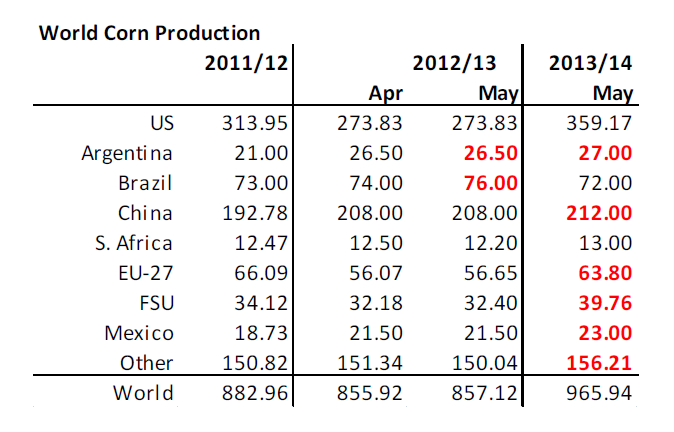
Nedan ser vi USDA:s estimat, som publicerades i fredags för majsproduktionen. För 2012/13 noterar vi de inte justerade ner Argentinas skörd, men höjde Brasiliens skörd med 2 mt. Det är också första gången som USDA rapporterar något för 2013/14. Som vi ser är det en rejäl höjning av global produktion, från 857 mt 2012/13 till 965 mt med start i höst. Vi ser att USDA väntar sig en rekordskörd i USA, 80 mt högre än förra året och större skördar både i EU och i fd Sovjetunionen.
Nedan ser vi USDA:s estimat för utgående lager.
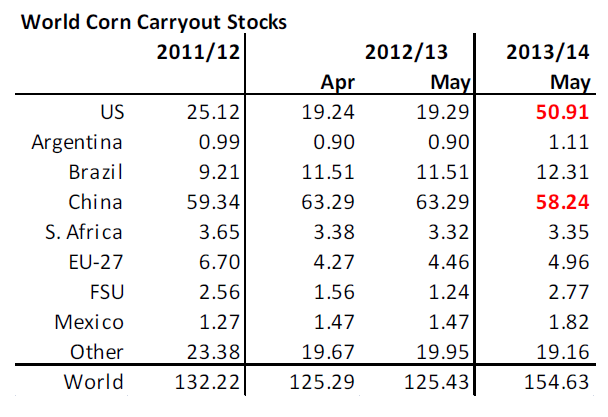
Som vi ser är det väsentligt högre lager den sista augusti nästa år i USA, som USDA förväntar sig. Trots detta väntar sig USDA att foderefterfrågan på global basis stiger med 44 mt. Lägg därtill 7 mt ökad foderkonsumtion av vete. Det är knappast rimligt att vänta sig detta, om inte priset är väsentligt mycket lägre och gör att köttefterfrågan ökar radikalt. De hot som finns är att vädret i USA drar ner skörden i USA från vad USDA väntar sig nu. Det skulle få priset att bli högre. Å andra sidan är det inte sannolikt att foderefterfrågan blir så stor som USDA nu räknar med och då ökar utgående lager, med lägre pris som följd. Utgående lager förutspås bli så stora att det är svårt att se att priset ska kunna gå upp nu. Nedanför ser vi priset i cent per bushel på decemberkontraktet på CBOT i förhållande till utgående lager.
Som vi ser kan priset mycket väl gå ner till 400 cent utan att vara ur led med tidigare års förhållande mellan lager och pris. Slutsatsen är att vi behåller vår säljrekommendation på majs.
Sojabönor
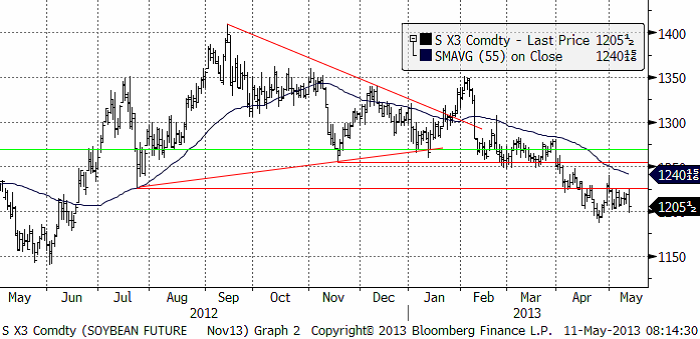
Jag har vecka efter vecka hävdat att sojabönorna (november 2013) befinner sig i en stabil negativ trend. Efter WASDE-rapporten i fredags bröts ett litet tekniskt stöd, vilket kortsiktigt kan leda till att marknaden tar ett trappsteg ner i prisnivå igen i veckan som kommer. WASDE-rapporten i fredags indikerar, om den slår in, ett pris som är ca 200 cent / bushel lägre än idag.
Nedanför ser vi USDA:s estimat för sojaproduktionen i världen.
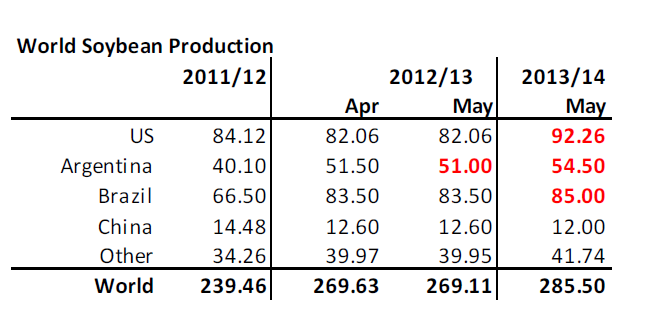
USDA sänkte Argentinas skörd 2012/13 med 0.5 mt. För första gången gav USDA också estimat för 2013/14. Vi ser att USDA väntar sig högre produktion i alla regioner / länder utom i Kina. Global produktion tar ett kliv upp med drygt 15 mt till 285.5 mt.
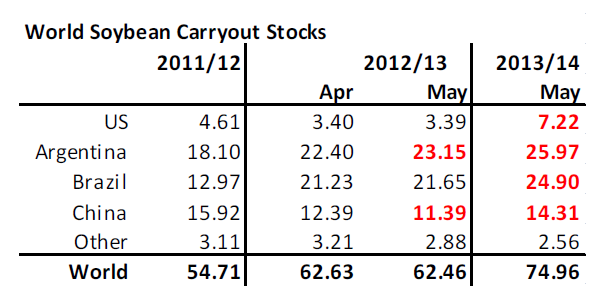
Den här ökningen av produktionen leder till en ökning av utgående lager 2013/14 med nästan 13 mt. USDA väntar sig också att Kinas import ökar till 69 mt. Jag tror det är en lite för stor ökning, med tanke på de animali-mat-problem som landet har. Man misstror inhemskt kött, inhemsk mjölk och kyckling konsumeras i vissa områden inte alls pga den pågående fågelinfluensan.
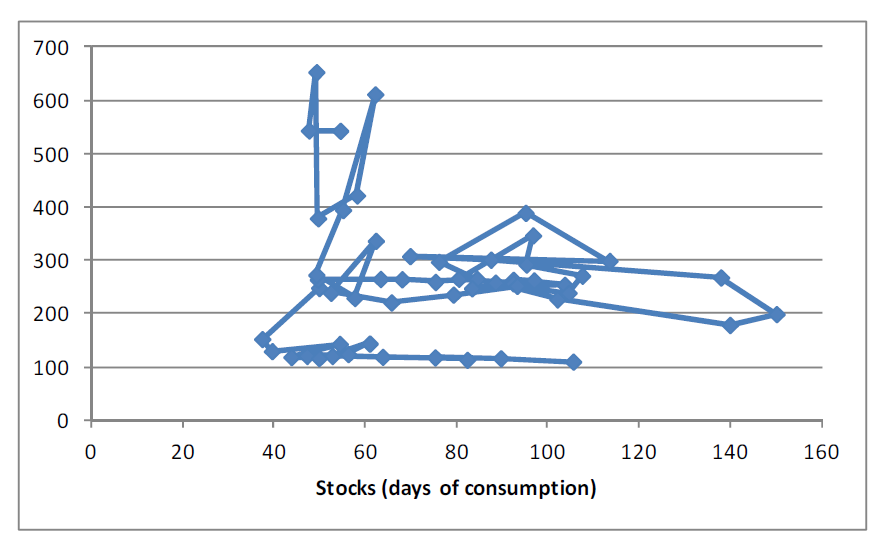
Än så länge kan mycket hända med produktionen, eftersom så stor del odlas i Brasilien, där det sås först i höst. Till dess kan vädret ha slagit om till negativt (eller ännu mer positivt). Men allt annat lika just nu, ser det ut som om den ”bear market” som har börjat, kommer att fortsätta. Nedanför ser vi priset i cent per bushel på decemberkontraktet på CBOT i förhållande till utgående lager.
Som vi ser är lite drygt 1000 cent per bushel ett rimligt pris vid den här lagernivån. Slutsatsen är att vi behåller och upprepar vår säljrekommendation på sojabönor.
Raps
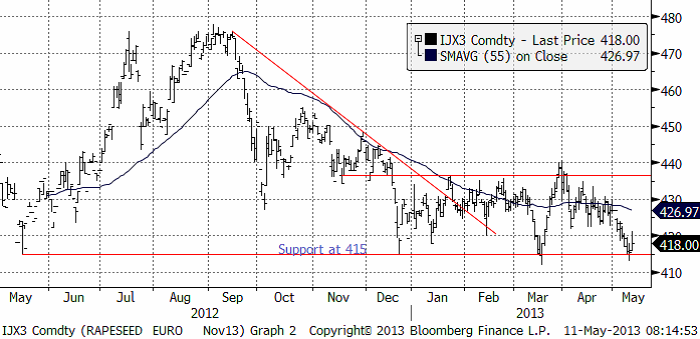
Rapspriset föll på Matif i veckan, men studsade på det tekniska stödet på 415 euro per ton. Med tanke på WASDE-rapportens ordentligt negativa siffror, tror jag ett nytt test av stödet kommer i veckan.
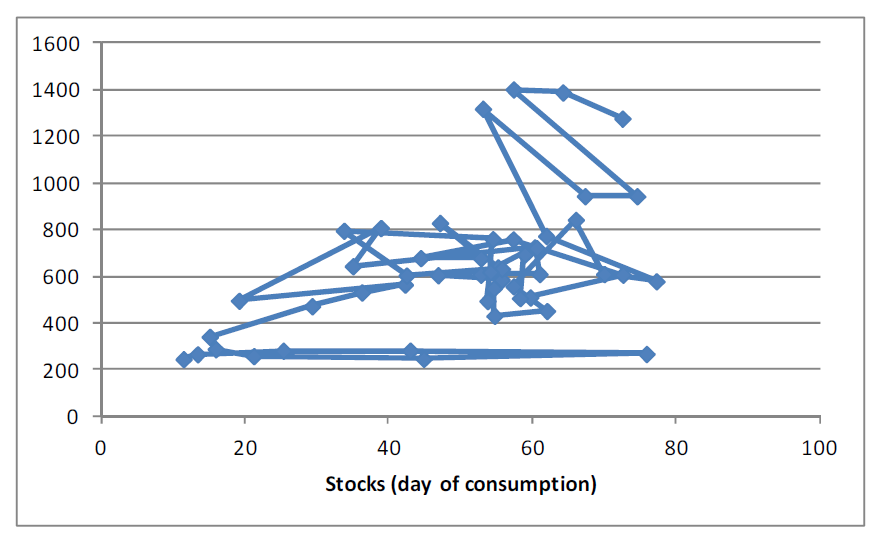
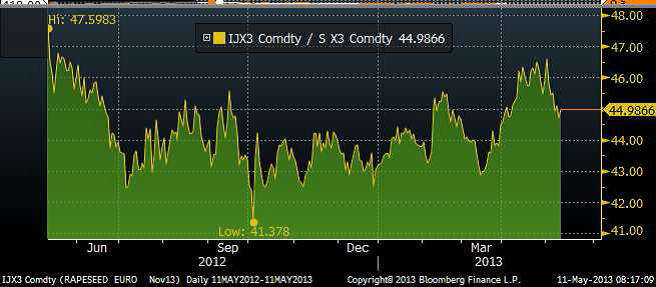
Nedanför ser vi kvoten mellan rapsterminspriset (nov) mot sojabönspriset (nov). Vi ser att raps fram till maj månads början handlades allt dyrare i förhållande till sojabönor, men att detta, som vi påpekat börjat normaliseras genom ett större prisfall på raps än på sojabönor. Ännu finns det extra fallhöjd i rapspriset, eftersom rapsen fortfarande är dyr i ett historiskt perspektiv, i förhållande till sojabönor.
Skulle det tekniska stödet på 415 euro brytas, är detta en rejäl säljsignal. Jag tror att rapspriset kommer att falla. Dels för att sojabönorna bör ha en lång tid av fallande priser framför sig och dels för att rapsen är ovanligt dyr i förhållande till sojabönor.
Mjölk
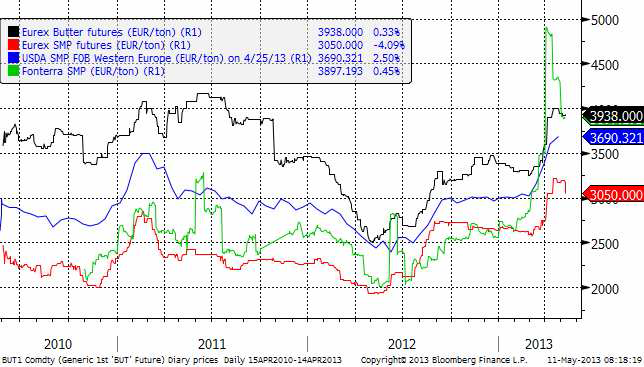
Fonterras notering har nu vänt ner ganska kraftigt och terminsmarknaden på SMP och mör på Eurex har också handlats lägre. Jag tror att vi sett slutet på prisuppgången. Priserna på Eurex ligger ännu kvar på en hög nivå. Den som är snabb kan hinna med att säkra produktion på attraktiva nivåer innan priserna hinner falla tillbaka igen.
[box]SEB Veckobrev Jordbruksprodukter är producerat av SEB Merchant Banking och publiceras i samarbete och med tillstånd på Råvarumarknaden.se[/box]
Disclaimer
The information in this document has been compiled by SEB Merchant Banking, a division within Skandinaviska Enskilda Banken AB (publ) (“SEB”).
Opinions contained in this report represent the bank’s present opinion only and are subject to change without notice. All information contained in this report has been compiled in good faith from sources believed to be reliable. However, no representation or warranty, expressed or implied, is made with respect to the completeness or accuracy of its contents and the information is not to be relied upon as authoritative. Anyone considering taking actions based upon the content of this document is urged to base his or her investment decisions upon such investigations as he or she deems necessary. This document is being provided as information only, and no specific actions are being solicited as a result of it; to the extent permitted by law, no liability whatsoever is accepted for any direct or consequential loss arising from use of this document or its contents.
About SEB
SEB is a public company incorporated in Stockholm, Sweden, with limited liability. It is a participant at major Nordic and other European Regulated Markets and Multilateral Trading Facilities (as well as some non-European equivalent markets) for trading in financial instruments, such as markets operated by NASDAQ OMX, NYSE Euronext, London Stock Exchange, Deutsche Börse, Swiss Exchanges, Turquoise and Chi-X. SEB is authorized and regulated by Finansinspektionen in Sweden; it is authorized and subject to limited regulation by the Financial Services Authority for the conduct of designated investment business in the UK, and is subject to the provisions of relevant regulators in all other jurisdictions where SEB conducts operations. SEB Merchant Banking. All rights reserved.


The latest weekly report from the US DOE showed a substantial drawdown across key petroleum categories, adding more upside potential to the fundamental picture.

Commercial crude inventories (excl. SPR) fell by 5.8 million barrels, bringing total inventories down to 415.1 million barrels. Now sitting 11% below the five-year seasonal norm and placed in the lowest 2015-2022 range (see picture below).
Product inventories also tightened further last week. Gasoline inventories declined by 2.1 million barrels, with reductions seen in both finished gasoline and blending components. Current gasoline levels are about 3% below the five-year average for this time of year.
Among products, the most notable move came in diesel, where inventories dropped by almost 4.1 million barrels, deepening the deficit to around 20% below seasonal norms – continuing to underscore the persistent supply tightness in diesel markets.
The only area of inventory growth was in propane/propylene, which posted a significant 5.1-million-barrel build and now stands 9% above the five-year average.
Total commercial petroleum inventories (crude plus refined products) declined by 4.2 million barrels on the week, reinforcing the overall tightening of US crude and products.


A classic case of “buy the rumor, sell the news” played out in oil markets, as Brent crude has dropped sharply – down nearly USD 10 per barrel since yesterday evening – following Iran’s retaliatory strike on a U.S. air base in Qatar. The immediate reaction was: “That was it?” The strike followed a carefully calibrated, non-escalatory playbook, avoiding direct threats to energy infrastructure or disruption of shipping through the Strait of Hormuz – thus calming worst-case fears.
After Monday morning’s sharp spike to USD 81.4 per barrel, triggered by the U.S. bombing of Iranian nuclear facilities, oil prices drifted sideways in anticipation of a potential Iranian response. That response came with advance warning and caused limited physical damage. Early this morning, both the U.S. President and Iranian state media announced a ceasefire, effectively placing a lid on the immediate conflict risk – at least for now.
As a result, Brent crude has now fallen by a total of USD 12 from Monday’s peak, currently trading around USD 69 per barrel.
Looking beyond geopolitics, the market will now shift its focus to the upcoming OPEC+ meeting in early July. Saudi Arabia’s decision to increase output earlier this year – despite falling prices – has drawn renewed attention considering recent developments. Some suggest this was a response to U.S. pressure to offset potential Iranian supply losses.
However, consensus is that the move was driven more by internal OPEC+ dynamics. After years of curbing production to support prices, Riyadh had grown frustrated with quota-busting by several members (notably Kazakhstan). With Saudi Arabia cutting up to 2 million barrels per day – roughly 2% of global supply – returns were diminishing, and the risk of losing market share was rising. The production increase is widely seen as an effort to reassert leadership and restore discipline within the group.
That said, the FT recently stated that, the Saudis remain wary of past missteps. In 2018, Riyadh ramped up output at Trump’s request ahead of Iran sanctions, only to see prices collapse when the U.S. granted broad waivers – triggering oversupply. Officials have reportedly made it clear they don’t intend to repeat that mistake.
The recent visit by President Trump to Saudi Arabia, which included agreements on AI, defense, and nuclear cooperation, suggests a broader strategic alignment. This has fueled speculation about a quiet “pump-for-politics” deal behind recent production moves.
Looking ahead, oil prices have now retraced the entire rally sparked by the June 13 Israel–Iran escalation. This retreat provides more political and policy space for both the U.S. and Saudi Arabia. Specifically, it makes it easier for Riyadh to scale back its three recent production hikes of 411,000 barrels each, potentially returning to more moderate increases of 137,000 barrels for August and September.
In short: with no major loss of Iranian supply to the market, OPEC+ – led by Saudi Arabia – no longer needs to compensate for a disruption that hasn’t materialized, especially not to please the U.S. at the cost of its own market strategy. As the Saudis themselves have signaled, they are unlikely to repeat previous mistakes.
Conclusion: With Brent now in the high USD 60s, buying oil looks fundamentally justified. The geopolitical premium has deflated, but tensions between Israel and Iran remain unresolved – and the risk of missteps and renewed escalation still lingers. In fact, even this morning, reports have emerged of renewed missile fire despite the declared “truce.” The path forward may be calmer – but it is far from stable.
Analys
A muted price reaction. Market looks relaxed, but it is still on edge waiting for what Iran will do
Brent crossed the 80-line this morning but quickly fell back assigning limited probability for Iran choosing to close the Strait of Hormuz. Brent traded in a range of USD 70.56 – 79.04/b last week as the market fluctuated between ”Iran wants a deal” and ”US is about to attack Iran”. At the end of the week though, Donald Trump managed to convince markets (and probably also Iran) that he would make a decision within two weeks. I.e. no imminent attack. Previously when when he has talked about ”making a decision within two weeks” he has often ended up doing nothing in the end. The oil market relaxed as a result and the week ended at USD 77.01/b which is just USD 6/b above the year to date average of USD 71/b.

Brent jumped to USD 81.4/b this morning, the highest since mid-January, but then quickly fell back to a current price of USD 78.2/b which is only up 1.5% versus the close on Friday. As such the market is pricing a fairly low probability that Iran will actually close the Strait of Hormuz. Probably because it will hurt Iranian oil exports as well as the global oil market.
It was however all smoke and mirrors. Deception. The US attacked Iran on Saturday. The attack involved 125 warplanes, submarines and surface warships and 14 bunker buster bombs were dropped on Iranian nuclear sites including Fordow, Natanz and Isfahan. In response the Iranian Parliament voted in support of closing the Strait of Hormuz where some 17 mb of crude and products is transported to the global market every day plus significant volumes of LNG. This is however merely an advise to the Supreme leader Ayatollah Ali Khamenei and the Supreme National Security Council which sits with the final and actual decision.
No supply of oil is lost yet. It is about the risk of Iran closing the Strait of Hormuz or not. So far not a single drop of oil supply has been lost to the global market. The price at the moment is all about the assessed risk of loss of supply. Will Iran choose to choke of the Strait of Hormuz or not? That is the big question. It would be painful for US consumers, for Donald Trump’s voter base, for the global economy but also for Iran and its population which relies on oil exports and income from selling oil out of that Strait as well. As such it is not a no-brainer choice for Iran to close the Strait for oil exports. And looking at the il price this morning it is clear that the oil market doesn’t assign a very high probability of it happening. It is however probably well within the capability of Iran to close the Strait off with rockets, mines, air-drones and possibly sea-drones. Just look at how Ukraine has been able to control and damage the Russian Black Sea fleet.
What to do about the highly enriched uranium which has gone missing? While the US and Israel can celebrate their destruction of Iranian nuclear facilities they are also scratching their heads over what to do with the lost Iranian nuclear material. Iran had 408 kg of highly enriched uranium (IAEA). Almost weapons grade. Enough for some 10 nuclear warheads. It seems to have been transported out of Fordow before the attack this weekend.
The market is still on edge. USD 80-something/b seems sensible while we wait. The oil market reaction to this weekend’s events is very muted so far. The market is still on edge awaiting what Iran will do. Because Iran will do something. But what and when? An oil price of 80-something seems like a sensible level until something do happen.


Hur säkrar vi Sveriges tillgång till kritiska metaller och mineral i en ny geopolitisk verklighet?

Lundin Mining ska bli en av de tio största kopparproducenterna i världen

Sommarvädret styr elpriset i Sverige

Samtal om flera delar av råvarumarknaden
Tightening fundamentals – bullish inventories from DOE

Stor uppsida i Lappland Guldprospekterings aktie enligt analys
Silverpriset släpar efter guldets utveckling, har mer uppsida

Uppgången i oljepriset planade ut under helgen

Låga elpriser i sommar – men mellersta Sverige får en ökning

Mahvie Minerals växlar spår – satsar fullt ut på guld
-
 Nyheter4 veckor sedan
Stor uppsida i Lappland Guldprospekterings aktie enligt analys
-
 Nyheter4 veckor sedan
Silverpriset släpar efter guldets utveckling, har mer uppsida
-
 Nyheter3 veckor sedan
Uppgången i oljepriset planade ut under helgen
-
 Nyheter3 veckor sedan
Låga elpriser i sommar – men mellersta Sverige får en ökning
-
 Nyheter2 veckor sedan
Mahvie Minerals växlar spår – satsar fullt ut på guld
-
Analys3 veckor sedan
Very relaxed at USD 75/b. Risk barometer will likely fluctuate to higher levels with Brent into the 80ies or higher coming 2-3 weeks
-

 Nyheter1 vecka sedan
Oljan, guldet och marknadens oroande tystnad
-

 Nyheter1 vecka sedan
Jonas Lindvall är tillbaka med ett nytt oljebolag, Perthro, som ska börsnoteras