

Analys
SEB Jordbruksprodukter, 11 februari 2013

 WASDE-rapporten innehöll endast små förändringar och de förändringar som USDA gjorde var i linje med vad vi och marknaden väntat oss att de skulle göra. För vete- och majsmarknaden hände ingenting. Däremot föll priset på sojabönor ganska mycket, mer än vad som motiverades av siffrorna från USDA.
Däremot visade siffrorna att det inte var så illa som några befarat. I förhållande till de senaste årens relation mellan pris och väntat utgående lager ligger priserna på vete, majs och sojabönor i linje med vad som varit ”rätt” pris.
 Vad gäller gammal skörd av vete förbereder sig såväl Egypten som Ryssland att försöka komma över så stor del av kakan av det lilla lager som finns i världen som möjligt. Mer om det nedan.
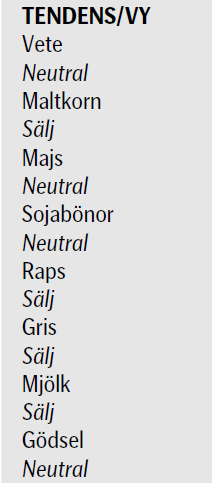
Vete
I onsdags beslöt Ryssland att ta bort importtullen om 5% på spannmål, som vi förutspådde i förra veckans veckobrev. Pådrivande kan ha varit att GASC i helgen för en vecka sedan köpte ytterligare vete, efter att just ha genomfört sin normala tender för månaden tidigare i veckan. Förra veckan skrev vi att Ryssland torde ha slut på vete mot slutet av april. Samtidigt behöver Egypten, och säkert flera andra, också köpa vete senare i vår – till rimliga priser. Det har därför varit en balansgång mellan att gå ut och köpa aggressivt till dagens höga priser å ena sidan – och att avvakta och kanske kunna få tag på vete billigare längre fram under våren. Terminskurvan indikerar lägre priser i vår – åtminstone på europeiskt vete. Eftersom lagerstatistiken och matbehovet ser ut som det gör, gissar vi på att pulsen hos marknadsaktörerna kommer att stiga ännu mer under våren.
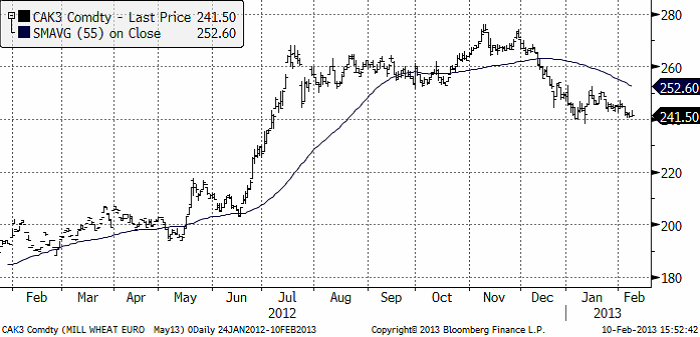
För den som sitter på vete av gammal skörd att sälja finns all anledning att följa med. Terminspriserna visar att priset kommer att falla ordentligt när den nya skörden kommer in och avhjälper bristen. Frågan är om det går att få mer betalt för gammal skörd än dagens pris. Vi tror möjligen det. Nedan ser vi kursdiagrammet på Matif för leverans i maj:
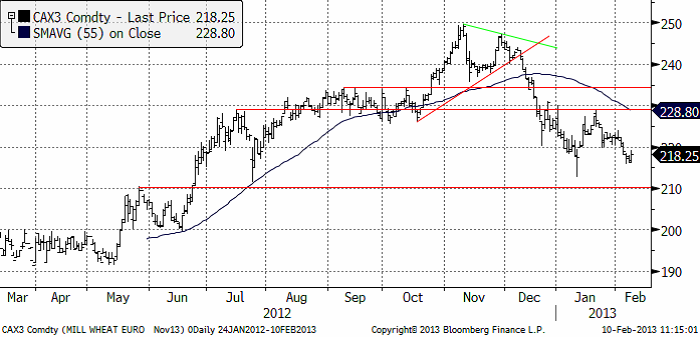
Priset på november (2013) kontraktet har den senaste tiden fallit betydligt mer än maj-kontraktet, som vi ser i diagrammet nedan. WASDE-rapporten som kom i fredags kväll, var något av en ickehändelse. WASDE-rapporten har mer bäring på novemberkontraktet än på maj-kontraktet. De något mer bullish / oroväckande nyheterna från Ryssland och Egypten påverkar inte novemberkontraktet lika mycket som majkontraktet.
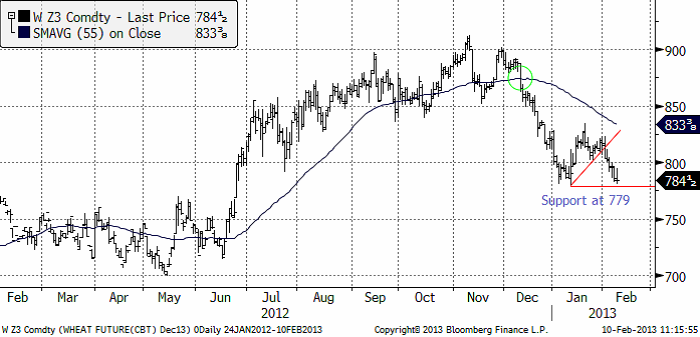
Nedan ser vi decemberkontraktet på CBOT. 800 cent bröts. 779 fungerar som ett tekniskt stöd och där ligger priset nu. Bryts det är 750 cent nästa anhalt på nedsidan.
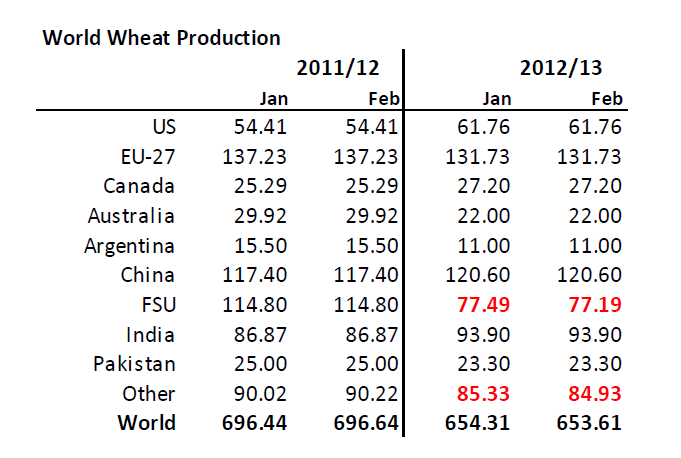
Så nu till WASDE-rapporten. USDA:s estimat (gissningar) om produktionen för 11/12 och 12/13 ser vi nedan. Man gjorde en liten sänkning endast på fd Sovjets produktion. Brasiliens (Other) sänktes också.
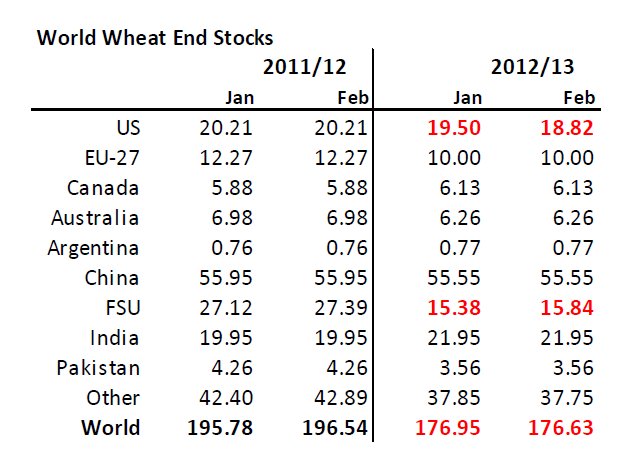
Konsumtionen sänktes något för USA. Nedan ser vi estimatet för utgående lager. Det är obetydliga förändringar och rapporten innehöll inget kursdrivande alls.
Nedan ser vi relationen mellan pris och utgående lager sedan 60-talets början. Varje punkt är ett år, per den 8 februaris pris och estimerat utgående lager varje år. Vi ser att ett lager som räcker i drygt 70 dagar och ett pris på strax under 800 cent ÄR i linje med den relation som varit rådande de senaste åren. Ju mindre lager desto högre pris. Priset ser ut att ligga rätt.
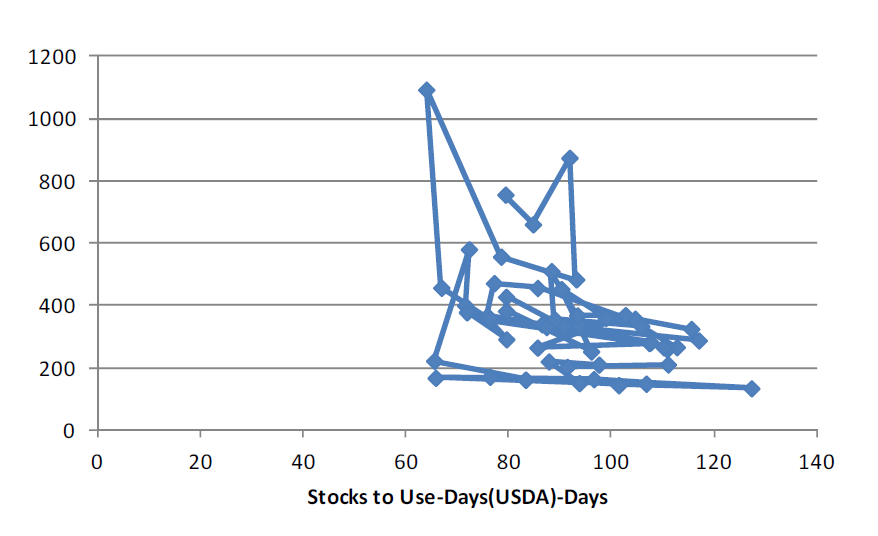
Vi fortsätter vår neutrala vy på vetet.
Maltkorn
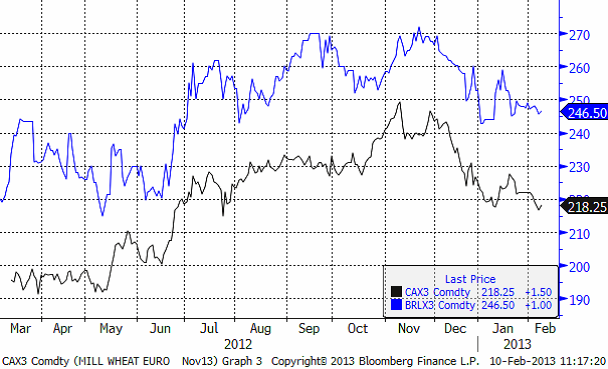
November 2013-kontraktet sjönk för tredje veckan i rad, från 247 euro per ton till 246.50.
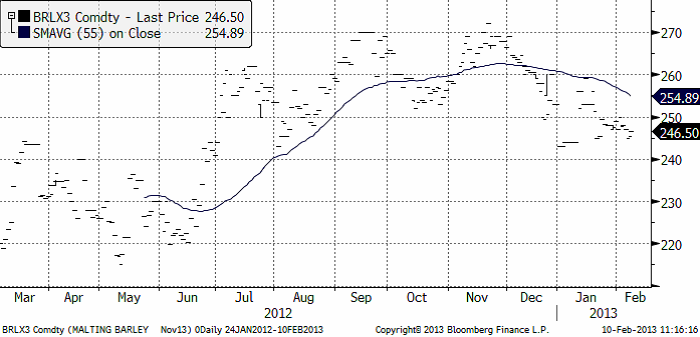
Maltkornsmarknaden är tämligen illikvid och omsättningen har inte tagit fart, som Euronext säkert hoppats när kontraktet introducerades för några år sedan. Nedan ser vi prisutvecklingen på novemberkontraktet på maltkorn och dit för kvarnvete. Vi ser att de följer vandra åt tämligen väl. Om man skulle använda Matifs kvarnvetekontrakt för att prissäkra maltkorn blir inte följsamheten fullt så dålig som man skulle kunna tro.
Majs
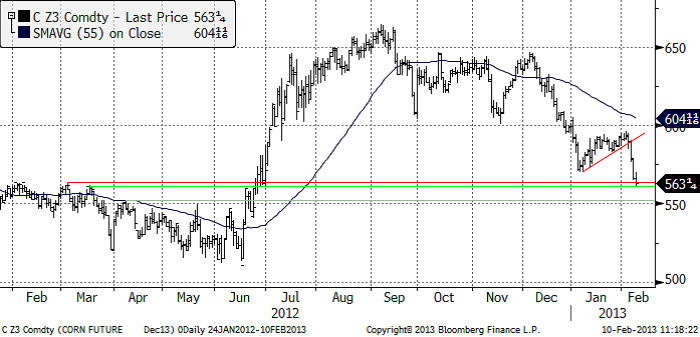
Majspriset (december 2013) föll kraftigt i veckan som gick efter att ha brutit det stöd du kunde läsa om förra veckan. Priset har nu fallit ner till ett prisområde där det finns tre ganska starka tekniska stöd. Det mest sannolika härifrån är att marknaden konsoliderar sig med sidledes rörelse, eventuellt ner mot 550 cent.
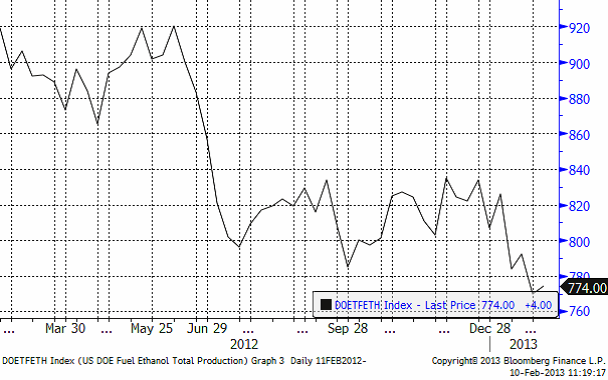
Veckovis etanolproduktion i USA ökade till 704,000 fat per dag från förra veckans rekordlåga 700,000 fat.
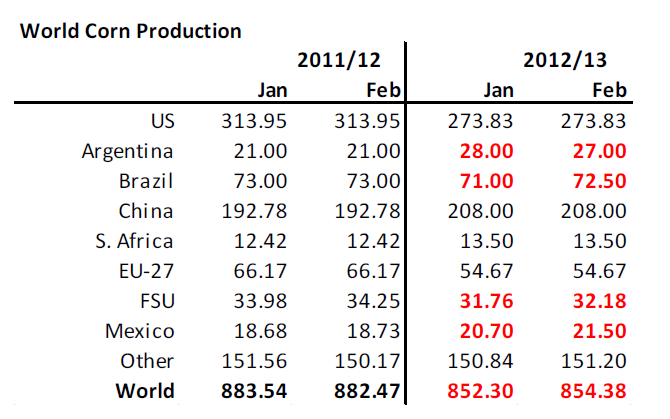
Så till fredagens WASDE-rapport. Argentina justerades ner och Brasilien upp. Det var väntat efter det väder som varit. Ukraina och Mexiko justerades också upp något. Brasilianska CONAB förutspår dock en skörd om 76 mt och där ligger USDA efter med 72.5 mt. USDA ligger i och för sig också efter vad man kan tro om ännu lägre skörd i Argentina. På global basis, som vi ser nedan, en något högre väntad skörd i år.
Utgående lager höjdes tillräckligt i rapporten för att ge säljarna ytterligare vind i seglen. Men det är kommer fortfarande att bli ont om majs i sommar, innan den nya skörden kommer in.
Nedan ser vi relationen mellan lager och pris. Liksom för vetet visar diagrammet förhållandet mellan lager och pris varje år i februari.
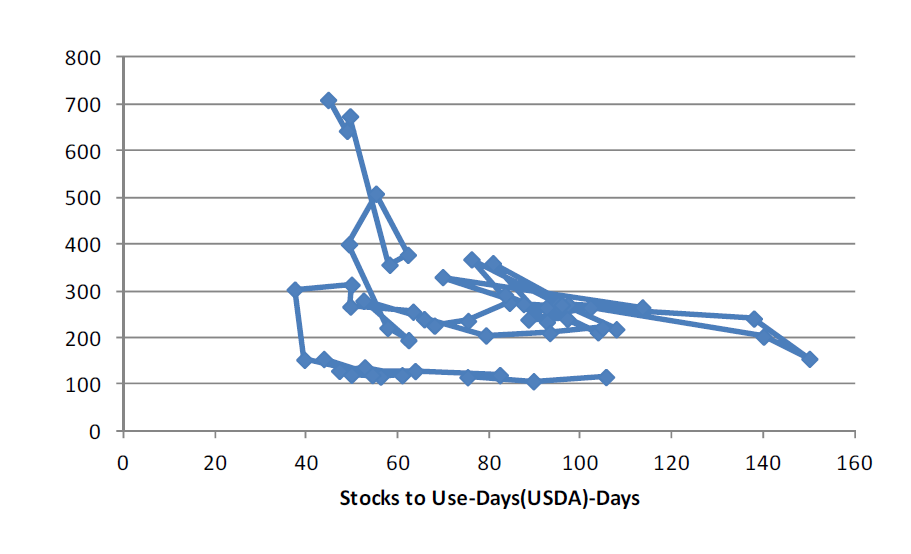
Även fast lagren är så små att det inte finns så många punkter med lägre lager att förlita sig på, förefaller inte priset nu avvika allt för mycket från de senaste årens relation mellan lager och pris. Vi fortsätter att ha en neutral vy på majs.
Sojabönor
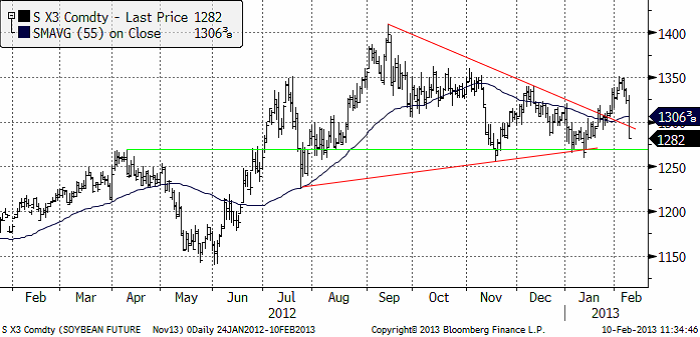
Sojabönorna (november 2013) föll kraftigt efter WASDE-rapporten i fredags. Nästan ända ner till de tekniska stöden vid 1260 cent per bushel. Nedanför ser vi kurdiagrammet för sojabönor (november 2013).
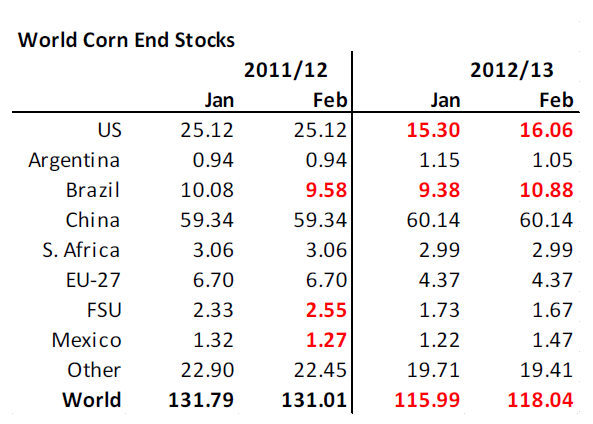
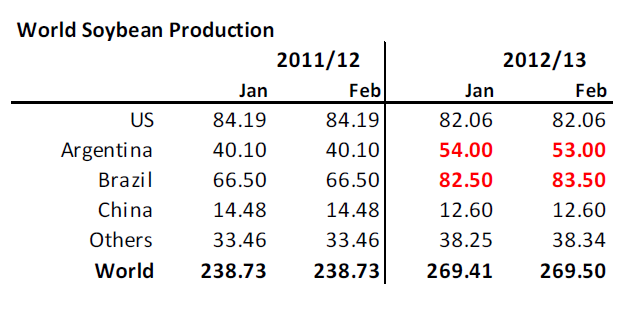
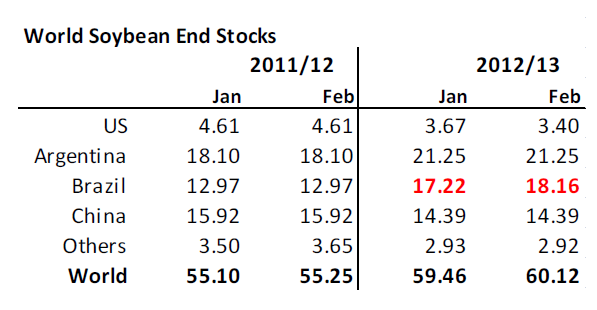
WASDE-rapportens produktionsestimat handlade helt om Sydamerika. Argentinas väntade skörd justerades ner 1 mt och Brasiliens upp lika mycket. Resten lämnades oförändrat.
Nedan ser vi USDA:s estimat på utgående lager. Det är inte någon kioskvältare på papperet. En höjning med lite drygt 0.5 mt. Lagren i USA sänktes till 3.40 från 3.67 mt. Utgående lager i Brasilien höjdes.
Nedan ser vi relationen mellan pris och lager. I förhållande till de senaste årens relation, ser låg priset innan rapporten något högt. Efter fredagens prisfall ligger priset mer eller mindre mitt i linje med den historiska relationen.
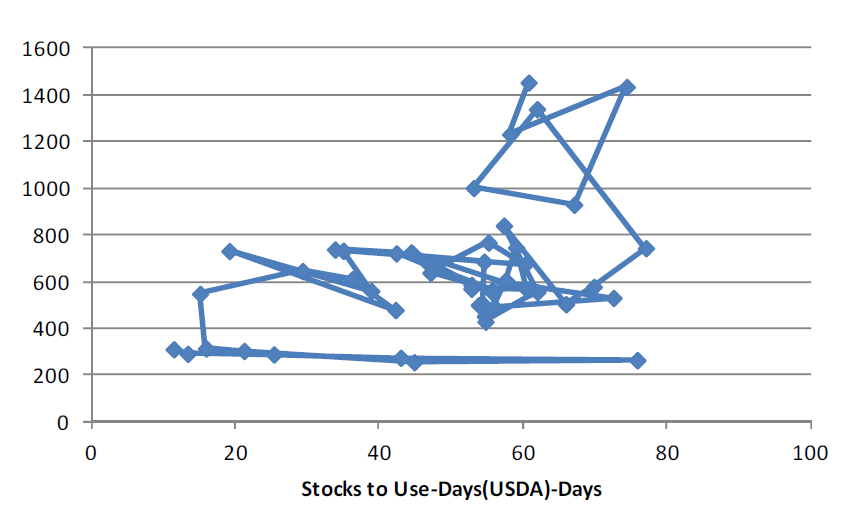
Vi fortsätter därför att ha en neutral rekommendation på sojabönorna.
Raps
Rapspriset (november 2013) har utvecklat sig starkare än sojabönorna. Ett försök att handla rapsen högre i veckan hindrades dock av WASDE-rapporten och det betydande prisfallet efter den i sojabönsmarknaden.
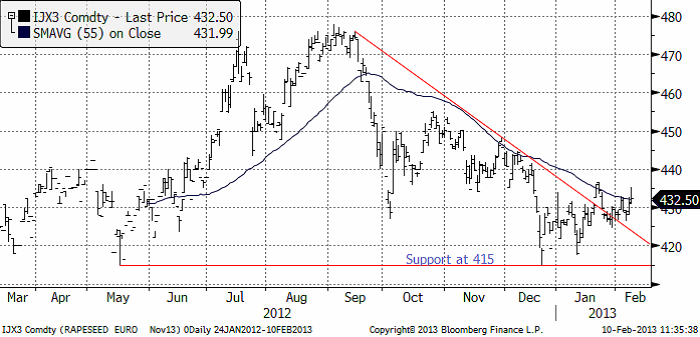
Vi ligger kvar med vår negativa vy för rapspriset.
Gris
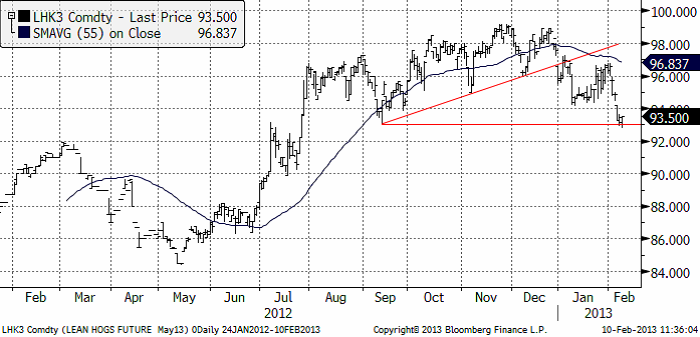
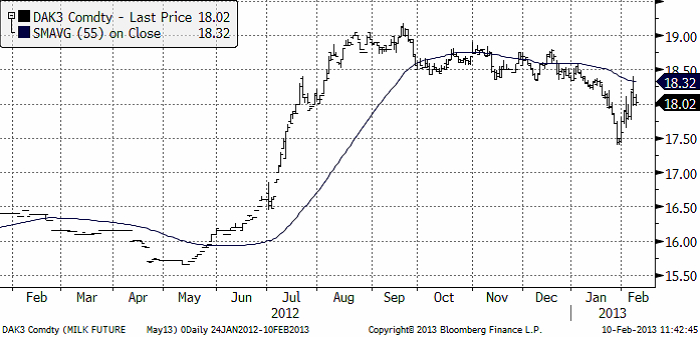
Grispriset (Maj 13) föll förra veckan ner till 93.50. Läsare av veckobrevet har tidigare kunnat läsa att rekylen uppåt efter brottet av den tekniska stödnivån skulle tolkas som ett tillfälle att sälja. Det visade sig vara rätt. Nu ligger priset på stödet och därifrån får marknaden visa vägen. Ännu ett brott nedåt innebär att prisfallet kan fortsätta.
Mjölk
Fonterras auktion i onsdags visade på en prisuppgång på SMP. På Eurex fortsatte dock kräftgången i SMP. Prisutvecklingen på smör fortsatte att falla tillbaka efter toppen i december. I diagrammet nedan ser vi nu fyra kurvor. Den övre tunna linjen är EUREX SMP. Den nedre tunna linjen är Eurex SMP. Den rosa linjen visar priset på helmjölkspulver (WMP) FOB Västeuropa. Källan är USDA och priserna uppdateras varannan vecka. Den röda linjen är Fonterras auktion.
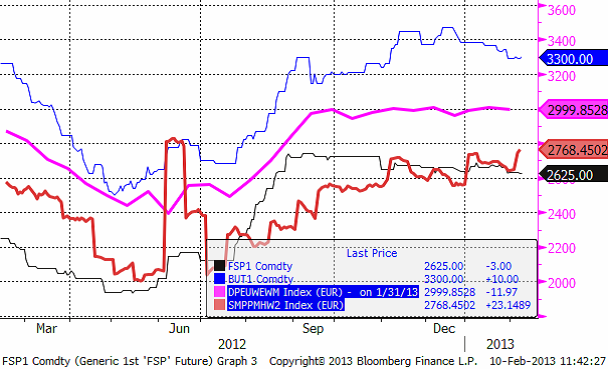
Beprövad erfarenhet säger att vi ska vänta oss ett nytt kraftigt prisfall inom kort.
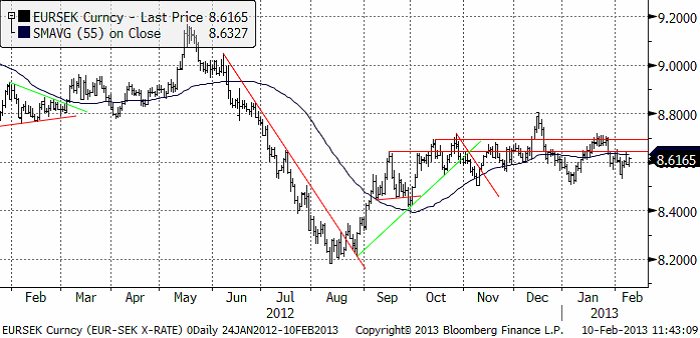
EURSEK
EURSEK fortsatte att röra sig sidledes i veckan som gick. Utsikterna för den kommande veckan är att detta kommer att fortsätta.
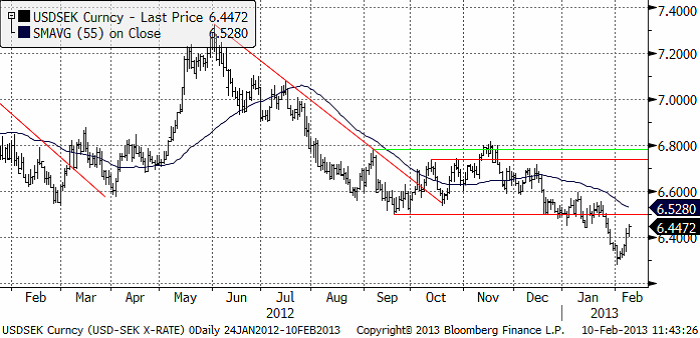
USDSEK
Dollarn rekylerade uppåt mot slutet av veckan. Detta ser ut knappast ut som ett trendbrott, utan som en rekyl i en fallande trend. Därmed är det ett säljtillfälle.
[box]SEB Veckobrev Jordbruksprodukter är producerat av SEB Merchant Banking och publiceras i samarbete och med tillstånd på Råvarumarknaden.se[/box]
Disclaimer
The information in this document has been compiled by SEB Merchant Banking, a division within Skandinaviska Enskilda Banken AB (publ) (“SEB”).
Opinions contained in this report represent the bank’s present opinion only and are subject to change without notice. All information contained in this report has been compiled in good faith from sources believed to be reliable. However, no representation or warranty, expressed or implied, is made with respect to the completeness or accuracy of its contents and the information is not to be relied upon as authoritative. Anyone considering taking actions based upon the content of this document is urged to base his or her investment decisions upon such investigations as he or she deems necessary. This document is being provided as information only, and no specific actions are being solicited as a result of it; to the extent permitted by law, no liability whatsoever is accepted for any direct or consequential loss arising from use of this document or its contents.
About SEB
SEB is a public company incorporated in Stockholm, Sweden, with limited liability. It is a participant at major Nordic and other European Regulated Markets and Multilateral Trading Facilities (as well as some non-European equivalent markets) for trading in financial instruments, such as markets operated by NASDAQ OMX, NYSE Euronext, London Stock Exchange, Deutsche Börse, Swiss Exchanges, Turquoise and Chi-X. SEB is authorized and regulated by Finansinspektionen in Sweden; it is authorized and subject to limited regulation by the Financial Services Authority for the conduct of designated investment business in the UK, and is subject to the provisions of relevant regulators in all other jurisdictions where SEB conducts operations. SEB Merchant Banking. All rights reserved.

Parts of the Brent crude curve dipping into the high $50ies/b. Brent crude fell 2.3% over the week to Friday. It closed the week at $61.29/b, a slight gain on the day, but also traded to a low of $60.14/b that same day and just barely avoided trading into the $50ies/b. This morning it is risk-on in equities which seems to help industrial metals a little higher. But no such luck for oil. It is down 0.8% at $60.8/b. This week looks set for Brent crude to dip its feet in the $50ies/b. The Brent 3mth contract actually traded into the high $50ies/b on Friday.

The front-end backwardation has been on a weakening foot and is now about to fully disappear. The lowest point of the crude oil curve has also moved steadily lower and lower and its discount to the 5yr contract is now $6.8/b. A solid contango. The Brent 3mth contract did actually dip into the $50ies/b intraday on Friday when it traded to a low point of $59.93/b.
More weakness to come as lots of oil at sea comes to ports. Mid-East OPEC countries have boosted exports along with lower post summer consumption and higher production. The result is highly visibly in oil at sea which increased by 17 mb to 1,311 mb over the week to Sunday. Up 185 mb since mid-August. On its way to discharge at a port somewhere over the coming month or two.
Don’t forget that the oil market path ahead is all down to OPEC+. Remember that what is playing out in the oil market now is all by design by OPEC+. The group has decided that the unwind of the voluntary cuts is what it wants to do. In a combination of meeting demand from consumers as well as taking back market share. But we need to remember that how this plays out going forward is all at the mercy of what OPEC+ decides to do. It will halt the unwinding at some point. It will revert to cuts instead of unwind at some point.
A few months with Brent at $55/b and 40-50 US shale oil rigs kicked out may be what is needed. We think OPEC+ needs to see the exit of another 40-50 drilling rigs in the US shale oil patches to set US shale oil production on a path to of a 1 mb/d year on year decline Dec-25 to Dec-26. We are not there yet. But a 2-3 months period with Brent crude averaging $55/b would probably do it.
Oil on water increased 17 mb over the week to Sunday while oil in transit increased by 23 mb. So less oil was standing still. More was moving.

Crude oil floating storage (stationary more than 7 days). Down 11 mb over week to Sunday

The lowest point of the Brent crude oil curve versus the 5yr contract. Weakest so far this year.

Crude oil 1mth to 3mth time-spreads. Dubai held out strongly through summer, but then that center of strength fell apart in late September and has been leading weakness in crude curves lower since then.

Rebounding along with most markets. But concerns over solidity of Gaza peace may also contribute. Brent crude fell 0.8% yesterday to $61.91/b and its lowest close since May this year. This morning it is bouncing up 0.9% to $62.5/b along with a softer USD amid positive sentiment with both equities and industrial metals moving higher. Concerns that the peace in Gaza may be less solid than what one might hope for also yields some support to Brent. Bets on tech stocks are rebounding, defying fears of trade war. Money moving back into markets. Gold continues upwards its strong trend and a softer dollar helps it higher today as well.
US crude & products probably rose 5.6 mb last week (API) versus a normal seasonal decline of 2.4 mb. The US API last night partial and thus indicative data for US oil inventories. Their data indicates that US crude stocks rose 7.4 mb last week, gasoline stocks rose 3.0 mb while Distillate stocks fell 4.8 mb. Altogether an increase in commercial crude and product stocks of 5.6 mb. Commercial US crude and product stocks normally decline by 2.4 mb this time of year. So seasonally adjusted the US inventories rose 8 mb last week according to the indicative numbers by the API. That is a lot. Also, the counter seasonal trend of rising stocks versus normally declining stocks this time of year looks on a solid pace of continuation. If the API is correct then total US crude and product stocks would stand 41 mb higher than one year ago and 6 mb higher than the 2015-19 average. And if we combine this with our knowledge of a sharp increase in production and exports by OPEC(+) and a large increase in oil at sea, then the current trend in US oil inventories looks set to continue. So higher stocks and lower crude oil prices until OPEC(+) switch to cuts. Actual US oil inventory data today at 18:00 CET.
US commercial crude and product stocks rising to 1293 mb in week 41 if last nights indicative numbers from API are correct.

Crude oil soon coming to a port near you. OPEC has lifted production sharply higher this autumn. At the same time demand for oil in the Middle-East has fallen as we have moved out of summer heat and crude oil burn for power for air-conditioning. The Middle-East oil producers have thus been able to lift exports higher on both accounts. Crude oil and condensates on water has shot up by 177 mb since mid-August. This oil is now on its way to ports around the world. And when they arrive, it will likely help to lift stocks onshore higher. That is probably when we will lose the last bit of front-end backwardation the the crude oil curves. That will help to drive the front-month Brent crude oil price down to the $60/b line and revisit the high $50ies/b. Then the eyes will be all back on OPEC+ when they meet in early November and then again in early December.
Crude oil and condensates at sea have moved straight up by 177 mb since mid-August as OPEC(+) has produced more, consumed less and exported more.

When it starts to move lower it moves rather quickly. Gaza, China, IEA. Brent crude is down 2.1% today to $62/b after having traded as high as $66.58/b last Thursday and above $70/b in late September. The sell-off follows the truce/peace in Gaze, a flareup in US-China trade and yet another bearish oil outlook from the IEA.
A lasting peace in Gaze could drive crude oil at sea to onshore stocks. A lasting peace in Gaza would probably calm down the Houthis and thus allow more normal shipments of crude oil to sail through the Suez Canal, the Red Sea and out through the Bab-el-Mandeb Strait. Crude oil at sea has risen from 48 mb in April to now 91 mb versus a pre-Covid normal of about 50-60 mb. The rise to 91 mb is probably the result of crude sailing around Africa to be shot to pieces by the Houthis. If sailings were to normalize through the Suez Canal, then it could free up some 40 mb in transit at sea moving onshore into stocks.
The US-China trade conflict is of course bearish for demand if it continues.
Bearish IEA yet again. Getting closer to 2026. Credibility rises. We expect OPEC to cut end of 2025. The bearish monthly report from the IEA is what it is, but the closer we get to 2026, the more likely the IEA is of being ball-park right in its outlook. In its monthly report today the IEA estimates that the need for crude oil from OPEC in 2026 will be 25.4 mb/d versus production by the group in September of 29.1 mb/d. The group thus needs to do some serious cutting at the end of 2025 if it wants to keep the market balanced and avoid inventories from skyrocketing. Given that IEA is correct that is. We do however expect OPEC to implement cuts to avoid a large increase in inventories in Q1-26. The group will probably revert to cuts either at its early December meeting when they discuss production for January or in early January when they discuss production for February. The oil price will likely head yet lower until the group reverts to cuts.
Dubai: The Mid-East anchor dragging crude oil lower. Surplus emerging in Mid-East pricing. Crude oil prices held surprisingly strong all through the summer. A sign and a key source of that strength came from the strength in the front-end backwardation of the Dubai crude oil curve. It held out strong from mid-June and all until late September with an average 1-3mth time-spread premium of $1.8/b from mid-June to end of September. The 1-3mth time-spreads for Brent and WTI however were in steady deterioration from late June while their flat prices probably were held up by the strength coming from the Persian Gulf. Then in late September the strength in the Dubai curve suddenly collapsed. Since the start of October it has been weaker than both the Brent and the WTI curves. The Dubai 1-3mth time-spread now only stands at $0.25/b. The Middle East is now exporting more as it is producing more and also consuming less following elevated summer crude burn for power (Aircon) etc.
The only bear-element missing is a sudden and solid rise in OECD stocks. The only thing that is missing for the bear-case everyone have been waiting for is a solid, visible rise in OECD stocks in general and US oil stocks specifically. So watch out for US API indications tomorrow and official US oil inventories on Thursday.
No sign of any kind of fire-sale of oil from Saudi Arabia yet. To what we can see, Saudi Arabia is not at all struggling to sell its oil. It only lowered its Official Selling Prices (OSPs) to Asia marginally for November. A surplus market + Saudi determination to sell its oil to the market would normally lead to a sharp lowering of Saudi OSPs to Asia. Not yet at least and not for November.
The 5yr contract close to fixed at $68/b. Of importance with respect to how far down oil can/will go. When the oil market moves into a surplus then the spot price starts to trade in a large discount to the 5yr contract. Typically $10-15/b below the 5yr contract on average in bear-years (2009, 2015, 2016, 2020). But the 5yr contract is usually pulled lower as well thus making this approach a moving target. But the 5yr contract price has now been rock solidly been pegged to $68/b since 2022. And in the 2022 bull-year (Brent spot average $99/b), the 5yr contract only went to $72/b on average. If we assume that the same goes for the downside and that 2026 is a bear-year then the 5yr goes to $64/b while the spot is trading at a $10-15/b discount to that. That would imply an average spot price next year of $49-54/b. But that is if OPEC doesn’t revert to cuts and instead keeps production flowing. We think OPEC(+) will trim/cut production as needed into 2026 to prevent a huge build-up in global oil stocks and a crash in prices. But for now we are still heading lower. Into the $50ies/b.


Gruvbolaget Boliden överträffade analytikernas förväntningar

Australien och USA investerar 8,5 miljarder USD för försörjningskedja av kritiska mineraler
Brent crude set to dip its feet into the high $50ies/b this week

Vad guldets uppgång egentligen betyder för världen

Spotpriset på guld över 4300 USD och silver över 54 USD

OPEC+ missar produktionsmål, stöder oljepriserna

Goldman Sachs höjer prognosen för guld, tror priset når 4900 USD

Blykalla och amerikanska Oklo inleder ett samarbete
Guld nära 4000 USD och silver 50 USD, därför kan de fortsätta stiga
Are Ukraine’s attacks on Russian energy infrastructure working?
-
 Nyheter4 veckor sedan
OPEC+ missar produktionsmål, stöder oljepriserna
-
 Nyheter2 veckor sedan
Goldman Sachs höjer prognosen för guld, tror priset når 4900 USD
-
 Nyheter3 veckor sedan
Blykalla och amerikanska Oklo inleder ett samarbete
-
 Nyheter3 veckor sedan
Guld nära 4000 USD och silver 50 USD, därför kan de fortsätta stiga
-
Analys4 veckor sedan
Are Ukraine’s attacks on Russian energy infrastructure working?
-

 Nyheter2 veckor sedan
Leading Edge Materials är på rätt plats i rätt tid
-

 Nyheter3 veckor sedan
Ett samtal om guld, olja, koppar och stål
-

 Nyheter2 veckor sedan
Nytt prisrekord, guld stiger över 4000 USD