

Analys
SEB Jordbruksprodukter, 11 februari 2013

 WASDE-rapporten innehöll endast små förändringar och de förändringar som USDA gjorde var i linje med vad vi och marknaden väntat oss att de skulle göra. För vete- och majsmarknaden hände ingenting. Däremot föll priset på sojabönor ganska mycket, mer än vad som motiverades av siffrorna från USDA.
Däremot visade siffrorna att det inte var så illa som några befarat. I förhållande till de senaste årens relation mellan pris och väntat utgående lager ligger priserna på vete, majs och sojabönor i linje med vad som varit ”rätt” pris.
 Vad gäller gammal skörd av vete förbereder sig såväl Egypten som Ryssland att försöka komma över så stor del av kakan av det lilla lager som finns i världen som möjligt. Mer om det nedan.
Vete
I onsdags beslöt Ryssland att ta bort importtullen om 5% på spannmål, som vi förutspådde i förra veckans veckobrev. Pådrivande kan ha varit att GASC i helgen för en vecka sedan köpte ytterligare vete, efter att just ha genomfört sin normala tender för månaden tidigare i veckan. Förra veckan skrev vi att Ryssland torde ha slut på vete mot slutet av april. Samtidigt behöver Egypten, och säkert flera andra, också köpa vete senare i vår – till rimliga priser. Det har därför varit en balansgång mellan att gå ut och köpa aggressivt till dagens höga priser å ena sidan – och att avvakta och kanske kunna få tag på vete billigare längre fram under våren. Terminskurvan indikerar lägre priser i vår – åtminstone på europeiskt vete. Eftersom lagerstatistiken och matbehovet ser ut som det gör, gissar vi på att pulsen hos marknadsaktörerna kommer att stiga ännu mer under våren.
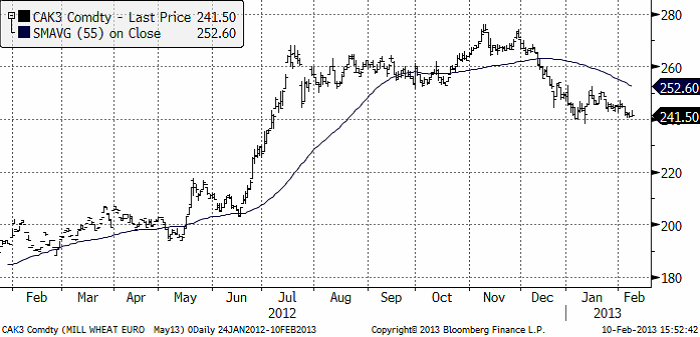
För den som sitter på vete av gammal skörd att sälja finns all anledning att följa med. Terminspriserna visar att priset kommer att falla ordentligt när den nya skörden kommer in och avhjälper bristen. Frågan är om det går att få mer betalt för gammal skörd än dagens pris. Vi tror möjligen det. Nedan ser vi kursdiagrammet på Matif för leverans i maj:
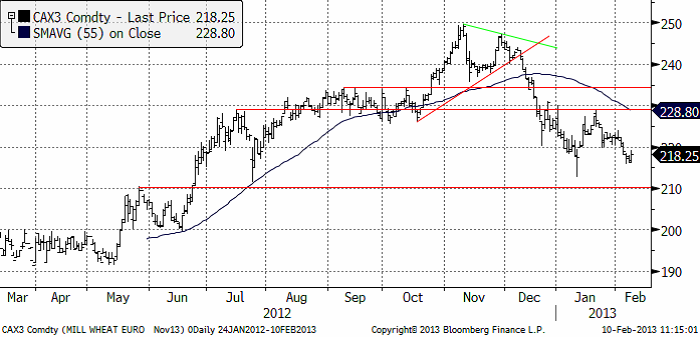
Priset på november (2013) kontraktet har den senaste tiden fallit betydligt mer än maj-kontraktet, som vi ser i diagrammet nedan. WASDE-rapporten som kom i fredags kväll, var något av en ickehändelse. WASDE-rapporten har mer bäring på novemberkontraktet än på maj-kontraktet. De något mer bullish / oroväckande nyheterna från Ryssland och Egypten påverkar inte novemberkontraktet lika mycket som majkontraktet.
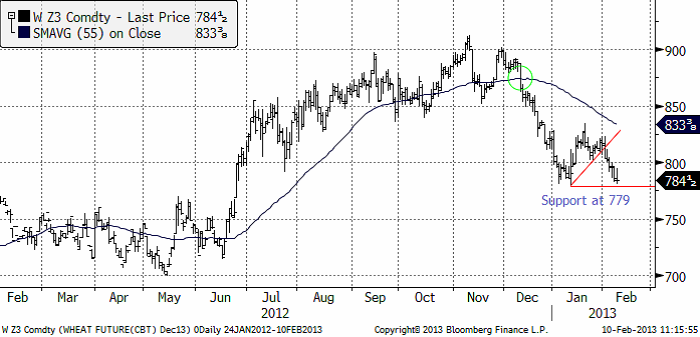
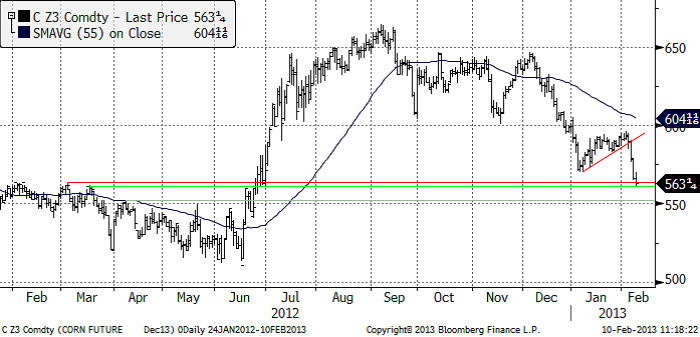
Nedan ser vi decemberkontraktet på CBOT. 800 cent bröts. 779 fungerar som ett tekniskt stöd och där ligger priset nu. Bryts det är 750 cent nästa anhalt på nedsidan.
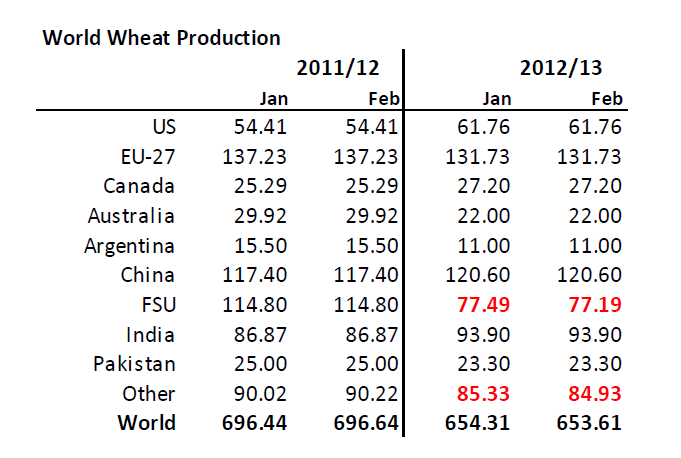
Så nu till WASDE-rapporten. USDA:s estimat (gissningar) om produktionen för 11/12 och 12/13 ser vi nedan. Man gjorde en liten sänkning endast på fd Sovjets produktion. Brasiliens (Other) sänktes också.
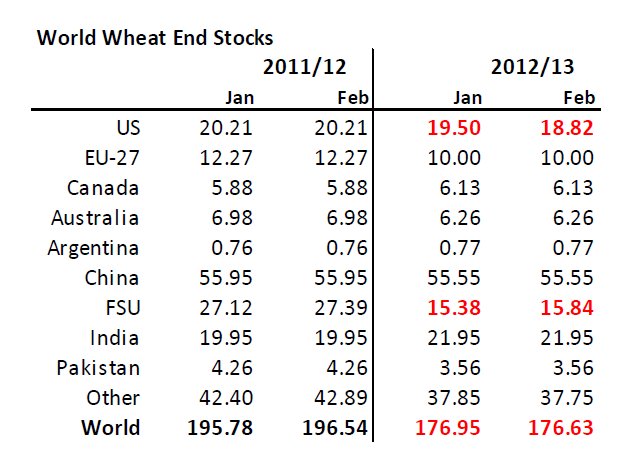
Konsumtionen sänktes något för USA. Nedan ser vi estimatet för utgående lager. Det är obetydliga förändringar och rapporten innehöll inget kursdrivande alls.
Nedan ser vi relationen mellan pris och utgående lager sedan 60-talets början. Varje punkt är ett år, per den 8 februaris pris och estimerat utgående lager varje år. Vi ser att ett lager som räcker i drygt 70 dagar och ett pris på strax under 800 cent ÄR i linje med den relation som varit rådande de senaste åren. Ju mindre lager desto högre pris. Priset ser ut att ligga rätt.
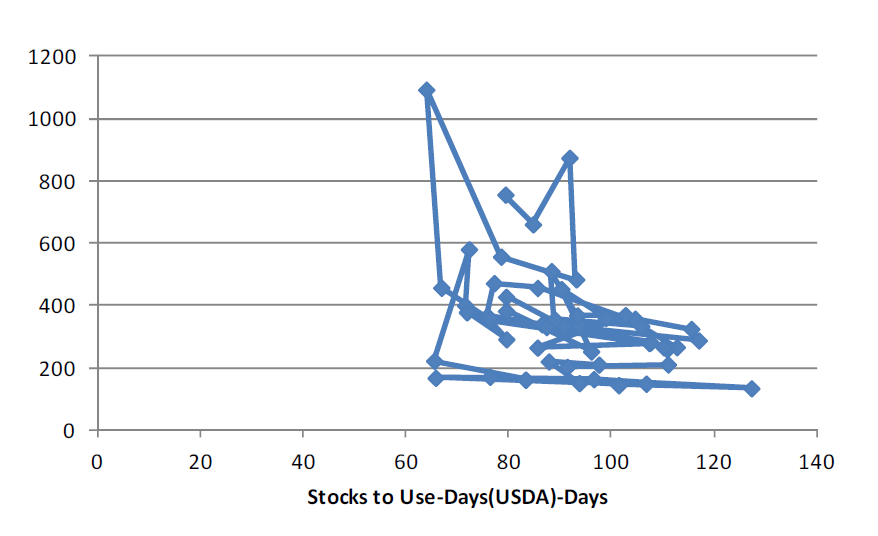
Vi fortsätter vår neutrala vy på vetet.
Maltkorn
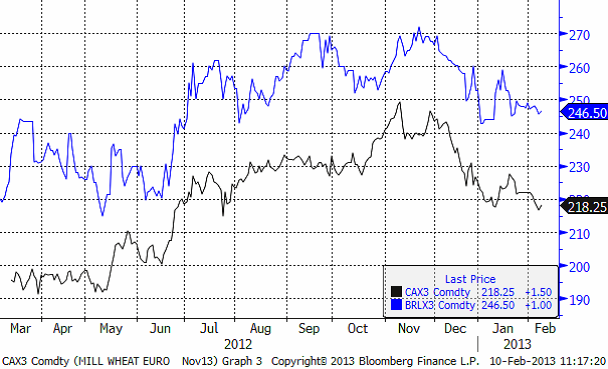
November 2013-kontraktet sjönk för tredje veckan i rad, från 247 euro per ton till 246.50.
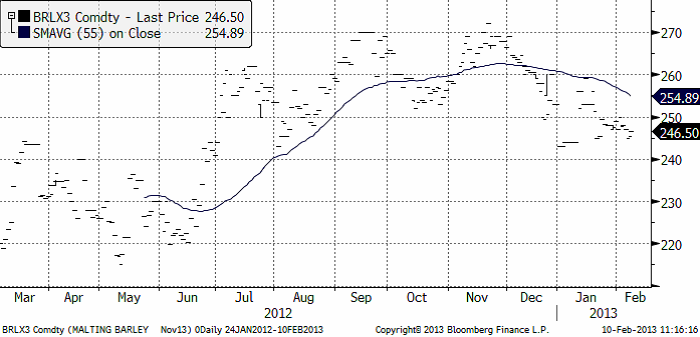
Maltkornsmarknaden är tämligen illikvid och omsättningen har inte tagit fart, som Euronext säkert hoppats när kontraktet introducerades för några år sedan. Nedan ser vi prisutvecklingen på novemberkontraktet på maltkorn och dit för kvarnvete. Vi ser att de följer vandra åt tämligen väl. Om man skulle använda Matifs kvarnvetekontrakt för att prissäkra maltkorn blir inte följsamheten fullt så dålig som man skulle kunna tro.
Majs
Majspriset (december 2013) föll kraftigt i veckan som gick efter att ha brutit det stöd du kunde läsa om förra veckan. Priset har nu fallit ner till ett prisområde där det finns tre ganska starka tekniska stöd. Det mest sannolika härifrån är att marknaden konsoliderar sig med sidledes rörelse, eventuellt ner mot 550 cent.
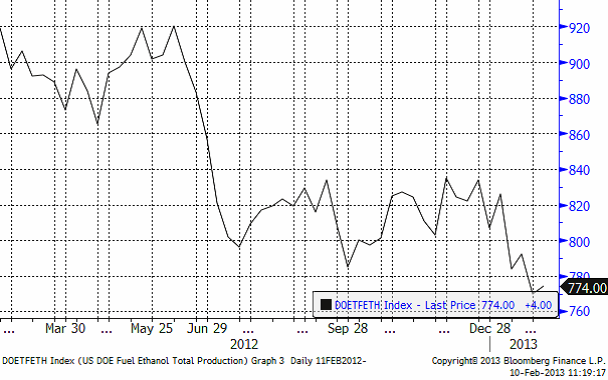
Veckovis etanolproduktion i USA ökade till 704,000 fat per dag från förra veckans rekordlåga 700,000 fat.
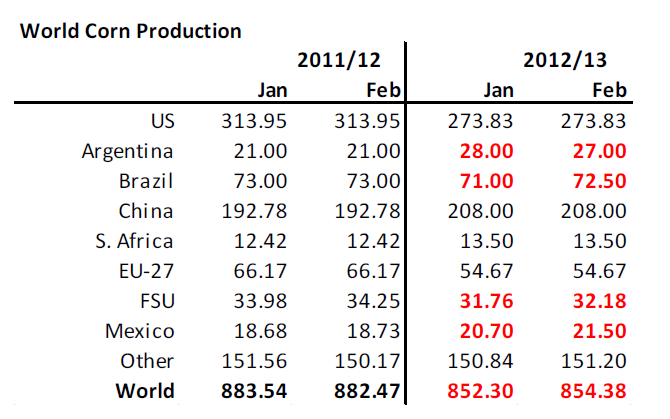
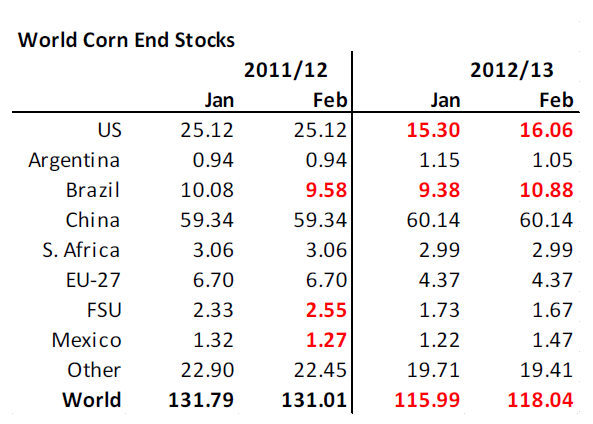
Så till fredagens WASDE-rapport. Argentina justerades ner och Brasilien upp. Det var väntat efter det väder som varit. Ukraina och Mexiko justerades också upp något. Brasilianska CONAB förutspår dock en skörd om 76 mt och där ligger USDA efter med 72.5 mt. USDA ligger i och för sig också efter vad man kan tro om ännu lägre skörd i Argentina. På global basis, som vi ser nedan, en något högre väntad skörd i år.
Utgående lager höjdes tillräckligt i rapporten för att ge säljarna ytterligare vind i seglen. Men det är kommer fortfarande att bli ont om majs i sommar, innan den nya skörden kommer in.
Nedan ser vi relationen mellan lager och pris. Liksom för vetet visar diagrammet förhållandet mellan lager och pris varje år i februari.
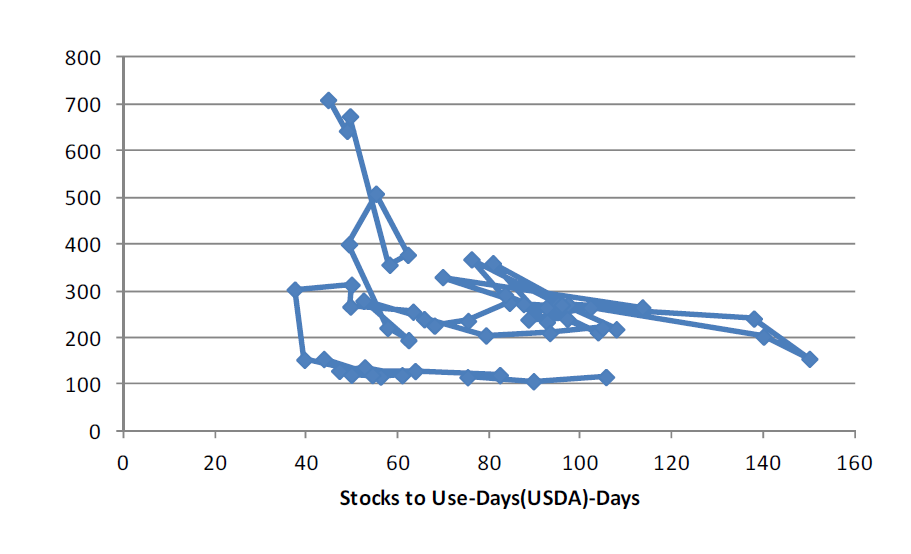
Även fast lagren är så små att det inte finns så många punkter med lägre lager att förlita sig på, förefaller inte priset nu avvika allt för mycket från de senaste årens relation mellan lager och pris. Vi fortsätter att ha en neutral vy på majs.
Sojabönor
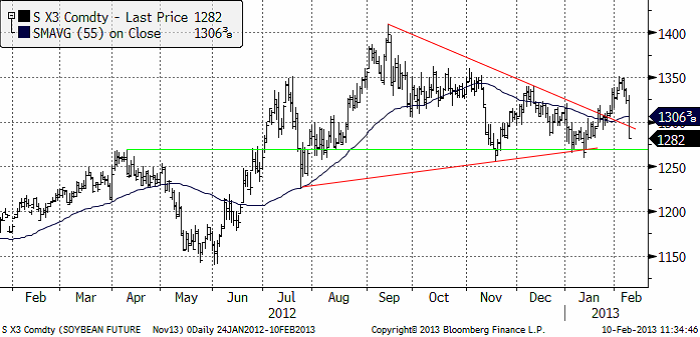
Sojabönorna (november 2013) föll kraftigt efter WASDE-rapporten i fredags. Nästan ända ner till de tekniska stöden vid 1260 cent per bushel. Nedanför ser vi kurdiagrammet för sojabönor (november 2013).
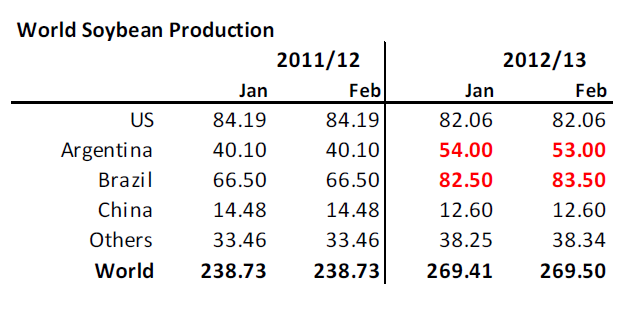
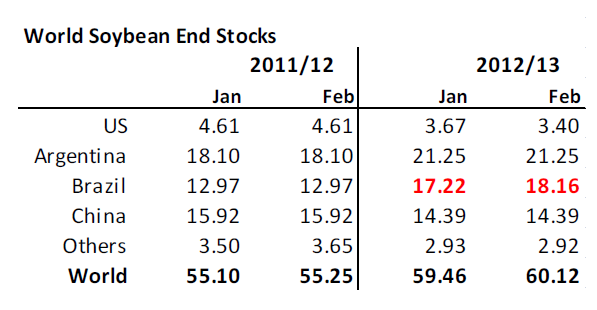
WASDE-rapportens produktionsestimat handlade helt om Sydamerika. Argentinas väntade skörd justerades ner 1 mt och Brasiliens upp lika mycket. Resten lämnades oförändrat.
Nedan ser vi USDA:s estimat på utgående lager. Det är inte någon kioskvältare på papperet. En höjning med lite drygt 0.5 mt. Lagren i USA sänktes till 3.40 från 3.67 mt. Utgående lager i Brasilien höjdes.
Nedan ser vi relationen mellan pris och lager. I förhållande till de senaste årens relation, ser låg priset innan rapporten något högt. Efter fredagens prisfall ligger priset mer eller mindre mitt i linje med den historiska relationen.
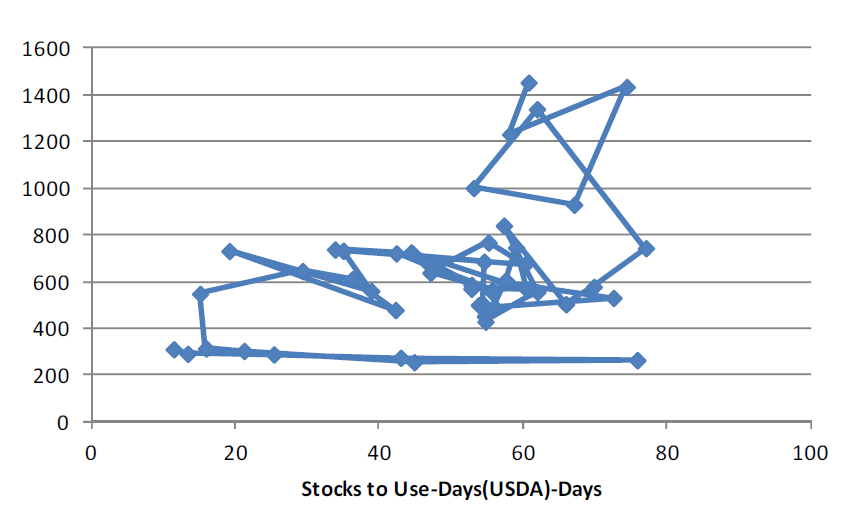
Vi fortsätter därför att ha en neutral rekommendation på sojabönorna.
Raps
Rapspriset (november 2013) har utvecklat sig starkare än sojabönorna. Ett försök att handla rapsen högre i veckan hindrades dock av WASDE-rapporten och det betydande prisfallet efter den i sojabönsmarknaden.
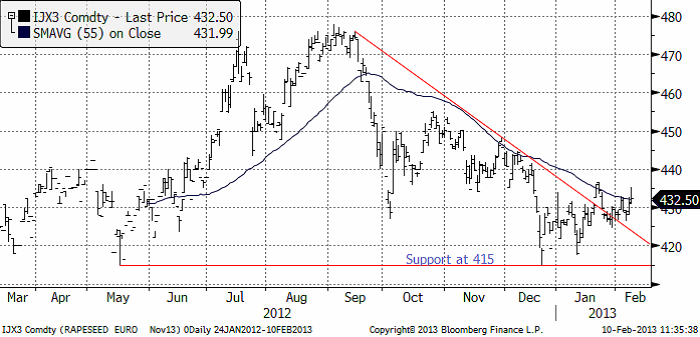
Vi ligger kvar med vår negativa vy för rapspriset.
Gris
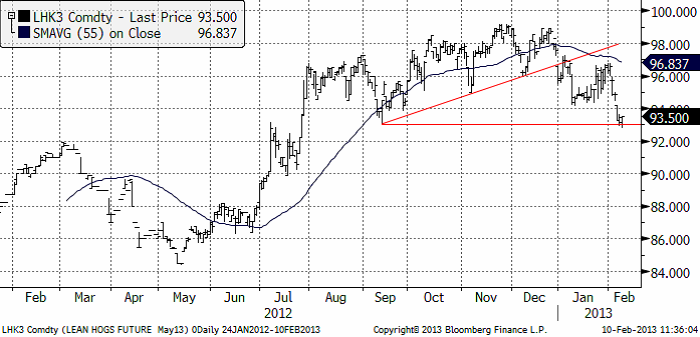
Grispriset (Maj 13) föll förra veckan ner till 93.50. Läsare av veckobrevet har tidigare kunnat läsa att rekylen uppåt efter brottet av den tekniska stödnivån skulle tolkas som ett tillfälle att sälja. Det visade sig vara rätt. Nu ligger priset på stödet och därifrån får marknaden visa vägen. Ännu ett brott nedåt innebär att prisfallet kan fortsätta.
Mjölk
Fonterras auktion i onsdags visade på en prisuppgång på SMP. På Eurex fortsatte dock kräftgången i SMP. Prisutvecklingen på smör fortsatte att falla tillbaka efter toppen i december. I diagrammet nedan ser vi nu fyra kurvor. Den övre tunna linjen är EUREX SMP. Den nedre tunna linjen är Eurex SMP. Den rosa linjen visar priset på helmjölkspulver (WMP) FOB Västeuropa. Källan är USDA och priserna uppdateras varannan vecka. Den röda linjen är Fonterras auktion.
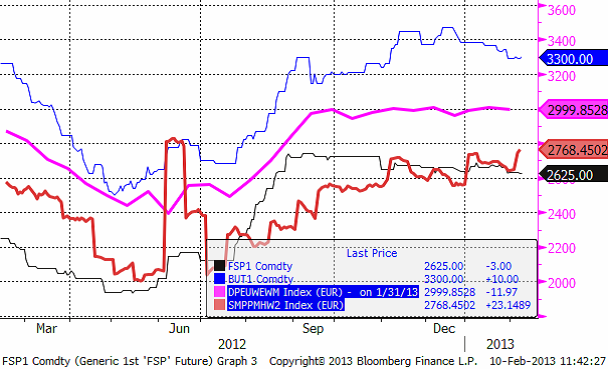
Beprövad erfarenhet säger att vi ska vänta oss ett nytt kraftigt prisfall inom kort.
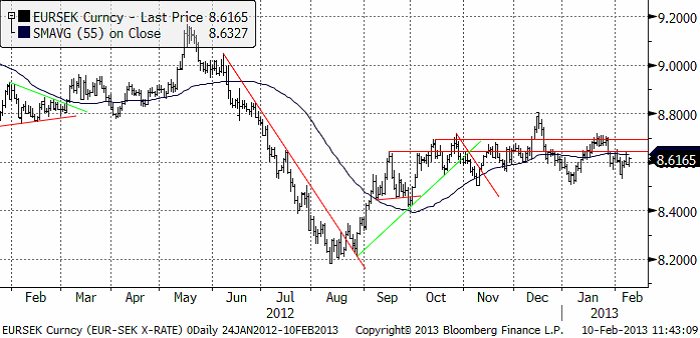
EURSEK
EURSEK fortsatte att röra sig sidledes i veckan som gick. Utsikterna för den kommande veckan är att detta kommer att fortsätta.
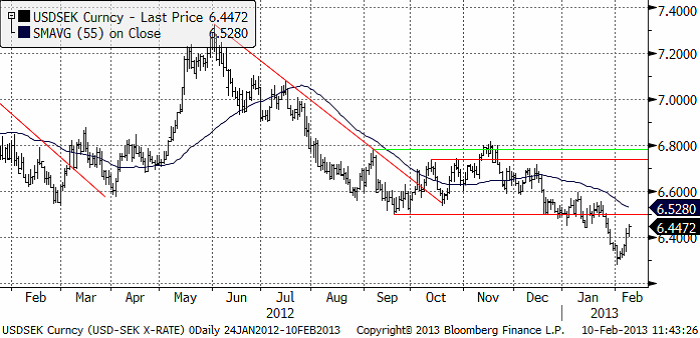
USDSEK
Dollarn rekylerade uppåt mot slutet av veckan. Detta ser ut knappast ut som ett trendbrott, utan som en rekyl i en fallande trend. Därmed är det ett säljtillfälle.
[box]SEB Veckobrev Jordbruksprodukter är producerat av SEB Merchant Banking och publiceras i samarbete och med tillstånd på Råvarumarknaden.se[/box]
Disclaimer
The information in this document has been compiled by SEB Merchant Banking, a division within Skandinaviska Enskilda Banken AB (publ) (“SEB”).
Opinions contained in this report represent the bank’s present opinion only and are subject to change without notice. All information contained in this report has been compiled in good faith from sources believed to be reliable. However, no representation or warranty, expressed or implied, is made with respect to the completeness or accuracy of its contents and the information is not to be relied upon as authoritative. Anyone considering taking actions based upon the content of this document is urged to base his or her investment decisions upon such investigations as he or she deems necessary. This document is being provided as information only, and no specific actions are being solicited as a result of it; to the extent permitted by law, no liability whatsoever is accepted for any direct or consequential loss arising from use of this document or its contents.
About SEB
SEB is a public company incorporated in Stockholm, Sweden, with limited liability. It is a participant at major Nordic and other European Regulated Markets and Multilateral Trading Facilities (as well as some non-European equivalent markets) for trading in financial instruments, such as markets operated by NASDAQ OMX, NYSE Euronext, London Stock Exchange, Deutsche Börse, Swiss Exchanges, Turquoise and Chi-X. SEB is authorized and regulated by Finansinspektionen in Sweden; it is authorized and subject to limited regulation by the Financial Services Authority for the conduct of designated investment business in the UK, and is subject to the provisions of relevant regulators in all other jurisdictions where SEB conducts operations. SEB Merchant Banking. All rights reserved.

Selling down on a ”deal”. Brent crude fell 6.2% last week with accelerated weakness towards the end of the week. Close of the week at $87.33/b and low of the week (and on Friday) of $85.8/b. Brent is falling another 4% this morning to $83.7/b on confirmation by Iran that a MoU text has been reached and that it will be signed on Friday this week.

So what is this ”deal” worth? Talk on the desk here this morning is that it is much like ”putting lipstick on a pig” where Trump has to sell this at home as a victory where ”the SoH has reopened”, the nuclear issue will be ironed out over the coming 60 days (or maybe 600 days?) and US consumers are getting a lower gasoline price and maybe US republicans survives the midterm elections.
The importance for Iran is that it emerges as the defacto winner of this war in the eyes of the non-US public world. That Iran now onwards is the ”ruler of the SoH” (combo of geography and new weapons systems like drones) or more softer: ”the guarantor of safe passage through the SoH”.
Iran doesn’t need nuclear weapons any more. Nuclear deterrence doesn’t work any more. Ukraine has made many attacks deep into Russia without being nuked in return. Plenty of Iranian ballistic rockets blasts over Israel but Iran wasn’t nuked in return.
There is no trust between the US and Iran. We don’t know all the details yet of the MoU. But what we do know is that there is no trust between the US and Iran what so ever. This is probably more like a descriptive text on how they can cooperate in a way where both sides keeps tactical leverage. Neither side makes irreversible concessions. Violations can be punished quickly. Cooperation produces immediate benefits.
This is a fragile structure. It can easily break down. There may be details which cannot be overcome. To be seen on Friday. The US has to show that it is willing put enough force behind managing and restraining Israel versus Hezbollah in Lebanon. We have seen that Netanyahu hasn’t listened all that much to Trump’s directives and wishes. This could be a major obstacle.
A gradual reopening is tactically preferable for Iran. A tactical leverage for Iran right now is that global oil stocks have been drawn down towards painful and increasingly dangerous levels with increasing risks for oil price spikes in mid-July to August. This together with US midterm elections on 3 November gives tactical leverage to Iran. Iran probably doesn’t want to fully give up on that leverage. A rapid, full reopening where global stocks are able to refill over the coming 60 days will significantly erode that leverage. If Iran reinstates a closure of the SoH after 60 days (if talks break down again), then the effect won’t be that impactful in terms of prices and the US midterm elections.
So a gradual and partial reopening where global markets gets the oil they need while they are unable to rebuild stocks could be a practical middle way for both parties. Trump can sell it as ”the SoH has reopened” and get affordable gasoline for US consumers. Iran can sell it as ”the SoH has fully reopened, but there is some friction” so flow is only 60-80% of normal.
Not much real demand destruction below $100/b. What we do know is that there is not much real price pain demand destruction for oil globally at an oil price below $100/b. A lot of demand-shock destruction. Fear. But demand should now come roaring back towards normal with fear for exceptionally high prices now is rapidly receding.
Sudden China demand destruction due to EVs? Bullocks. EV share of total Chinese carpool now around 13%. Share of new sales of EVs has reached 50%. This is a very gradual process. It doesn’t make oil demand fall like a rock over night. When EV new sales share reaches 100%, then the gasoline car pool will contract by some 5-10% per year. But that is only gasoline. Sudden reduction in Chinese oil demand is more about shock and risk.
Chinese crude oil imports will come roaring back. At what price? Today’s ”neutral” oil price is $70/b. That is the five year price which has steadily traded around the $70/b mark over the past 3-4 years. With still a risky picture one would think that China and the rest of the world will be big buyers of oil in the range of $70-85/b.
Global demand will likely snap back towards normal, forecasted demand and growth at such prices.
Physical reopening is a gradual process. The physical and practical reopening of the SoH will likely be gradual rather than sudden. And that probably suites Iran tactically as well.
Brent M1 price versus the Brent 5-yr (today’s ”normal” price)

Market is starting to take US/Iran headlines with a pinch of salt. Brent crude rose $2.8/b yesterday to an official close of $112.1/b. But after that it traded as low as $108.05/b before ending late night at around $109.7/b. Through the day it traded in a range of $106.87 – 112.72/b amid a flurry of news or rumors from Iran and the US. ”US temporary sanctions during negotiations” (falls alarm). ”We will bomb Iran” (not anyhow),… etc. While the market is still fluctuating to this kind of news flow, it is starting to take such headlines with a pinch of salt.
We’ll see. Maybe, maybe not. The Brent M1 contract is trading at $110.2/b this morning which very close to the average ticks through yesterday of $110.4/b.
Trump with bearish, verbal intervention whenever Brent trades above $110/b it seems. What seems to be a pattern is that Trump states something like ”very good negotiations going on with Iran”, ”New leaders in Iran are great,..”, ”Great progress in negotiations,…”, ”Deal in sight,..” etc whenever the Brent M1 contract trades above $110/b. An effort to cool the market. These hot air verbal interventions from Trump used to have a heavy bearish impact on prices, but they now seems to have less and less effect unless they are backed by reality.
As far as we can see there has been no real progress in the negotiations between the US and Iran with both sides still standing by their previous demands.
Iran is getting stronger while the cease fire lasts making a return to war for Trump yet harder. Iran is naturally in constant preparation for a return to war given Trump’s steady threats of bombing Iran again. Iran is naturally doing what ever is possible to prepare for a return to war. And every day the cease fire lasts it is better prepared. This naturally makes it more and more difficult and dangerous for the US to return to warring activity versus Iran as the consequences for energy infrastructure in the Persian Gulf will be more and more severe the longer the cease fire lasts. Israel seems to see it this way as well. That the war is not won and that current frozen state of a cease fire gives Iran opportunity to rebuild military and politically.
Global inventories are drawing down day by day. How much? In the meantime the Strait of Hormuz stays closed. There is varying measures and estimates of how much global inventories are drawing down. Our rough estimate, back of the envelope, is that global inventories are drawing down by at least some 10 mb/d or about 300 mb/d in a balance between loss of supply versus demand destruction. Other estimates we see are a monthly draw of 250-270 mb/d. The IEA only ’measured’ a draw in global observable stocks of 117 mb in April with oil on water rising 53 mb while on shore stocks fell 170 mb. But global stocks are hard to measure with large invisible, unmeasured stocks. As such a back of the envelope approach may be better.
Oil products is what the world is consuming. Oil product prices likely to rise while product stocks fall. Strategic Petroleum Reserves (SPR) are predominantly crude oil. Discharging oil from OECD SPR stocks, a sharp reduction in Chinese crude imports and a reduction in global refinery throughput of 6-7 mb/d has helped to keep crude oil markets satisfactorily supplied. But global inventories are drawing down none the less. And oil products is really what the world is consuming. So if global refinery throughput stays subdued, then demand will eventually have to match the supply of oil products. The likely path forward this summer is a steady draw down in jet fuel, diesel and gasoline. Higher prices for these. Then, if possible, higher refinery throughput and higher usage of crude in response to very profitable refinery margins. And lastly sharper draw in crude stocks and higher prices for these. But some 6 mb/d of oil products used to be exported through the Strait of Hormuz. And it may not be so easy to ramp up refinery activity across the world to compensate. Especially as Ukraine continues to damage Russian refineries as well as Russian crude production and export facilities.
Watch oil product stocks and prices as well as Brent calendar 2027. What to watch for this summer is thus oil product inventories falling and oil product premiums to crude rising. Another measure to watch is the Brent crude 2027 contract as it rises steadily day by day as the Strait of Hormuz stays closed and global oil inventories decline. The latter is close to the highest level since the start of the war and keeps rising.
The Brent M1 contract and the Brent 2027 prices and current price of jet fuel in Europe (ARA). All in USD/b

Our back of the envelope calculation of the global shortage created by the closure of the Strait of Hormuz. Note that 3.5 mb/d of discharge from SPR is also a draw. Note also that ’Forced demand loss’ of 2.5 mb/d is probably temporary and will fall back towards zero as logistics are sorted out leaving ’Price demand loss’ to do the job of balancing the market. Thus a shortfall of at least 9 mb/d created by the closure. More if SPR discharge is included and more if Forced demand loss recedes.

Brent is climbing higher. Front-month is at USD 106.3/bl this morning, close to a weekly high and a USD 9/bl jump from Mondays open. This is the move we flagged as a risk earlier in the week: the market shifting from ”a deal is around the corner” to ”this is going to take longer than we thought”.

Analyst Commodities, SEB
During April, rest-of-year Brent remained remarkably stable around USD 90/bl. A stability which rested on one single assumption: the SoH reopens around 1 May. That assumption is now slowly falling apart.
As we highlighted yesterday: every week of delay beyond 1 May adds (theoretically) ish USD 5/bl to the rest-of-year average, as global inventories draw 100 million barrels per week. i.e., a mid-May reopening implies rest-of-year Brent closer to USD 100/bl, and anything pushing into June or July takes us meaningfully higher.
What’s changed in the last 48 hours:
#1: The US military has formally warned that clearing suspected sea mines from SoH could take up to six months. That is a completely different timescale from what the financial market is pricing. Even a political deal tomorrow does not immediately reopen the strait.
#2: Trump has shifted his tone from urgency to ”strategic patience”. In yesterday’s press conference: ”Don’t rush me… I want a great deal.” The market is reading this as a president no longer feeling pressured by timelines, with the naval blockade running in the background.
#3: So far, the military activity is escalating, not de-escalating. Axios reports Iran is laying more mines in SoH. The US 3rd carrier strike group (USS George H.W. Bush) is arriving with two countermine vessels. Trump yesterday ordered the US Navy to destroy any Iranian boats caught laying mines. While CNN reports that the Pentagon is actively drawing up plans to strike Iranian SoH capabilities and individual Iranian military leaders if the ceasefire collapses. i.e., NOT a attitude consistent with an imminent deal!
Spot crude and product prices eased off the early-April highs on a combination of system rerouting and deal optimism. Both now weakening. Goldman estimates April Gulf output is reduced by 14.5 mbl/d, or 57% of pre-war supply, a number that keeps getting worse the longer this drags on.
Demand-side adaptation is ongoing: S. Korea has cut its Middle East crude dependence from 69% to 56% by pulling more from the Americas and Africa, and Japan is kicking off a second round of SPR releases from 1 May. But SPRs are finite.
Ref. to the negotiations, we should not bet on speed. The current Iranian leadership is dominated by genuine hardliners willing to absorb economic pain and run the clock to extract concessions. That is not a setup for a rapid resolution. US/Israeli media briefings keep framing the delay as ”internal Iranian divisions”, the reality is more complicated and points toward weeks and months, not days.
Our point is that the complexity is large, and higher prices have only just started (given a scenario where the negotiations drag out in time). The market spent April leaning on the USD 90/bl rest-of-year assumption; that case is diminishing by the hour. If ”early May reopening” is replaced by ”June, July or later” over the next week or two, both crude and products have meaningful room to reprice higher from here. There is a high risk being short energy and betting on any immediate political resolution(!).


Vattenfalls och Industrikrafts kärnkraftsbolag Videberg Kraft har valt Rolls-Royce SMR
Selling down on a ”deal”

Sommarväder skapar prisrally på elbörsen
Oil product price pain is set to rise as the Strait of Hormuz stays closed into summer

Solkraften pressar elpriserna dagtid
Oil product price pain is set to rise as the Strait of Hormuz stays closed into summer
Sommarväder skapar prisrally på elbörsen
Vattenfalls och Industrikrafts kärnkraftsbolag Videberg Kraft har valt Rolls-Royce SMR
Selling down on a ”deal”
-
Analys4 veckor sedan
Oil product price pain is set to rise as the Strait of Hormuz stays closed into summer
-
Nyheter2 veckor sedan
Sommarväder skapar prisrally på elbörsen
-
 Nyheter2 dagar sedan
Vattenfalls och Industrikrafts kärnkraftsbolag Videberg Kraft har valt Rolls-Royce SMR
-
Analys2 dagar sedan
Selling down on a ”deal”