

Analys
Risk for OPEC dissapointment and a short term sell-off as all bets are on the long side

 Marked has placed all chips on the long side betting on an extension of OPEC/non-OPEC production cuts which officially ends in Q1-18. In general we do think that OPEC/non-OPEC will manage the market and hold back production if needed through 2018 in order to secure further gradual draw down of OECD inventories. However we also think that it would be better for OPEC/non-OPEC to make hard decissions on this in Feb/Mar getting as much data as possible before making that decission. That is also what the group has mostly consistengly communicated through the autumn. The market seems to expect and demand a firm decission right now this week. As such the market is rigged for dissapointment with a possible short term sell-off as all chips are on the long side.
On Thursday 30th OPEC and some non-OPEC producers will meet in Vienna to discuss whether to extend current production cuts or not.
The communication all through the autumn has been that they want to make this decission in February/March 2018 in order to have as much data on the table as possible before making the decission.
That makes a lot of sense since there is substantial dissagreement with respect to how much oil is needed from OPEC in 2018.
Somehow the market has geared it self up to an expectation that OPEC/non-OPEC needs to make a firm decission on this right now on Thursday. And further that the decission will be an extension of current cuts maintained all to the end of 2018.
As such it seems to us that there is a substantial risk that the market is setting it self up for a dissapointment this week. For us it makes much more sense for the group to make this call in Feb/Mar which is also what they mostly have been communicating all through the autumn.
The challenge for the group this is week may thus be all about managing the market’s expectations. How not to let the market down when it communicates that the decission will be taken in Feb/March.
And if there is a decission this week it is likely going to be a sign of intention: “If needed we’ll maintain cuts to the end of 2018”, or “We’ll maintain cuts to June 2018 and then make a new assessment”, or “We are all in agreement that we’ll extend cuts as long as needed in order to drive OECD inventories down to the 5 year average”.
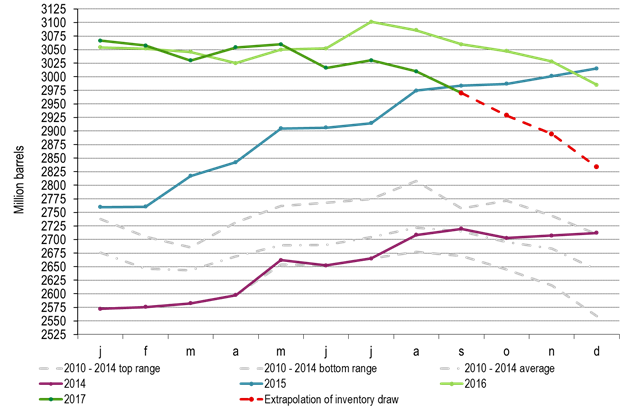
That is indeed a trickey reference. This is because for every month we move forward the 5 year average reference is rising. Since March 2017 the OECD inventories have declined some 0.7 mb/d when adjusting for seasonal trends (given by the 2010-2014 seasonal average profile). If we extend this decline rate on top of the seasonal trend (2010-2014) we actually almost get all the way down the 2013-2017 average profile.
As such one can say that in February when we get the OECD inventory data for December 2017 the goal of getting inventories down to the 5 year average (2013-2017) will have been achieved. The goal of getting OECD inventories down to the 5 year average is thus a trickey goal and a moving target.
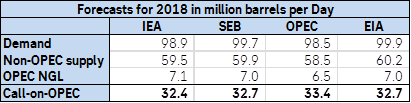
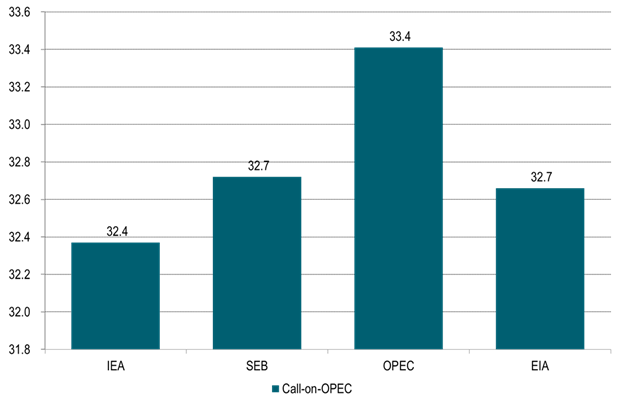
The big question though is what is really needed in order to secure a balanced oil market in 2018? There is a significant dissagreement on this. The IEA says that call-on-OPEC will be 32.4 mb/d in 2018. SEB’s estimate is 32.7 mb/d, the US EIA’s is 32.7 mb/d while OPEC’s own estimate is 33.4 mb/d. Variations on this comes down to projections for demand, US shale oil production and the level of OPEC’s NGL production in 2018.
The OECD draw down since March this year of 0.7 mb/d (adjusted for seasonallity) indicates an implied oil market deficit of 0.7 mb/d thrugh Q2 and Q3 this year during which OPEC produced 32.55 mb/d. However, if we assume that the OECD inventories only cover half or a third of global inventories then what we see of deficit implied by the draw down in the OECD inventories could actually be two or three times as much if there have been comparable draw downs in non-OECD inventories.
Thus beeing carefule about committing to further cuts now on Thursday seems kind of sensible with the aim of instead making that decission in Feb/Mar.
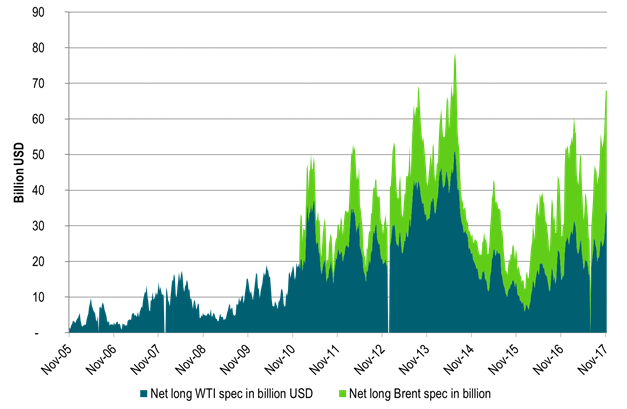
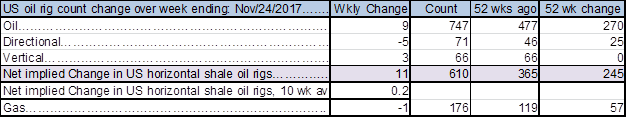
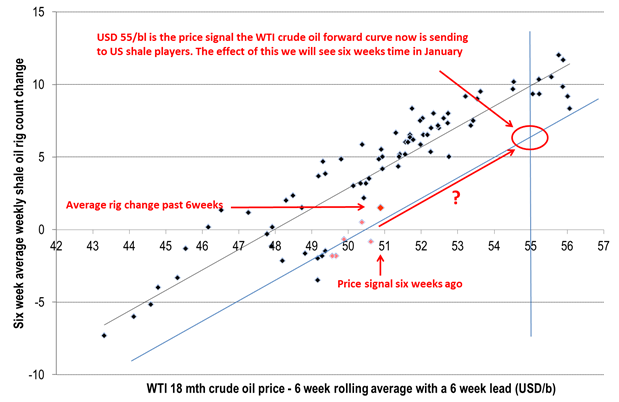
Market participants are seemingly all expecting OPEC/non-OPEC to make a firm and clear decission this Thursday for extending current cuts to Dec-2018. Net long speculative positions for Brent and WTI together are now very close to all time high. US oil rig count has started to rise again (+9 rigs last week). The decission to add these 9 rigs was probably taken some 6-8 weeks ago when the WTI forward price only stood at $51-52/b. Now that reference WTI price stands at $55/bl with a clear risk for a rise in rig count in the weeks to come. The outage of the 590 kbl/d Keystone pipeline due to an oil spill has reduced supply into Cushing Oklahoma by some 4 mbl/week. It has helped to reduce Chushing inventories and to drive also the WTI crude curve into backwardation. However, the Keystone pipline is likely to back in operation within a week or so.
Thus overall there is a fair chance that the market will be dissapointed on Thursday. That there will be no firm decission even though there will be firm support for further cuts if needed. And if OPEC/non-OPEC actually do make a firm decission to maintain cuts all to the end of 2018 then there may not be much upside price action since that decission is already so highly priced in already.
Thus buying a put option on the front month WTI contract with short time to expiry may be a good strattegy in the run-up to this week’s digital OPEC/non-OPEC decission risk on Thursday.
Our general stand on OPEC/non-OPEC cuts for 2018 is that further cuts are likely needed but also that if needed we expect OPEC/non-OPEC to manage the market in order to prevent inventories from rising back up.
Needed cuts will likely be of a magnitude which are perfectly manageable for the group. Why through away all they have acchieved in 2017 with inventory draw downs when they can hold back a little supply.
Ch1: OECD inventories with extrapolation to end of 2017 of the 0.7 mb/d draw down in Q2 and Q3 2017
Getting closer to the 2010-2014 average in December 2017
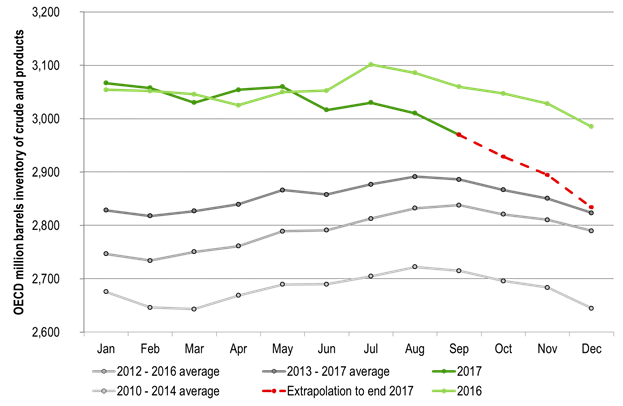
Ch2: OECD inventories. Which 5 year normal should you use? The 2013-2017?
If the latter then mission acomplished in December 2017, but we won’t know before February
Ch3: Call-on-OPEC 2018? – Big dissagreement!
Who knows OPEC NGL the best? Account for 0.6 mb/d difference to the IEA!
Ch4: Close to record USD allocation in net long speculative Brent crude oil positions
Makes it vulnerable to downside corrections and OPEC/non-OPEC dissapointments
Net long Brent crude oil speculative positions are now at the 3rd highest over the past 52 weeks
Ch5: US oil rig count has started to rise again
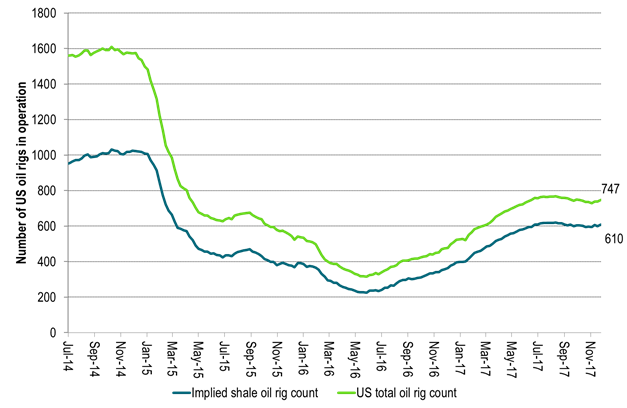
Ch6 The increas in rig count we see now came from price signals some 6-8 weeks ago
Since then the WTI curve price has moved from $51/bl to $55/bl.
The effect of the price rise over the past 6-8 weeks will be visible in terms of rig count over the coming 6-8 weeks
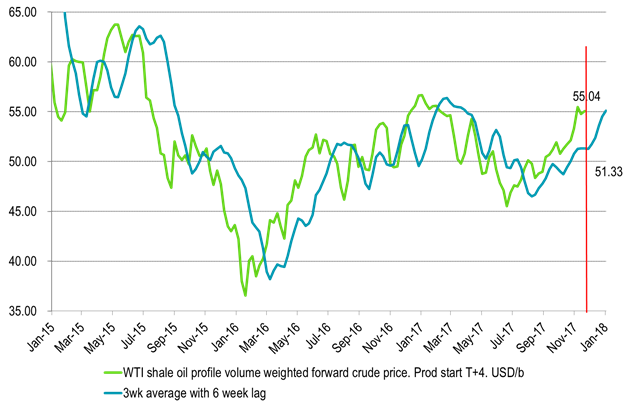
Ch7: Risk of rising rig count in the weeks to come
Could weight bearishly on the WTI crude oil price
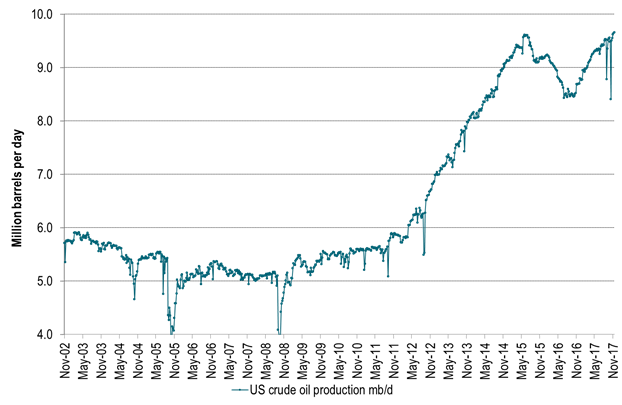
Ch8: While US crude oil production continues to rise
Will it rise 0.7 mb/d or 1.5 mb/d next year?
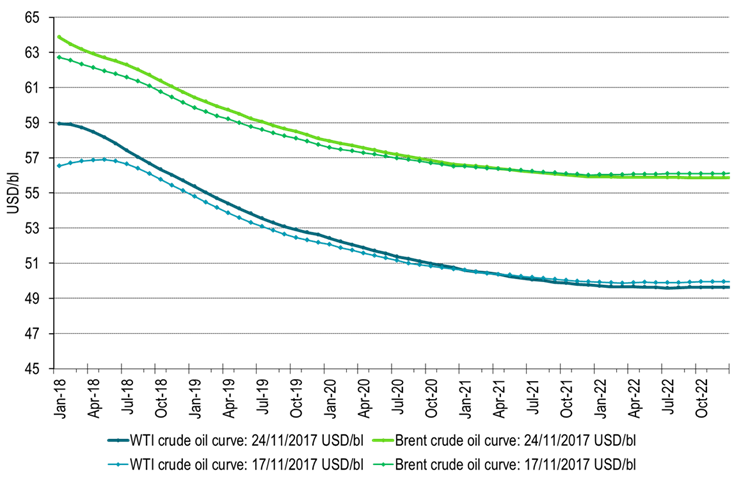
Ch9: WTI crude oil curve shifted into backwardation following the outage of the Keystone pipeline which feeds 590 kbl/d of Canadian oil into Chushing Oklahoma
The Keystone pipeline is likely going to be back on line within a week or so which could push the WTI curve back into contango again
Kind regards
Bjarne Schieldrop
Chief analyst, Commodities
SEB Markets
Merchant Banking
Down to the lowest since early May. Brent crude has fallen sharply the latest four days. It closed at USD 64.11/b yesterday which is the lowest since early May. It is staging a 1.3% rebound this morning along with gains in both equities and industrial metals with an added touch of support from a softer USD on top.

What stands out the most to us this week is the collapse in the Dubai one to three months time-spread.
Dubai is medium sour crude. OPEC+ is in general medium sour crude production. Asian refineries are predominantly designed to process medium sour crude. So Dubai is the real measure of the balance between OPEC+ holding back or not versus Asian oil demand for consumption and stock building.
A sharp weakening of the front-end of the Dubai curve. The front-end of the Dubai crude curve has been holding out very solidly throughout this summer while the front-end of the Brent and WTI curves have been steadily softening. But the strength in the Dubai curve in our view was carrying the crude oil market in general. A source of strength in the crude oil market. The core of the strength.
The now finally sharp decline of the front-end of the Dubai crude curve is thus a strong shift. Weakness in the Dubai crude marker is weakness in the core of the oil market. The core which has helped to hold the oil market elevated.
Facts supports the weakening. Add in facts of Iraq lifting production from Kurdistan through Turkey. Saudi Arabia lifting production to 10 mb/d in September (normal production level) and lifting exports as well as domestic demand for oil for power for air con is fading along with summer heat. Add also in counter seasonal rise in US crude and product stocks last week. US oil stocks usually decline by 1.3 mb/week this time of year. Last week they instead rose 6.4 mb/week (+7.2 mb if including SPR). Total US commercial oil stocks are now only 2.1 mb below the 2015-19 seasonal average. US oil stocks normally decline from now to Christmas. If they instead continue to rise, then it will be strongly counter seasonal rise and will create a very strong bearish pressure on oil prices.
Will OPEC+ lift its voluntary quotas by zero, 137 kb/d, 500 kb/d or 1.5 mb/d? On Sunday of course OPEC+ will decide on how much to unwind of the remaining 1.5 mb/d of voluntary quotas for November. Will it be 137 kb/d yet again as for October? Will it be 500 kb/d as was talked about earlier this week? Or will it be a full unwind in one go of 1.5 mb/d? We think most likely now it will be at least 500 kb/d and possibly a full unwind. We discussed this in a not earlier this week: ”500 kb/d of voluntary quotas in October. But a full unwind of 1.5 mb/d”
The strength in the front-end of the Dubai curve held out through summer while Brent and WTI curve structures weakened steadily. That core strength helped to keep flat crude oil prices elevated close to the 70-line. Now also the Dubai curve has given in.

Brent crude oil forward curves

Total US commercial stocks now close to normal. Counter seasonal rise last week. Rest of year?

Total US crude and product stocks on a steady trend higher.

Analys
OPEC+ will likely unwind 500 kb/d of voluntary quotas in October. But a full unwind of 1.5 mb/d in one go could be in the cards
Down to mid-60ies as Iraq lifts production while Saudi may be tired of voluntary cut frugality. The Brent December contract dropped 1.6% yesterday to USD 66.03/b. This morning it is down another 0.3% to USD 65.8/b. The drop in the price came on the back of the combined news that Iraq has resumed 190 kb/d of production in Kurdistan with exports through Turkey while OPEC+ delegates send signals that the group will unwind the remaining 1.65 mb/d (less the 137 kb/d in October) of voluntary cuts at a pace of 500 kb/d per month pace.
Signals of accelerated unwind and Iraqi increase may be connected. Russia, Kazakhstan and Iraq were main offenders versus the voluntary quotas they had agreed to follow. Russia had a production ’debt’ (cumulative overproduction versus quota) of close to 90 mb in March this year while Kazakhstan had a ’debt’ of about 60 mb and the same for Iraq. This apparently made Saudi Arabia angry this spring. Why should Saudi Arabia hold back if the other voluntary cutters were just freeriding? Thus the sudden rapid unwinding of voluntary cuts. That is at least one angle of explanations for the accelerated unwinding.
If the offenders with production debts then refrained from lifting production as the voluntary cuts were rapidly unwinded, then they could ’pay back’ their ’debts’ as they would under-produce versus the new and steadily higher quotas.
Forget about Kazakhstan. Its production was just too far above the quotas with no hope that the country would hold back production due to cross-ownership of oil assets by international oil companies. But Russia and Iraq should be able to do it.
Iraqi cumulative overproduction versus quotas could reach 85-90 mb in October. Iraq has however steadily continued to overproduce by 3-5 mb per month. In July its new and gradually higher quota came close to equal with a cumulative overproduction of only 0.6 mb that month. In August again however its production had an overshoot of 100 kb/d or 3.1 mb for the month. Its cumulative production debt had then risen to close to 80 mb. We don’t know for September yet. But looking at October we now know that its production will likely average close to 4.5 mb/d due to the revival of 190 kb/d of production in Kurdistan. Its quota however will only be 4.24 mb/d. Its overproduction in October will thus likely be around 250 kb/d above its quota with its production debt rising another 7-8 mb to a total of close to 90 mb.
Again, why should Saudi Arabia be frugal while Iraq is freeriding. Better to get rid of the voluntary quotas as quickly as possible and then start all over with clean sheets.
Unwinding the remaining 1.513 mb/d in one go in October? If OPEC+ unwinds the remaining 1.513 mb/d of voluntary cuts in one big go in October, then Iraq’s quota will be around 4.4 mb/d for October versus its likely production of close to 4.5 mb/d for the coming month..
OPEC+ should thus unwind the remaining 1.513 mb/d (1.65 – 0.137 mb/d) in one go for October in order for the quota of Iraq to be able to keep track with Iraq’s actual production increase.
October 5 will show how it plays out. But a quota unwind of at least 500 kb/d for Oct seems likely. An overall increase of at least 500 kb/d in the voluntary quota for October looks likely. But it could be the whole 1.513 mb/d in one go. If the increase in the quota is ’only’ 500 kb/d then Iraqi cumulative production will still rise by 5.7 mb to a total of 85 mb in October.
Iraqi production debt versus quotas will likely rise by 5.7 mb in October if OPEC+ only lifts the overall quota by 500 kb/d in October. Here assuming historical production debt did not rise in September. That Iraq lifts its production by 190 kb/d in October to 4.47 mb/d (August level + 190 kb/d) and that OPEC+ unwinds 500 kb/d of the remining quotas in October when they decide on this on 5 October.

U.S. commercial crude inventories posted a marginal draw last week, falling by 0.6 million barrels to 414.8 million barrels. Inventories remain 4% below the five-year seasonal average, but the draw is far smaller than last week’s massive 9.3-million-barrel decline. Higher crude imports (+803,000 bl d WoW) and steady refinery runs (93% utilization) helped keep the crude balance relatively neutral.

Yet another drawdown indicates commercial crude inventories continue to trend below the 2015–2022 seasonal norm (~440 million barrels), though at 414.8 million barrels, levels are now almost exactly in line with both the 2023 and 2024 trajectory, suggesting stable YoY conditions (see page 3 attached).
Gasoline inventories dropped by 1.1 million barrels and are now 2% below the five-year average. The decline was broad-based, with both finished gasoline and blending components falling, indicating lower output and resilient end-user demand as we enter the shoulder season post-summer (see page 6 attached).
On the diesel side, distillate inventories declined by 1.7 million barrels, snapping a two-week streak of strong builds. At 125 million barrels, diesel inventories are once again 8% below the five-year average and trending near the low end of the historical range.
In total, commercial petroleum inventories (excl. SPR) slipped by 0.5 million barrels on the week to ish 1,281.5 million barrels. While essentially flat, this ends a two-week streak of meaningful builds, reflecting a return to a slightly tighter situation.
On the demand side, the DOE’s ‘products supplied’ metric (see page 6 attached), a proxy for implied consumption, softened slightly. Total demand for crude oil over the past four weeks averaged 20.5 million barrels per day, up just 0.9% YoY.
Summing up: This week’s report shows a re-tightening in diesel supply and modest draws across the board, while demand growth is beginning to flatten. Inventories remain structurally low, but the tone is less bullish than in recent weeks.


A sharp weakening at the core of the oil market: The Dubai curve

Guld nära 4000 USD och silver 50 USD, därför kan de fortsätta stiga
OPEC+ will likely unwind 500 kb/d of voluntary quotas in October. But a full unwind of 1.5 mb/d in one go could be in the cards

Blykalla och amerikanska Oklo inleder ett samarbete

Fortsatt stabilt elpris – men dubbelt så dyrt som i fjol

Eurobattery Minerals satsar på kritiska metaller för Europas självförsörjning

Mahvie Minerals i en guldtrend

Guldpriset kan närma sig 5000 USD om centralbankens oberoende skadas

OPEC signalerar att de inte bryr sig om oljepriset faller kommande månader
Volatile but going nowhere. Brent crude circles USD 66 as market weighs surplus vs risk
-
 Nyheter4 veckor sedan
Eurobattery Minerals satsar på kritiska metaller för Europas självförsörjning
-
 Nyheter3 veckor sedan
Mahvie Minerals i en guldtrend
-
 Nyheter4 veckor sedan
Guldpriset kan närma sig 5000 USD om centralbankens oberoende skadas
-
 Nyheter4 veckor sedan
OPEC signalerar att de inte bryr sig om oljepriset faller kommande månader
-
Analys3 veckor sedan
Volatile but going nowhere. Brent crude circles USD 66 as market weighs surplus vs risk
-

 Nyheter3 veckor sedan
Aktier i guldbolag laggar priset på guld
-

 Nyheter3 veckor sedan
Kinas elproduktion slog nytt rekord i augusti, vilket även kolkraft gjorde
-
 Nyheter2 veckor sedan
Tyskland har så höga elpriser att företag inte har råd att använda elektricitet